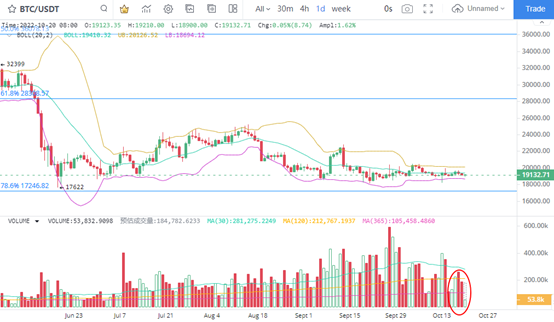
1. BTC impulse height fall back
BTC's daily K line chart shows that the short term price line again rose and fell, and the closing price remained above $19000. At the same time, the BTC amplitude remained low, and on October 19, the amplitude was only 1.52%, indicating that there was no sign of a breakthrough in the price trend. In terms of trading volume, the signs of daily K-line level trading heat drop, which means that the space for BTC to further rebound is still low.
Since June 18, the BTC price has moved towards a low level and large-scale operation stage. In the past four months, BTC has not been able to break away from the price range of 19000 to 25000. This shows that the cost price of BTC investors continues to focus around 20000 dollars. At this time, it is more difficult to leave the range quickly in a short time. However, in the phase of capacity contraction, BTC is gradually approaching the disk converter node.
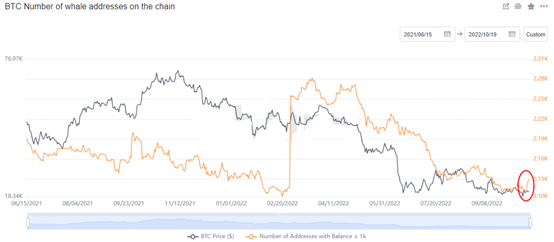
2. BTC's main currency holding increased slightly
The number of BTC coins held by the main players has rebounded recently. Since October 15, the number of BTC addresses with 1000 coins has increased by 27, and the overall number has rebounded to 2130 on October 19. In the same period, the BTC price rose from $19069 to $19123. Although the price increase was not high, the number of coins held by the whale increased by 27000.
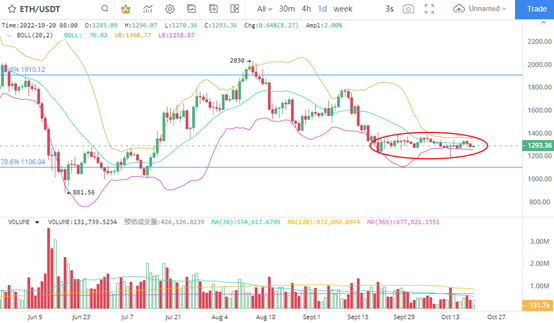
3. ETH represents an upward breakthrough
In terms of the Japanese K line, the ETH price has maintained stable operation. At present, the price is still operating around 1300 dollars, and short-term support is still strong. In terms of trading volume, ETH has kept shrinking for three consecutive weeks, making the price fluctuation space only 2.5%. From the performance of ETH volume and price, the consumption of selling in the short term is still low, which means that the sideways movement may continue. From the long-term trend, ETH is in a relatively important currency holding area, so the low absorption cost advantage of the current point is low.
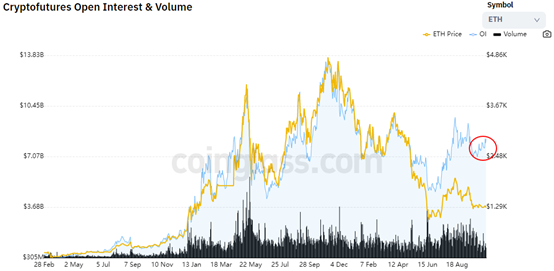
4. The number of ETH positions rebounded
The number of contract positions of ETH has rebounded, which is in sharp contrast to the recent sideways consolidation of ETH prices. That is to say, investors are gradually increasing their investment in order to obtain profits after confirming the breakthrough. The position rose to 8.243 billion US dollars from 7.057 billion US dollars on October 1. At the same time, we are concerned that the number of ETH positions has rebounded in shock, and the short-term peak value has reached a new high for three consecutive times, which means that the energy of the recent change is accumulating rapidly. At present, we should pay attention to the price breakthrough performance.
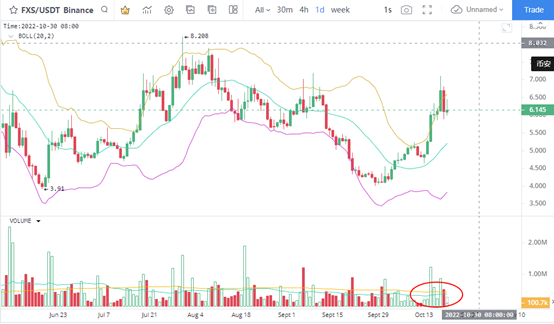
5. FXS rebounded
FSX has maintained the upward rhythm of price recently, ranking the first among the top 100 currencies in terms of market value, with a weekly increase of 27.2%. As an algorithmic stable currency, the rise of FXS is a price recovery of compensatory nature. At the same time, the trading volume of FXS is stable, and although the price has slightly retreated, it still maintains a relatively active trading state. Therefore, if you buy from the low point of the range, there is still room for profit. In terms of trend, LUNC can be linked to confirm the trend of price breakthrough.