Algorand price has been trying to sail through the choppy waters, the coin has moved against the broader market price movement.
Over the last 24 hours, Algorand has gained 2%, which means that ALGO is stuck in consolidation. In the past week, ALGO moved up by 3%.
This also signalled that the altcoin hasn’t made significant upward movement on the chart. The technical indicator of the altcoin showed that the bulls were still in control.
The buyers were still more than sellers, but the technical outlook also pointed out that the bulls would soon fizzle out in the market.
The demand for ALGO had slowed down, indicating that sellers would soon take control, bringing the price of the altcoin down to its next support level.
The support zone for the altcoin stood between $0.33 and $0.27 respectively. The demand for the altcoin has been dropping, which means that the coin will move near the $0.31 price mark.
Algorand Price: One Day Chart
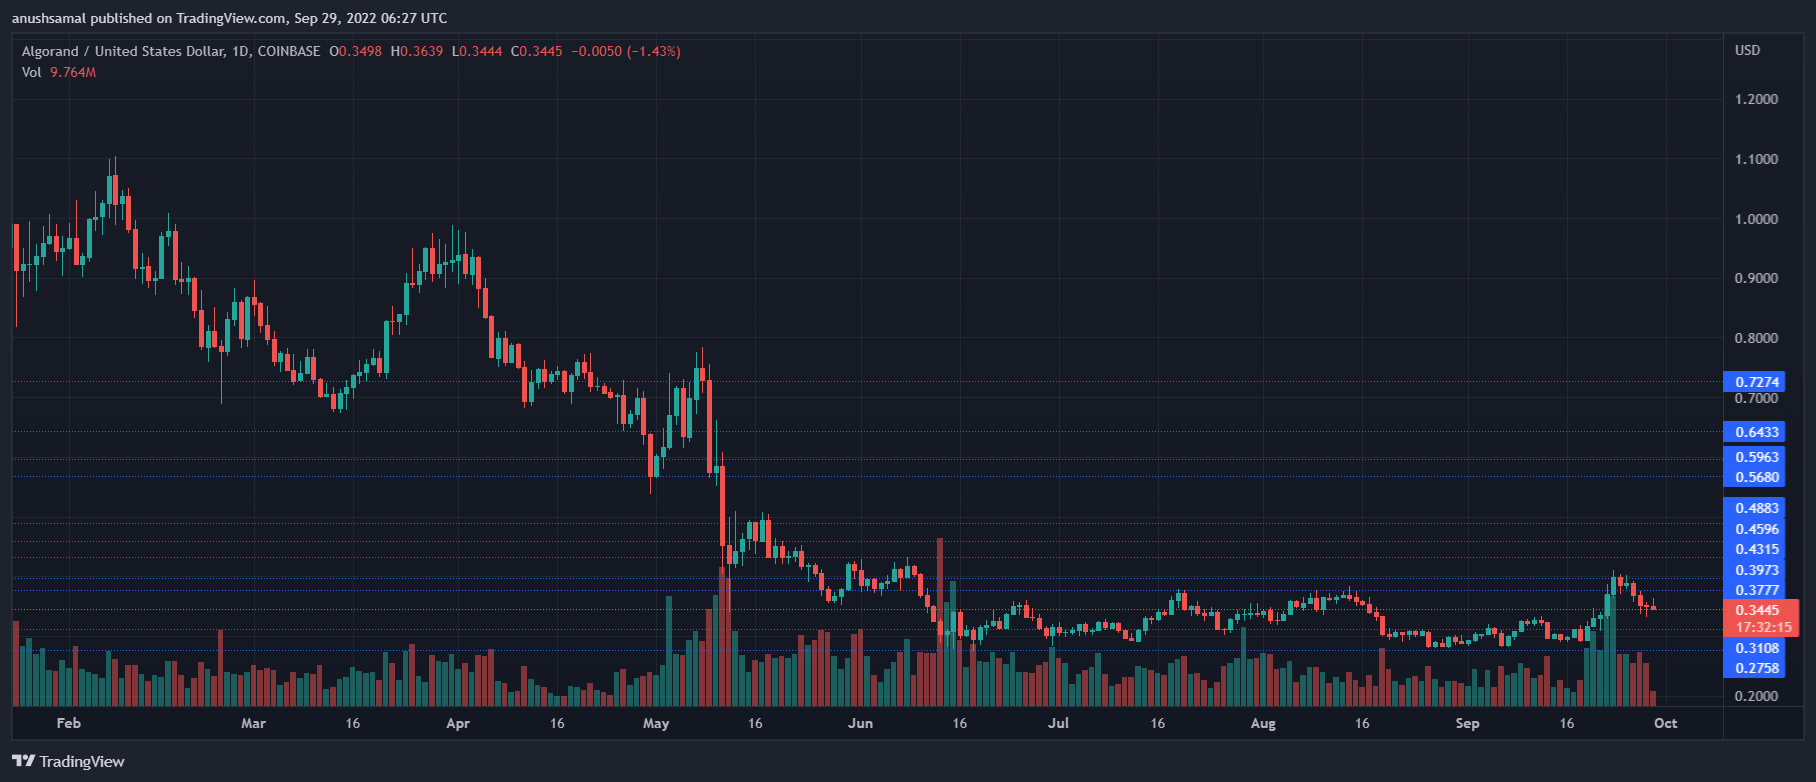
Algorand was priced at $0.34 on the one-day chart | Source: ALGOUSD on TradingView ALGO was trading for $0.34 at the time of writing. The coin was trading in a descending channel from which it broke out, but it was unable to add further fuel to its price owing to lower demand.
The immediate resistance for the coin stands at $0.40 and a push above that could help the bulls to stick around for longer.
On the other hand, the local support for the coin stood at $0.31. A fall from the $0.31 level will bring ALGO down to $0.27.
The amount of Algorand traded in the last session decreased considerably, pointing towards slowing buying strength.
Technical Analysis
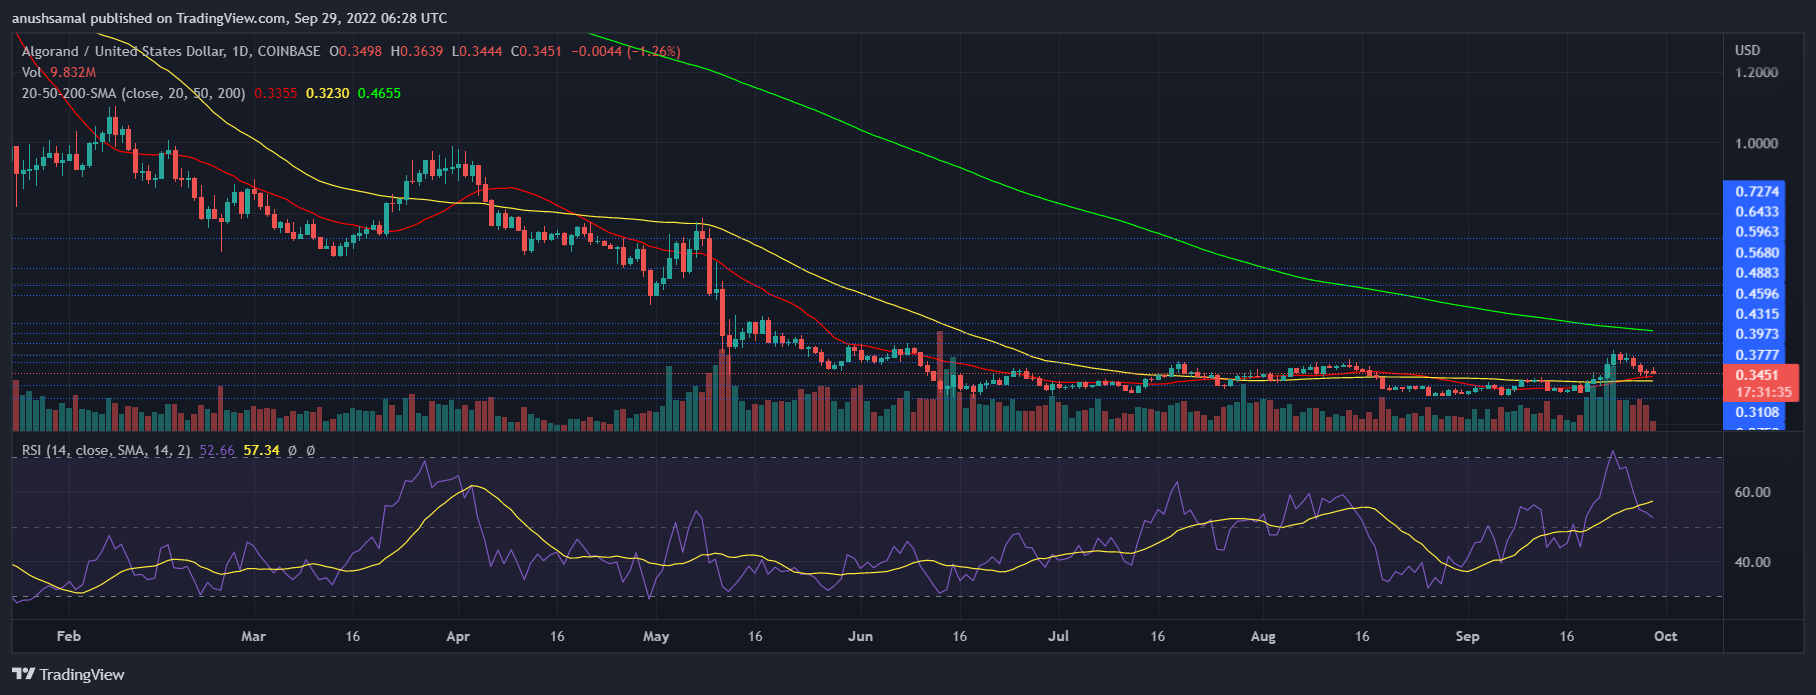
Algorand registered a fall in buying strength on the one-day chart | Source: ALGOUSD on TradingView ALGO’s technical indicators showed that the buying strength was falling on the chart. Indicators were yet to display the upcoming bearish sentiment.
The Relative Strength Index was above the half-line, which still meant that buyers were in control of the market.
The indicator also displayed a steep fall, which signalled that the upcoming trading sessions could be controlled by the sellers.
The Algorand price was still above the 20-SMA line, which pointed toward buyers driving the price momentum in the market. A continued fall in demand will push the price below the 20-SMA line.
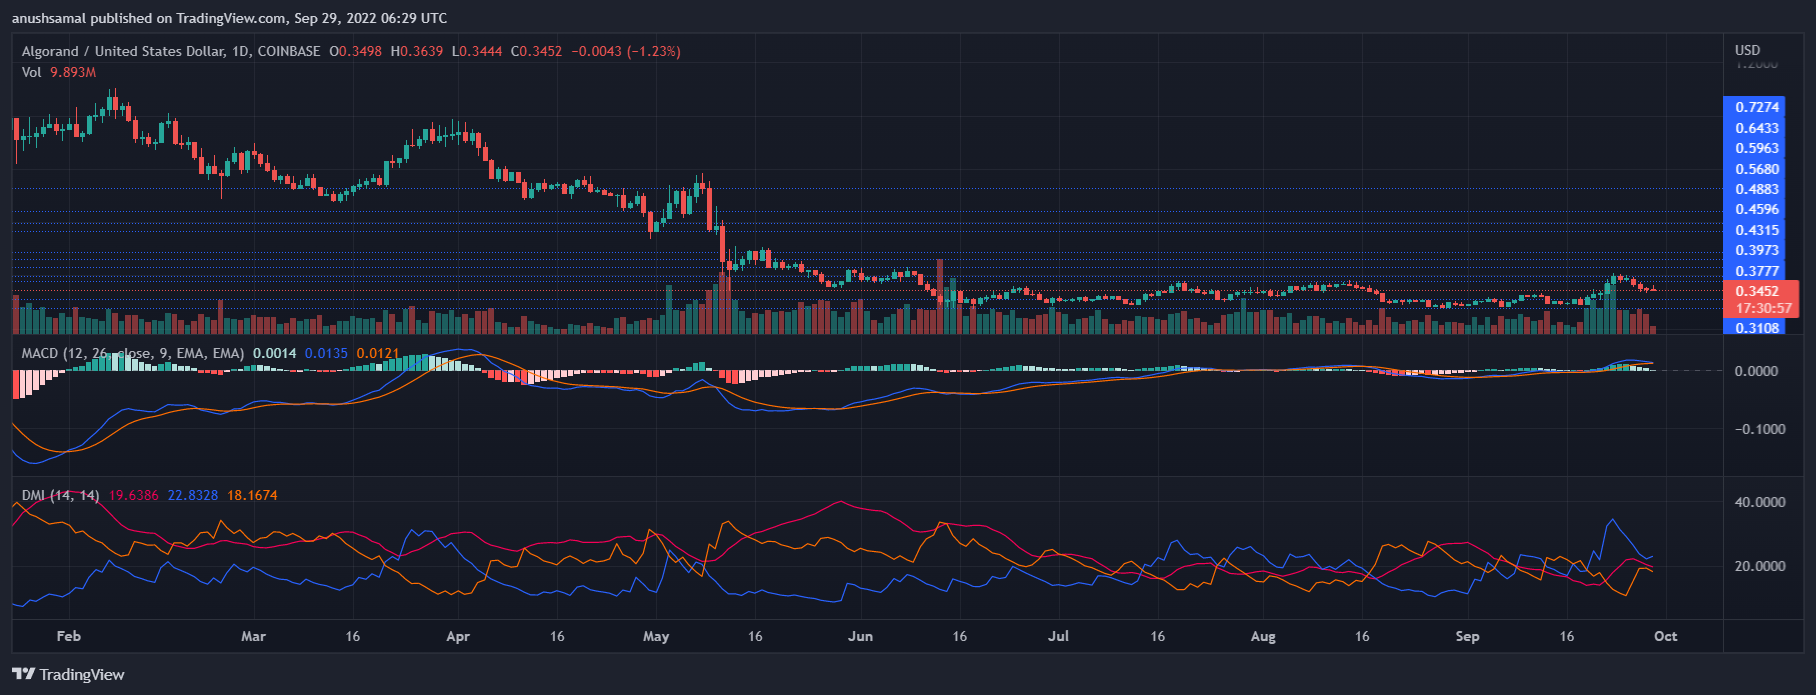
Algorand displayed buy signal on the one-day chart | Source: ALGOUSD on TradingView Other indicators also agreed with the major indicators that selling strength would soon take over in the market.
The Moving Average Convergence Divergence indicates the price momentum and action. MACD displayed green histograms, which was still buy signal on the chart.
These green histograms were declining on the chart, indicating that the bullish action was losing steam.
The Directional Movement Index shows the price direction. DMI was still positive with the +DI line above the -DI line. The Average Directional Index (red) was below the 20 mark, signifying a loss in the current price momentum.