Data is our best bet to understand the past, present, and future.
In traditional finance, obtaining data is relatively difficult. On the other hand, the blockchain has broken barriers to data, giving everyone access to a giant ledger of information. However, the amount of available data has created another problem: Finding valuable information is complicated.
There are dozens of tools out there to help people analyze DeFi data with a variety of metrics. However, these metrics are mostly quite basic. In this article, we will introduce the most useful metrics as well as the more advanced data available on Footprint Analytics’ upcoming tool, DeFi 360,
Basic Data
- TVL
TVL is usually the first metric people look at and it reflects the total value of all assets locked by users. TVL growth is often used to judge whether the project is in an upward trend.
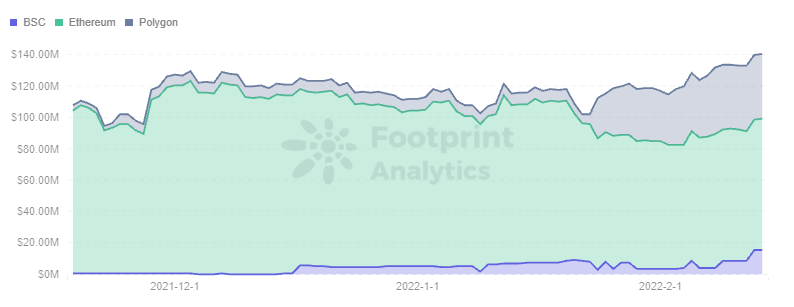

Footprint Analytics – TVL Trend
TVL is measured in dollars. Since cryptocurrency prices change rapidly, it is difficult to see whether the rise or fall in TVL is due to the price change or the addition of more investments. Therefore, in addition to the TVL, it is also necessary to pay attention to the adjusted TVL.
For example, statistics from Footprint Analytics show that TVL in ETH of Liquity (a lending program that can only lock ETH to lend out stablecoins) is slightly down in the black frame of the chart below, while TVL in USD is increasing. This is due to the rising price of ETH, which creates the illusion that the project is on an upward trend.
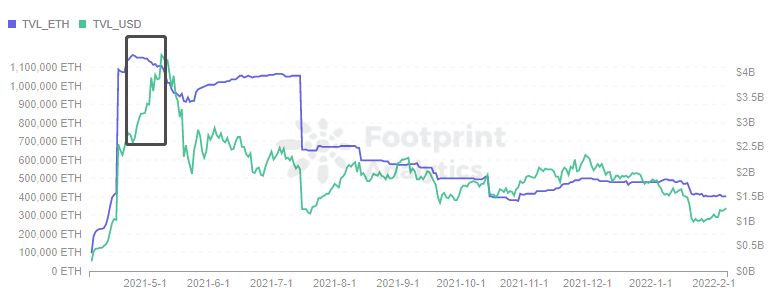

Footprint Analytics – TVL in ETH vs USD
Complex projects like Aave and Yearn, which offer both lock and lend functions, complicate the use of TVL as a metric and necessitate combining it with others.
- Net Liquidity
Net liquidity refers to the change of inflow and outflow from the previous day or month. The changes can be further analyzed in terms of both inflow and outflow, and whether the main source is user entry or loss.
- Revenue
DEX-based protocols cannot be measured by TVL alone since swaps also generate revenue. The ultimate goal of these types of projects is to maximize profitability and revenue reflects their operating results.
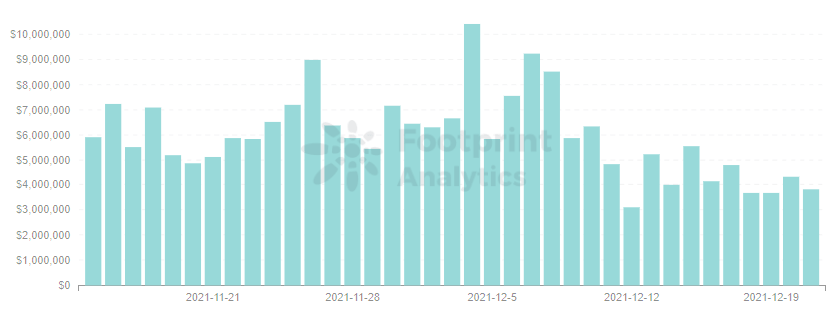

Footprint Analytics – Revenue
Token Data
Most platforms issue governance tokens and some use a two-token model. Token data is somewhat reflective of the market’s acceptance of the platform.
- Basic Information
The price is the most intuitive metric, and the rise and fall is closely related to the supply and demand in the market. The price is also the fastest metric to be affected when a significant event occurs. For example, Cream faced its second major attack on Oct. 27, losing 130 million. This caused the price of CREAM to fall off a cliff.
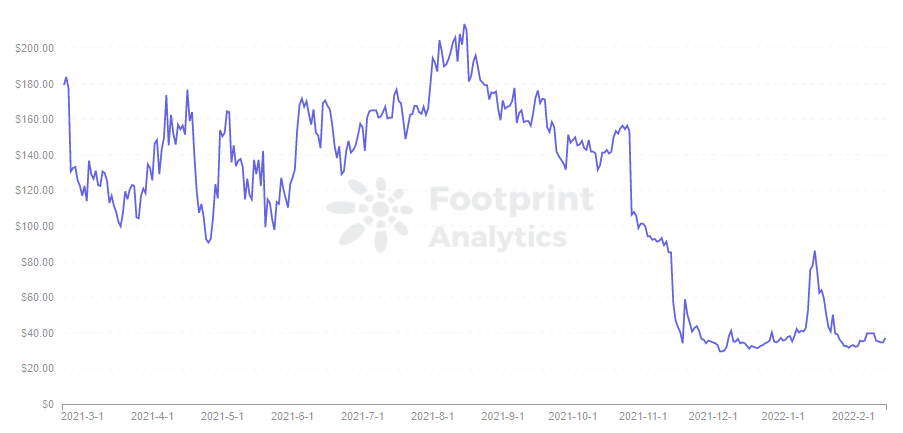

Footprint Analytics – Token Price – CREAM
For those issuing dual tokens such as MakerDAO and Liquity, monitoring the number of DAIs and LUSDs minted can also reflect the degree of user participation.
The market cap of a token is the multiplication of the price and the circulating supply, reflecting the market value of a project in the DeFi industry.
- Number of Token Holders & Holding Time
The number of token holders reflects how many users approve of the platform’s token model. Especially important is the number of tokens staked to obtain governance rights, which reflects the platform’s DAO situation.
Holding time shows whether the project attracts more users who believe in the project’s long-term value versus speculators.
- Utility
Trading volume reflects the activity of a token in the market, and its ratio to market cap is similar to the turnover rate. Higher circulation reflects a token with a higher level of attention, while lower circulation is a token with less attention.
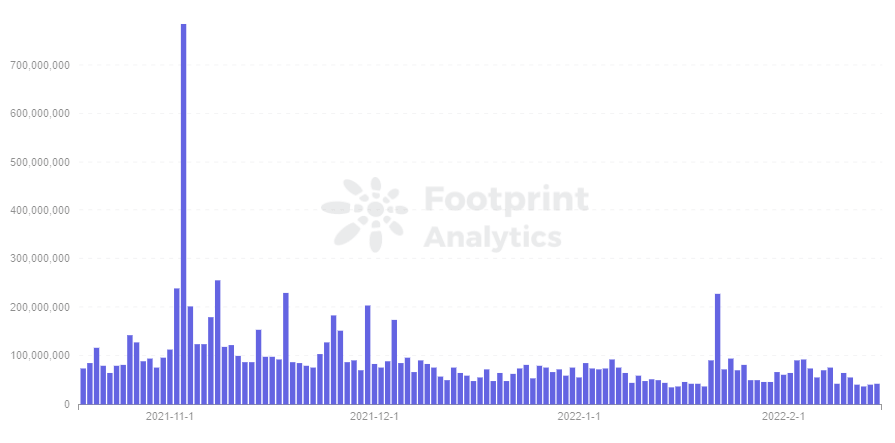

Footprint Analytics – MKR Volume
The utility of the token is also worth noting, i.e. whether the token mined is staked on the platform to make use of the governance token, or deposited in other external protocols to capture revenue.
For example, 61% of Liquity’s stablecoin, LUSD, is deposited in its own platform’s Stability Pool. LUSD does not play its role as a stablecoin in circulation compared to DAI’s utility.
Advanced Metrics
- Pool Data
All DeFi project’s TVLs are made of pools, so finding the reasons behind metrics means examining the pool structure of a given project. For example: pool sizes, TVLs, and volume changes.
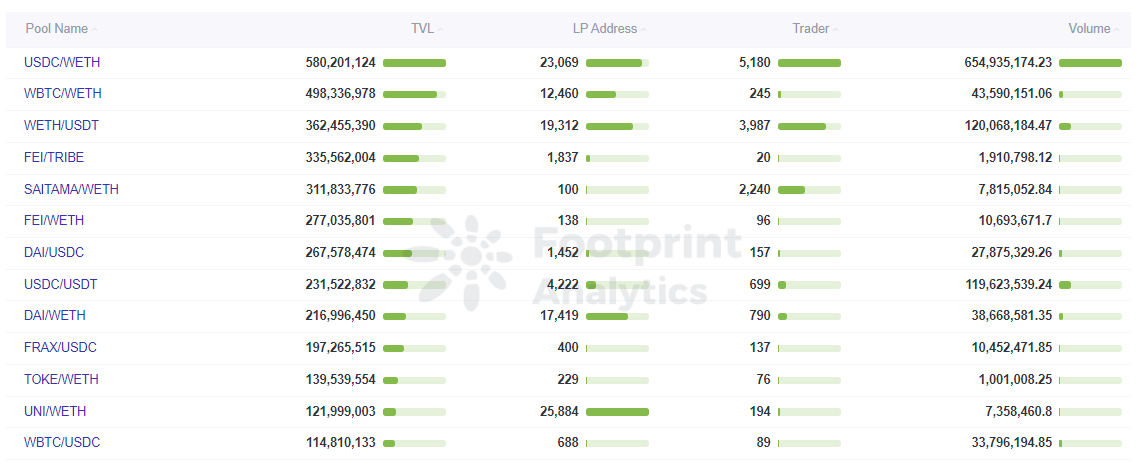

Footprint Analytics – Pools Overview
- User Metrics
The project always revolves around users, and accurate capture of target users is the core of project development. Data classification and layering analysis of users can target quality users more quickly.
- User Portrait
The overall users can be subdivided into new and active users. New users reflect market expansion, while active users reflect the project’s potential for continuing growth.
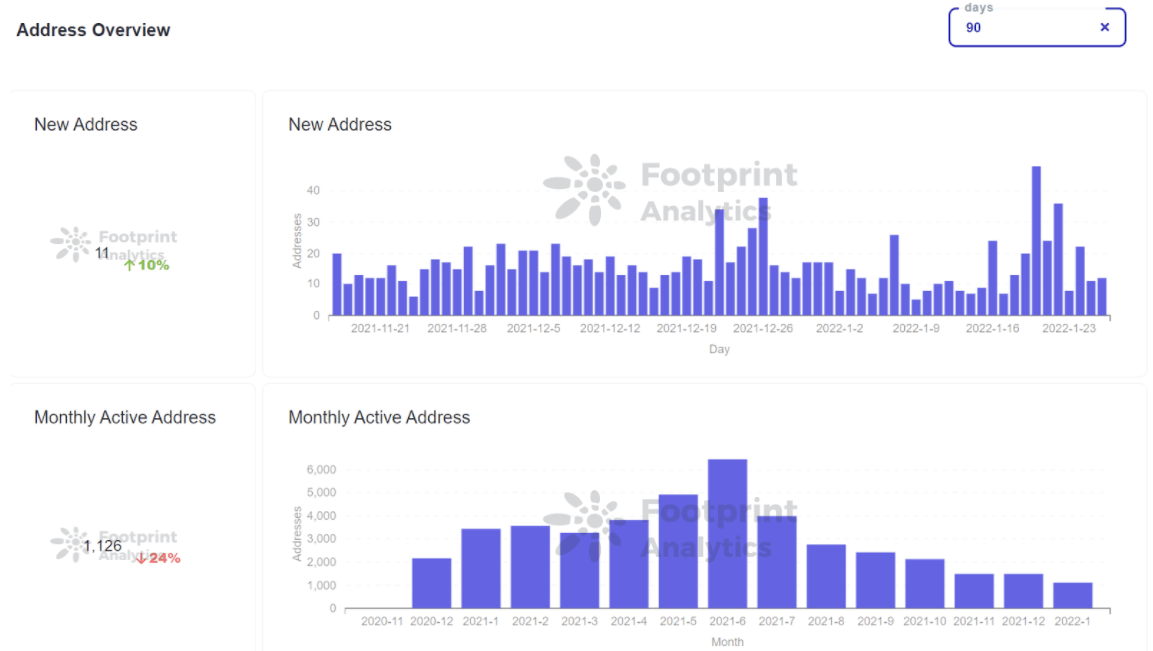

Footprint Analytics – Address Overview
The analysis of the change in transaction amount, holding amount, and duration per user enables us to understand the average user quality.
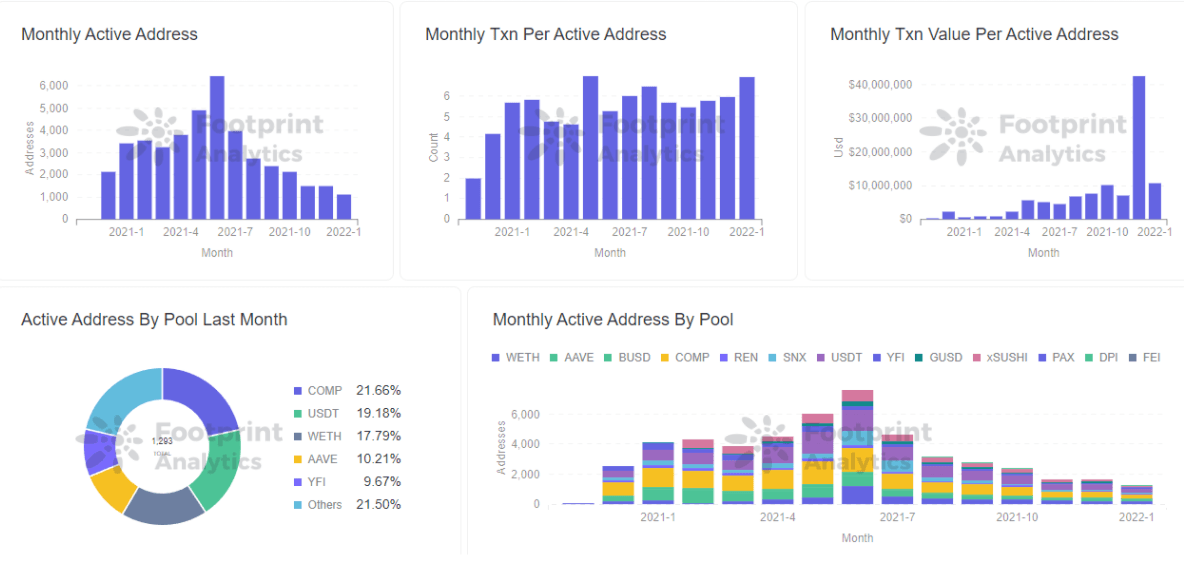

Footprint Analytics – Active Address
While averages can provide an observation of general trends in user behavior, it is still lacking as a foundation for project implementation. Averages often dilute important data, and a deeper user layering is required to find the real problems and develop the right action plan.
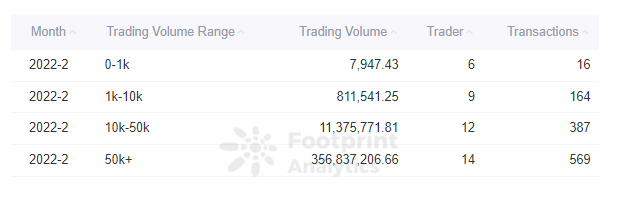

Footprint Analytics – Trading Volume Distribution
- User Churn
Whales generate the most value for the platform and developers need to prevent these users from churning. By sorting users, it is possible to create user portraits and focus on big accounts.
Insight into the investment preferences of users can provide a deeper understanding of users, and uncover potential user groups by analyzing all DeFi platforms in which the target users have invested.
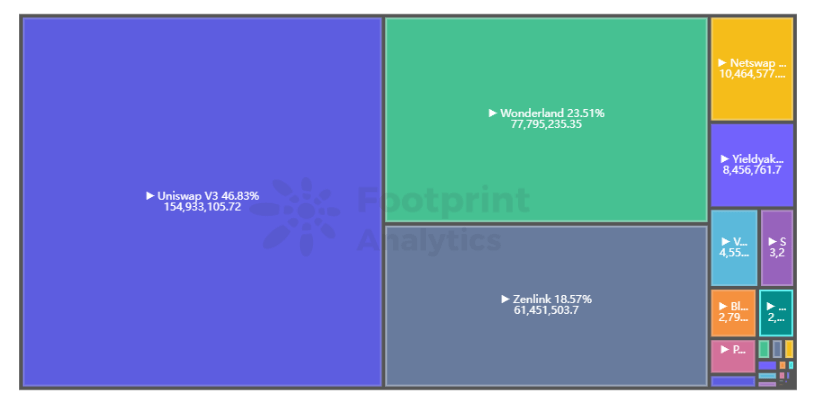

Footprint Analytics – Address Investment Protocols Distribution
Cross Analysis
Cross analysis refers to the comparative analysis of multiple metrics together. Analysts and developers can use it to find correlations between metrics and create business hypotheses.
For example, if we compare APY with the number of users or with TVL, we can analyze the results to see if the increase in APY is attracting more users.
In another example, an analyst can compare the price of a project with the price of BTC to determine whether price movements are caused by changes in the project’s intrinsic value or larger market forces.
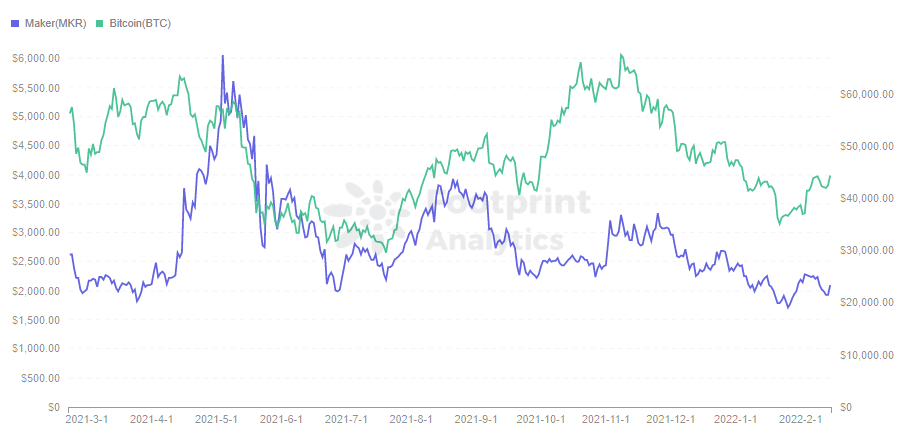

Footprint Analytics – Token Price (MKR vs BTC)
The Lego attributes of DeFi should not be overlooked either, with the metrics of closely related projects often being an important factor in the movement. For example, Convex helped spur the growth of Curve’s TVL.
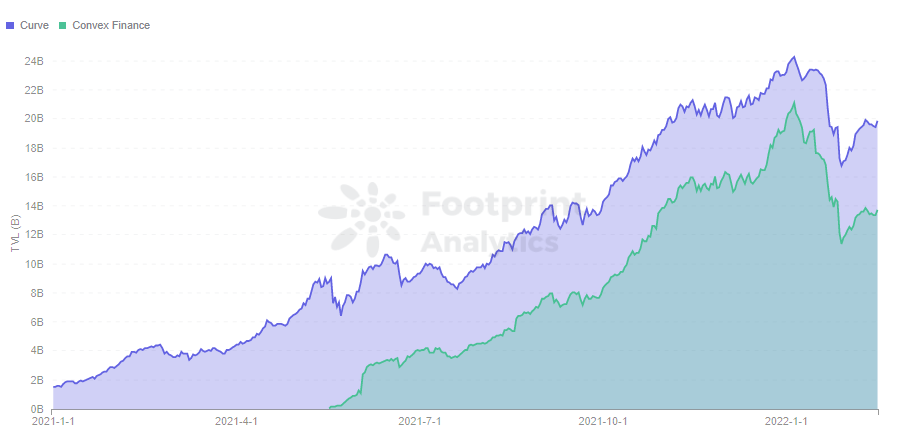

Footprint Analytics – Curve VS Convex in TVL
Summary
There are many analysis tools on the market, but they usually stop at surface-level metrics.
For stakeholders to make data-driven decisions, it is crucial to dig deeper and apply advanced analytics to blockchain data.
Date and Author: 09 February 2022, Simon
Data Source: Footprint Analytics
What is Footprint Analytics?
Footprint Analytics is an all-in-one analysis platform to visualize blockchain data and discover insights. It cleans and integrates on-chain data so users of any experience level can quickly start researching tokens, projects, and protocols. With over a thousand dashboard templates plus a drag-and-drop interface, anyone can build their own customized charts in minutes. Uncover blockchain data and invest smarter with Footprint.