Bitcoin’s On-Chain Landscape Looks Far Different From Its 2021 Bull Market Peak

bitcoinist发布于2026-06-02更新于2026-06-02

文章摘要

Bitcoin's on-chain activity has significantly declined compared to its 2021 bull market peak, with current daily active addresses and new wallet creations down roughly 44% and 43% respectively. Data indicates the network is attracting fewer new participants and generating less transactional activity. Key drivers for this shift include the rise of Spot ETFs and institutional investment vehicles, which allow Bitcoin exposure without direct on-chain interaction, and a trend of long-term holders becoming more passive. Despite lower on-chain metrics, Bitcoin's price remains elevated, and the decline is not necessarily bearish, as volatility typically drives network activity. Current price action shows a recent increase alongside a significant surge in trading volume.

Given the prolonged waning price action, the Bitcoin network is starting to feel this bearish pressure, leading to a sharp decline in activity across the network. After a period of downward performance, the level of activity and participation within the network has significantly dropped below levels seen in previous bull market cycles.

How Bitcoin’s Network Usage Has Evolved Since 2021

While the Bitcoin price has been experiencing persistent downside action, its network performance is also exhibiting a notable decline. Currently, the network is telling a very different story from the one seen in past bull market cycles, especially the peak of the 2021 bull market.

Over the past few years, Bitcoin’s on-chain activity has experienced a substantial metamorphosis, ranging from changing transaction patterns to evolving investor behavior. According to data shared by Santiment, a popular market intelligence and on-chain data analytics platform, the BTC network was averaging roughly 1.12 million active addresses per day and nearly 489,000 new wallet addresses being created daily in May 2021.

However, as of Today, those figures have now dropped to approximately 624,000 active wallet addresses and 278,000 new wallet addresses generated per day, which represents declines of about 44% and 43%, respectively.
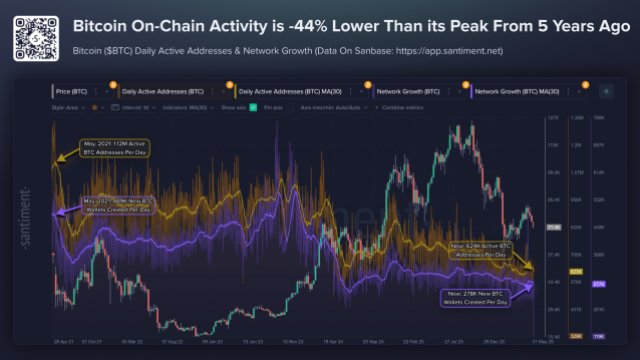
Source: Chart from Santiment on X

Santiment highlighted that active addresses are often used as a proxy for the number of unique participants transacting on the network. Meanwhile, the network growth calculates the creation of new wallet addresses that interact with BTC for the first time.

Together, these metrics suggest that Bitcoin is attracting fewer new participants and generating less day-to-day transactional activity than it did during the height of retail enthusiasm about 5 years ago. Despite the Bitcoin price remaining well above its 2021 levels for much of the current cycle, on-chain participation has not been quiet.

Key Drivers Are Spot ETFs And Institutional Investment Vehicles

These shifts imply that a new set of factors is driving the market, which could influence how analysts assess demand, network health, and upcoming price movements. One of the major reasons behind this may be the growing influence of the Spot Exchange-Traded Funds (ETFs) and institutional investment vehicles.

These allow investors to gain more exposure to BTC without directly moving coins on-chain or creating new wallets. At the same time, Santiment highlighted that many long-term holders have become increasingly passive, choosing to store their assets rather than transact frequently. As a result, the network is still very valuable but less active than it was in 2021 during the retail-driven craze.

Historically, this is not necessarily a bearish indicator as many may assume at first sight. Most times, volatility in either direction is what triggers BTC’s network activity to rise. Furthermore, this decline in activity is likely due to sideways movement and growing crowd interest in equities and precious metals as of late.

At the time of writing, the price of BTC was trading at $69,876, demonstrating a nearly 5% increase in the last 24 hours. Despite this decline, traders are showing increased interest in the asset, as evidenced by a more than 134% rise in trading volume over the past day.

BTC trading at $70,000 on the 1D chart | Source: BTCUSDT on Tradingview.com

热门币种推荐

相关问答

QAccording to Santiment data, how have Bitcoin's daily active addresses and new wallet creations changed from May 2021 to the present?

AAccording to Santiment data, Bitcoin's daily active addresses have dropped from about 1.12 million in May 2021 to approximately 624,000 today, a decline of about 44%. The daily creation of new wallet addresses has fallen from nearly 489,000 to about 278,000, a decline of about 43%.

QWhat does the decline in active addresses and network growth metrics suggest about the current state of the Bitcoin network compared to 2021?

AThe decline suggests that Bitcoin is attracting fewer new participants and generating less daily transactional activity than it did during the peak of retail enthusiasm in 2021. This indicates a quieter on-chain participation despite the Bitcoin price being well above its 2021 levels.

QWhat does the article propose as key drivers for the shift in Bitcoin's on-chain activity patterns?

AThe article identifies the growing influence of Spot Exchange-Traded Funds (ETFs) and institutional investment vehicles as key drivers. These allow exposure to Bitcoin without direct on-chain movements. Additionally, long-term holders are becoming more passive, storing assets rather than transacting frequently.

QDoes the article consider the current decline in network activity to be a definitive bearish indicator for Bitcoin? Why or why not?

ANo, the article states that historically, this decline in network activity is not necessarily a bearish indicator. It explains that volatility, in either direction, typically triggers a rise in Bitcoin's network activity, and the current low activity is likely due to sideways price movement and shifting crowd interest to other assets like equities and precious metals.

QWhat was the price and recent trading volume trend for Bitcoin mentioned at the end of the article?

AAt the time of writing, the price of Bitcoin was trading at $69,876, showing a nearly 5% increase in the last 24 hours. Despite the overall decline in on-chain activity, trading volume rose by more than 134% over the past day, indicating increased trader interest.

你可能也喜欢

存储的繁荣,能够持续多久?

半导体存储器市场正经历历史性的爆炸式增长。根据WSTS数据,存储器出货量在短短十年内增长超11倍,2026年5月单月达633亿美元,同比增速高达285%,远超以往任何“泡沫”时期。增长的核心驱动力并非出货量,而是DRAM和NAND闪存价格的异常飙升,自2025年初以来两者现货价格均上涨约10倍。 价格暴涨的根本原因在于人工智能数据中心带来的需求激增。以亚马逊、谷歌、微软和Meta为代表的超大规模数据中心运营商,为构建AI基础设施进行了巨额资本投资,预计2026年将达7550亿美元。这些数据中心像“黑洞”一样吸走了大量用于AI的高性能存储(如HBM),导致供应产能向AI领域倾斜,进而造成用于个人电脑、智能手机等消费电子产品的传统DRAM和NAND闪存严重短缺,价格被大幅推高。 这种扭曲的增长结构使得全球半导体市场规模预测被彻底颠覆。此前预测到2032年达1.2万亿美元的目标,可能在2026年就被超越。市场增长高度集中于存储器和逻辑电路(含GPU),而模拟和微控制器市场则增长平缓。 然而,作者根据存储器市场近35年的历史周期规律发出警告:该市场从未出现过连续六年以上的正增长,繁荣期通常不超过五年。此次以2024年为顶点的AI热潮,按历史规律预计最迟将在2028年、甚至2027年结束。更关键的是,“高峰越高,低谷越深”是半导体行业的铁律。当前285%的增速是前所未有的峰值,随之而来的衰退很可能比以往任何一次都更加严重和漫长。 尽管当前存储制造商因利润暴增而股价飙升,甚至创造了许多“亿万富翁”,但作者强烈呼吁行业应保持冷静,利用当前的繁荣期为必将到来的严峻衰退做好切实准备。

链捕手3小时前

存储的繁荣,能够持续多久?

链捕手3小时前

交易

现货

热门文章

如何购买S

欢迎来到HTX.com!我们已经让购买Sonic(S)变得简单而便捷。跟随我们的逐步指南,放心开始您的加密货币之旅。第一步:创建您的HTX账户使用您的电子邮件、手机号码注册一个免费账户在HTX上。体验无忧的注册过程并解锁所有平台功能。立即注册第二步:前往买币页面,选择您的支付方式信用卡/借记卡购买:使用您的Visa或Mastercard即时购买Sonic(S)。余额购买:使用您HTX账户余额中的资金进行无缝交易。第三方购买:探索诸如Google Pay或Apple Pay等流行支付方法以增加便利性。C2C购买:在HTX平台上直接与其他用户交易。HTX场外交易台(OTC)购买:为大量交易者提供个性化服务和竞争性汇率。第三步:存储您的Sonic(S)购买完您的Sonic(S)后,将其存储在您的HTX账户钱包中。您也可以通过区块链转账将其发送到其他地方或者用于交易其他加密货币。第四步:交易Sonic(S)在HTX的现货市场轻松交易Sonic(S)。访问您的账户,选择您的交易对,执行您的交易,并实时监控。HTX为初学者和经验丰富的交易者提供了友好的用户体验。

2.9k人学过发布于 2025.01.15更新于 2026.06.02

如何购买S

相关讨论

欢迎来到HTX社区。在这里,您可以了解最新的平台发展动态并获得专业的市场意见。以下是用户对S(S)币价的意见。

活动图片