9 Red Candles Before The Bottom: Why Bitcoin Price Will Continue To Crash

bitcoinist发布于2026-05-14更新于2026-05-14

文章摘要

A crypto analyst warns that Bitcoin may still face significant downside despite holding above $80,000. The warning is based on a historical pattern where Bitcoin's major bear market bottoms in recent cycles have only formed after nine consecutive red monthly candles. This pattern was observed in both the 2018 and 2022 cycles. While Bitcoin's monthly chart has recently shown green candles in March and April 2026, breaking the sequence of red candles after the October 2025 all-time high, the analyst cautions that this bounce may not yet signal a new bull phase. Other technical outlooks suggest Bitcoin bear markets typically take about a year to fully unfold. Consequently, the current correction could extend further, possibly into Q4 2026, before a durable long-term bottom is established.

Bitcoin’s hold above $80,000 has increased the possibility of the worst of the current correction being over. However, one crypto analyst is warning that the monthly chart may still be telling a different story, with Bitcoin’s past bear-market structures pointing to more downside before a price bottom.

The analysis, shared on X, is based on a simple pattern: Bitcoin has not formed its major bear-market bottom in recent cycles until it printed nine red monthly candles.

The Bottom Call May Be Too Early

The analysis, which was posted on X by a crypto market commentator, looks at a monthly candlestick pattern visible on Bitcoin’s long-term price chart. The observation is that Bitcoin has never established a bear market bottom before printing nine consecutive red monthly candles.

The first trend of nine consecutive red monthly candles can be seen in the 2018 cycle. Starting from the January 2018 peak that followed Bitcoin’s first major mainstream rally, the cryptocurrency printed nine consecutive red monthly candles before finding its bottom around $3,200 in December of that year.

The 2022 cycle repeated the sequence with near-identical precision. From the November 2021 all-time high, Bitcoin closed nine straight red monthly candles before bottoming around $15,500 in November 2022, a decline of about 77%.
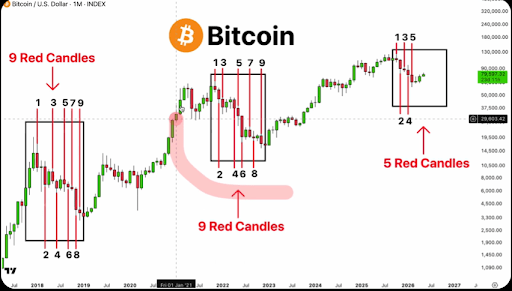
Source: Chart from Degargoyle on X

Bitcoin reached its current all-time high of $126,080 on October 6, 2025, before the monthly candle that followed closed in the red. That bearish sequence continued through February, giving the analyst’s red-candle theory some weight. However, the structure has since started to change, with Bitcoin closing March and April in the green. May is also on track to produce another green monthly candle, although it is still too early to tell.

What Does This Mean For Bitcoin?

This outlook does not mean Bitcoin must copy its past cycle candle-for-candle. However, the pattern is being used as a warning against assuming very early that the current bounce above $80,000 is the start of a new bull phase. Bitcoin still needs to register weekly closes above some levels before the price action can be called the start of a new bull phase. It’s just a theory. But it’s happened twice in a row.

That view also aligns with the broader market mood. Bitcoin has recently climbed back above $80,000, but the recovery has not been strong enough to erase caution from the market. It also matches other technical outlooks from crypto analysts who argue that Bitcoin bear markets usually take about a year to fully play out before a durable bottom is formed.

Based on that reading, the current corrective price action may still extend further, possibly stretching into Q4 2026 before Bitcoin finds a stronger long-term floor.

BTC trading at $80,952 on the 1D chart | Source: BTCUSDT on Tradingview.com

热门币种推荐

相关问答

QWhat simple monthly candlestick pattern does the analyst identify as a sign of a major bear-market bottom in Bitcoin's recent cycles?

AThe analyst identifies a pattern where Bitcoin has not formed its major bear-market bottom in recent cycles until it has printed nine consecutive red monthly candles.

QAccording to the article, why might the current bounce above $80,000 not necessarily signal the start of a new bull phase?

AThe analyst warns against assuming the bounce is a new bull phase too early, pointing to the historical pattern of nine red candles and noting that Bitcoin still needs to register weekly closes above key resistance levels.

QIn the 2022 bear market cycle, how many consecutive red monthly candles did Bitcoin close before bottoming?

AIn the 2022 cycle, Bitcoin closed nine straight red monthly candles from the November 2021 all-time high before bottoming around $15,500 in November 2022.

QWhat is the broader timeframe suggested by some analysts for Bitcoin bear markets to fully play out before a durable bottom is formed?

AOther crypto analysts argue that Bitcoin bear markets usually take about a year to fully play out before a durable bottom is formed.

QBased on the 'nine red candles' theory, how long might the current corrective price action potentially extend according to the article?

ABased on the theory and aligning market views, the current corrective price action may still extend further, possibly stretching into Q4 2026 before Bitcoin finds a stronger long-term floor.

你可能也喜欢

交易

现货

热门文章

如何购买S

欢迎来到HTX.com!我们已经让购买Sonic(S)变得简单而便捷。跟随我们的逐步指南,放心开始您的加密货币之旅。第一步:创建您的HTX账户使用您的电子邮件、手机号码注册一个免费账户在HTX上。体验无忧的注册过程并解锁所有平台功能。立即注册第二步:前往买币页面,选择您的支付方式信用卡/借记卡购买:使用您的Visa或Mastercard即时购买Sonic(S)。余额购买:使用您HTX账户余额中的资金进行无缝交易。第三方购买:探索诸如Google Pay或Apple Pay等流行支付方法以增加便利性。C2C购买:在HTX平台上直接与其他用户交易。HTX场外交易台(OTC)购买:为大量交易者提供个性化服务和竞争性汇率。第三步:存储您的Sonic(S)购买完您的Sonic(S)后,将其存储在您的HTX账户钱包中。您也可以通过区块链转账将其发送到其他地方或者用于交易其他加密货币。第四步:交易Sonic(S)在HTX的现货市场轻松交易Sonic(S)。访问您的账户,选择您的交易对,执行您的交易,并实时监控。HTX为初学者和经验丰富的交易者提供了友好的用户体验。

3.6k人学过发布于 2025.01.15更新于 2026.08.06

如何购买S

相关讨论

欢迎来到HTX社区。在这里,您可以了解最新的平台发展动态并获得专业的市场意见。以下是用户对S(S)币价的意见。

活动图片