Bitcoin Cash: Here’s why BCH traders should watch THIS buy signal

ambcrypto发布于2026-03-20更新于2026-03-20

文章摘要

Bitcoin Cash (BCH) is holding a key long-term demand zone at $440, with similarities to a previous local bottom that led to a rally. While the 1-day chart shows a bearish structure and low trading volume remains a concern, a short-term bullish opportunity has emerged. The 4-hour chart flipped bullish on March 16, with a rebound from $449 and positive indicators like the DMI signaling an uptrend. A break above $440 would invalidate the bullish outlook, but if momentum continues, targets lie at $494, $510, and possibly $570—especially if Bitcoin remains strong above $70k.

Bitcoin Cash [BCH] continued to hold on to a long-term demand zone at the $440 level. Previously, AMBCrypto had reported that the on-chain metrics gave mixed signals. There were similarities to the October 2025 local bottom that resulted in a BCH rally to $660 by January 2026.

Overall, the strength of Bitcoin [BTC] could have a big say on how Bitcoin Cash reacted at the $440 critical demand zone. So far, the reaction has been positive, as BTC defended the $70k level recently and bulls looked to push prices higher once more.

A deeper dive into the short-term price action showed that Bitcoin Cash presented a buying opportunity for swing traders. Here’s how traders can plan their next move.

Decoding Bitcoin Cash’s long-term range
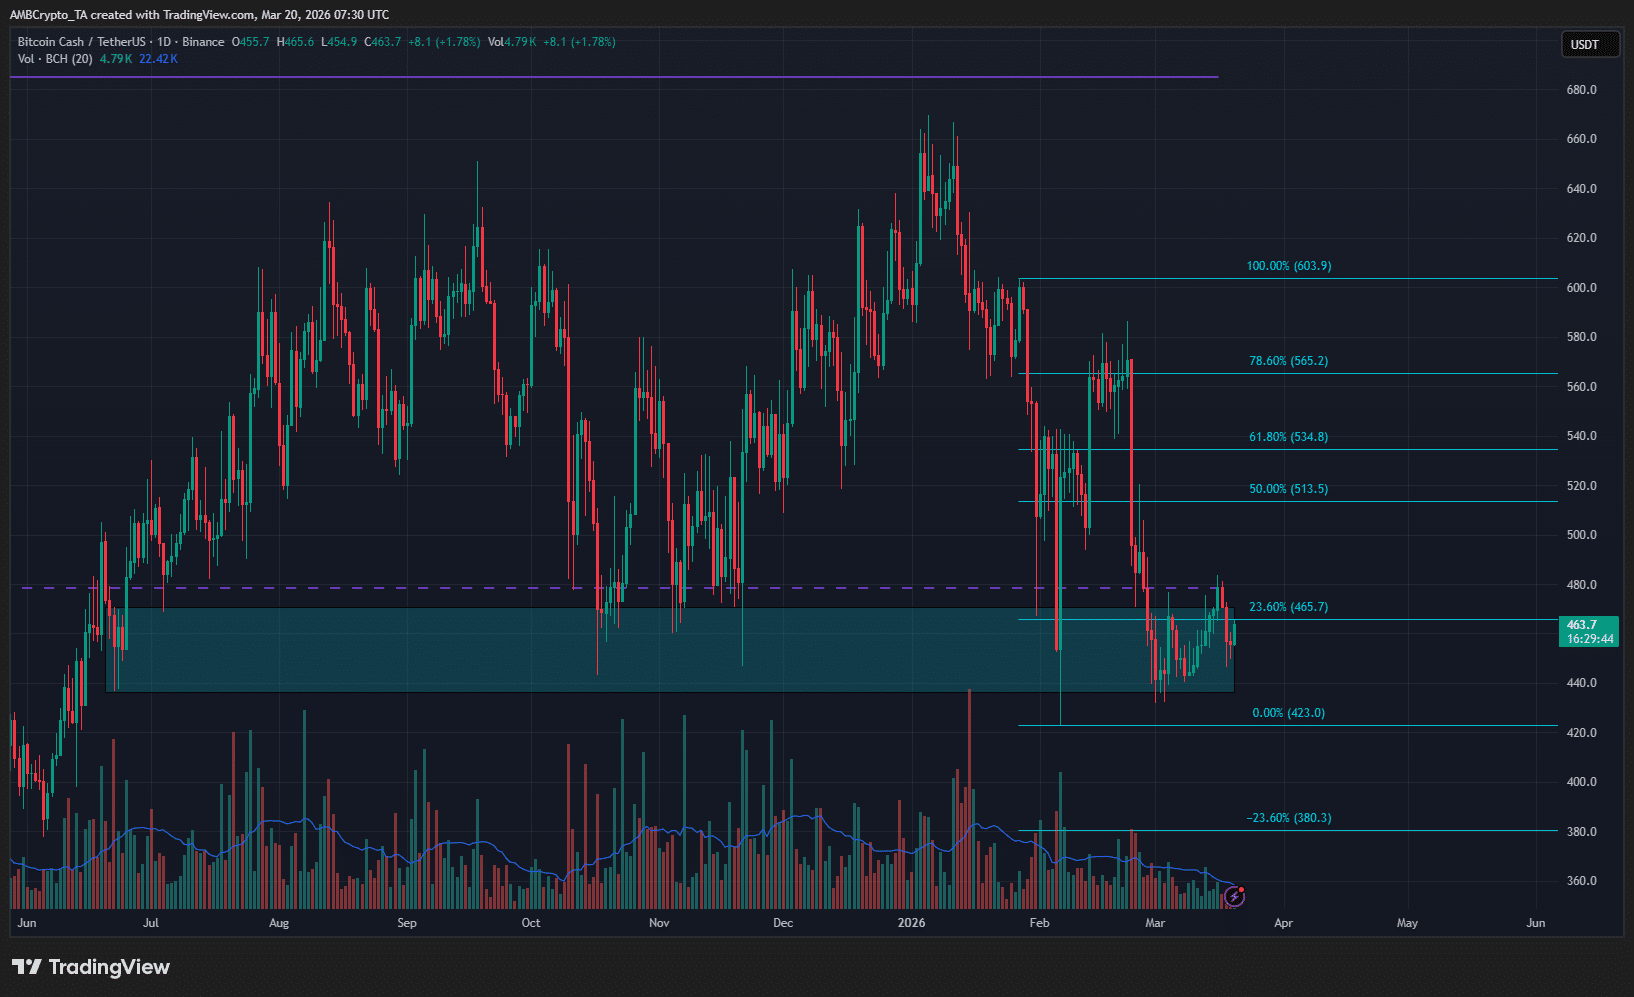
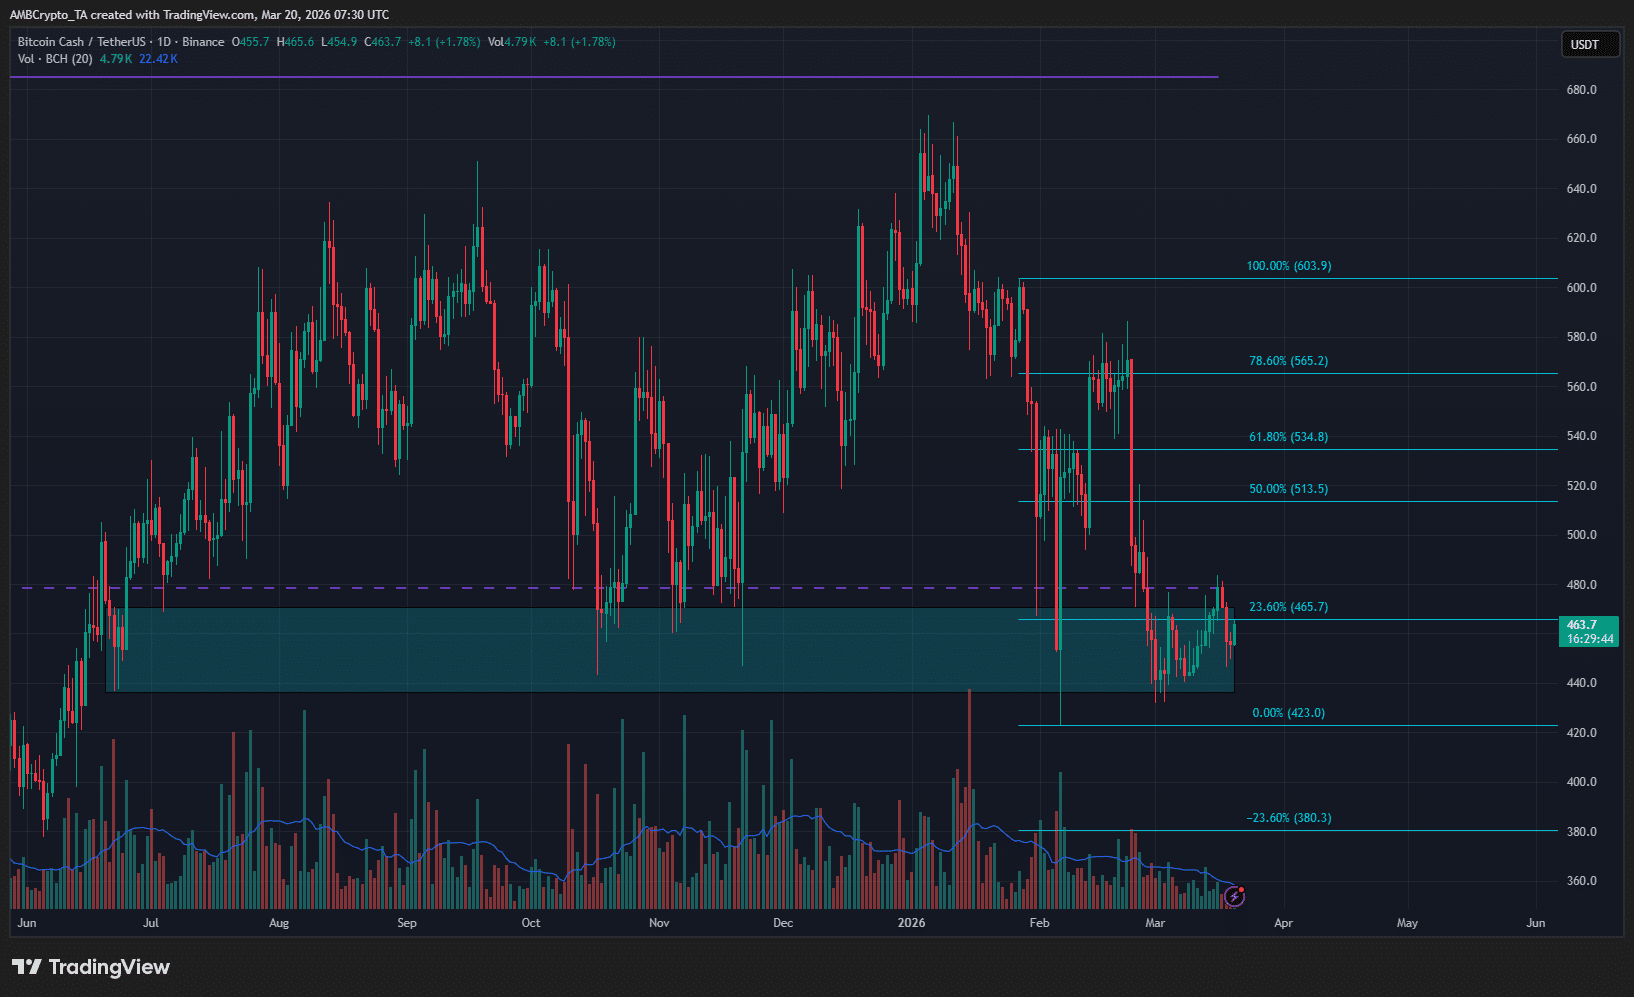
Source: BCH/USDT on TradingView

The long-term range extended from $272-$684, and its mid-range level was at $478. At the time of writing, Bitcoin Cash had a bearish structure on the 1-day chart.

Its trading volume had been dwindling over the past six weeks during the downtrend. Despite the recent bounce, the volume was still unable to climb back above the 20-day average.

Investors would see this as a warning sign. The buying volume and aggressive demand need to strengthen before a recovery toward the range highs is made possible.

Moreover, the current Bitcoin rally was likely only a retracement within a broader bear market. This could hurt the BCH bulls who are expecting a multi-month rally.

Does BCH present a buying opportunity?
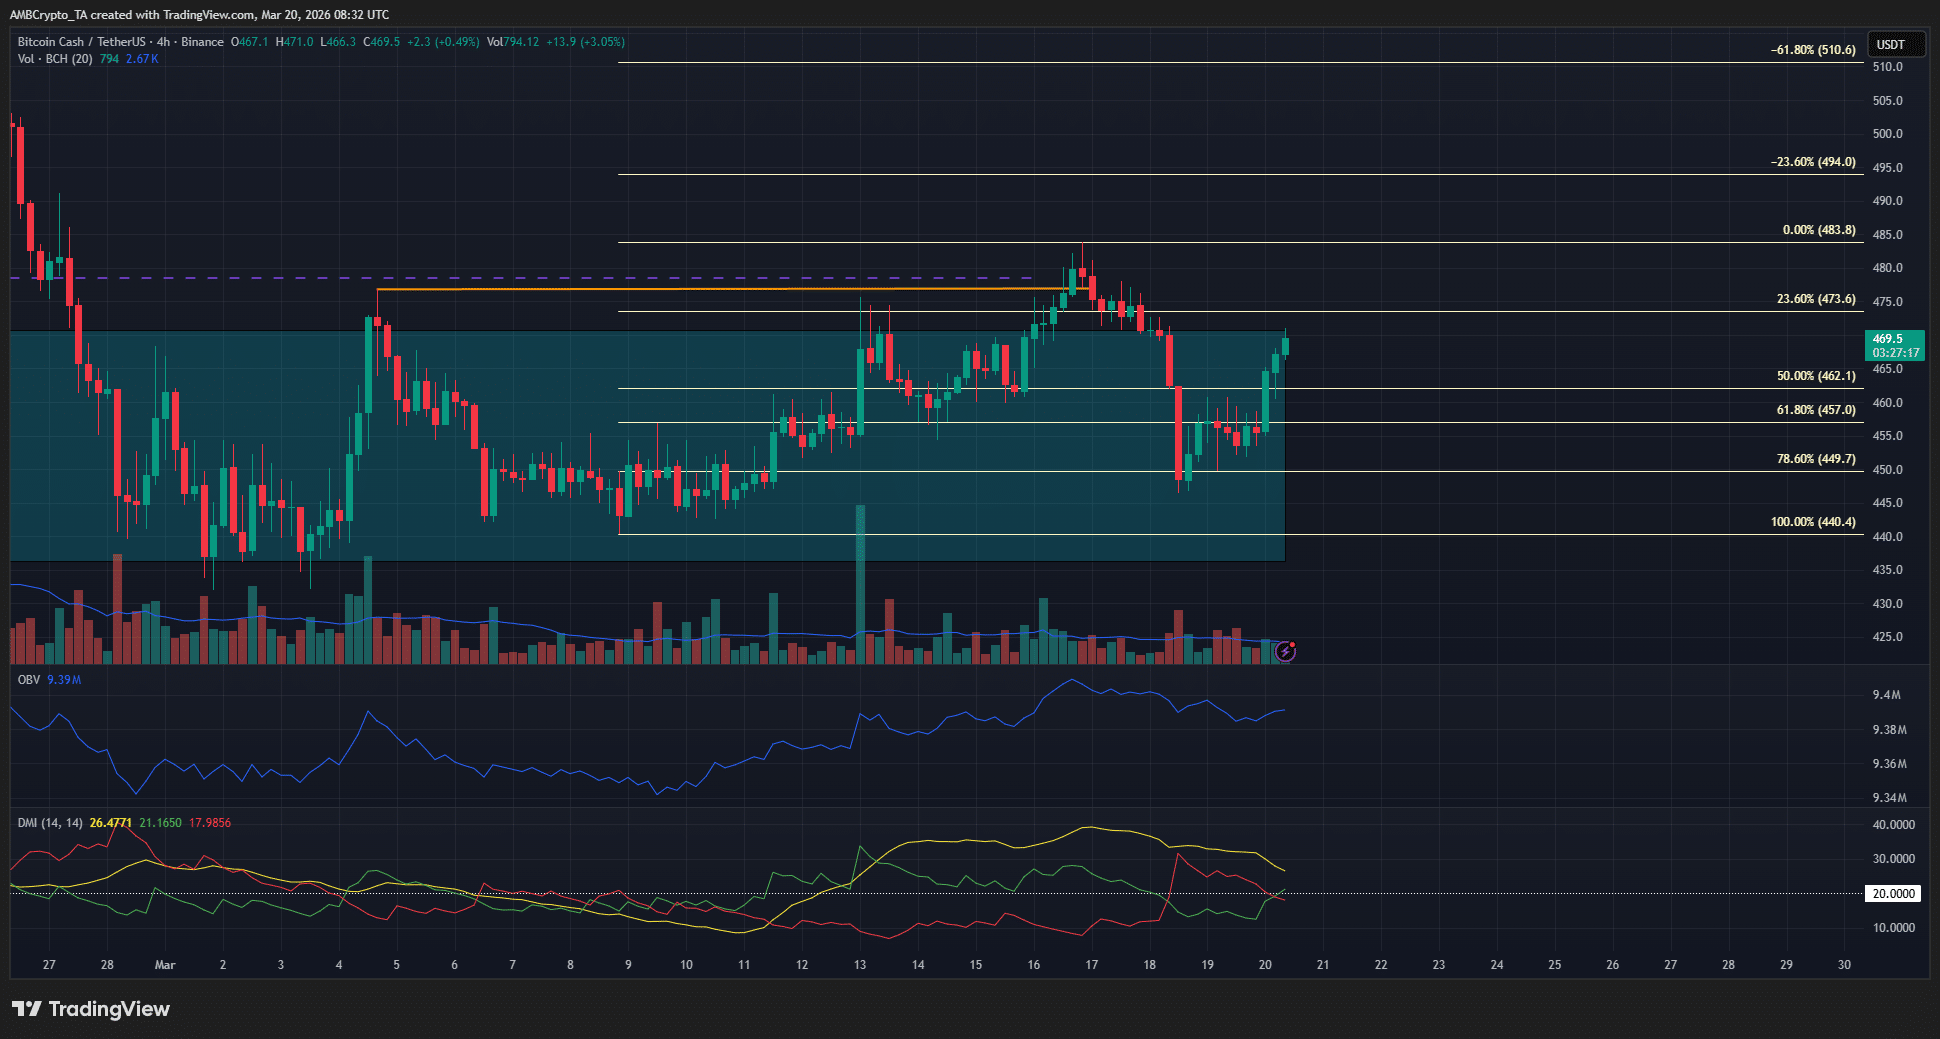
Source: BCH/USDT on TradingView

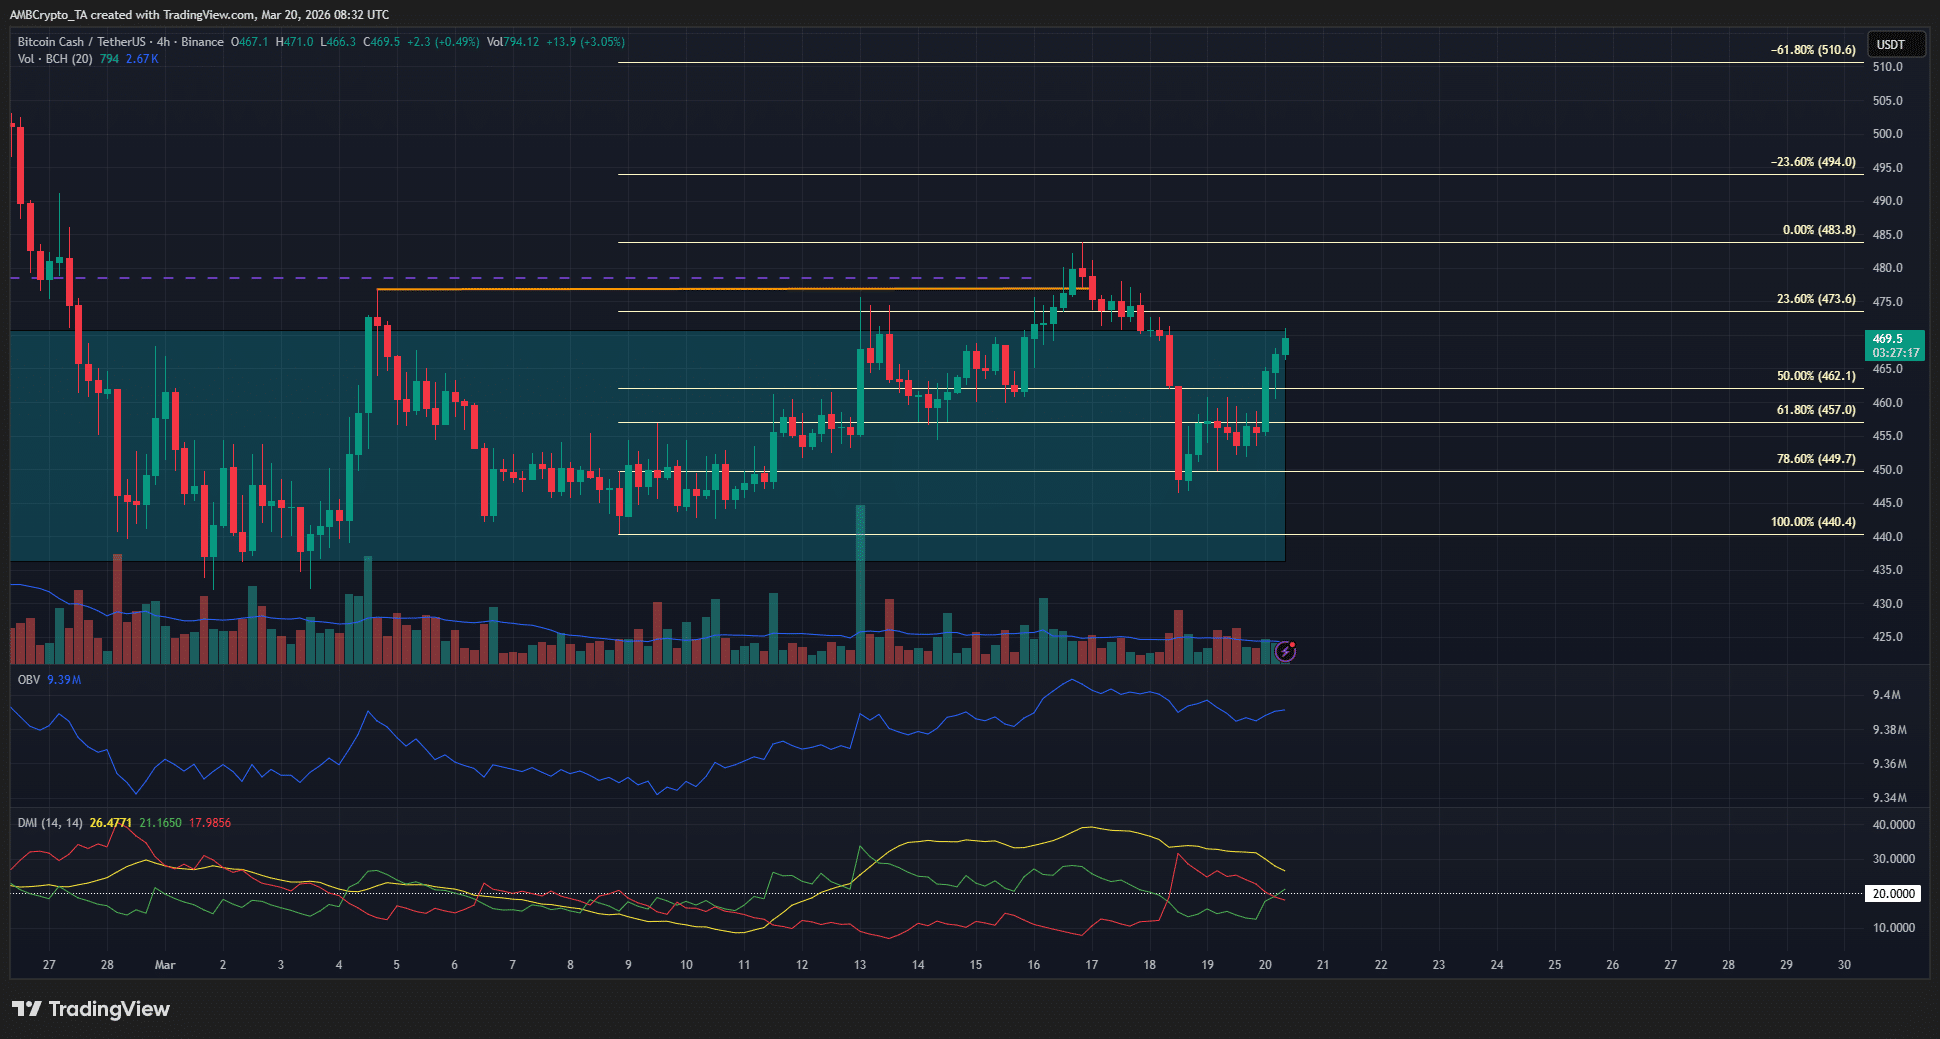
Despite the challenges on the higher time horizons, there was likely a buying opportunity for the altcoin now. The 4-hour structure saw a bullish flip (orange) on Monday, the 16th of March.

A subsequent retracement to $449 represented a test of a key Fibonacci support, and BCH has rebounded since then. The OBV has made higher lows over the past two weeks. The DMI has flipped to show a strong uptrend in progress on this timeframe.

A drop below the $440 level would invalidate this bullish idea. Meanwhile, the $494 and $510 levels are the next price targets. It is possible that the current move could go as high as $570, provided BTC can continue climbing higher.


Final Summary

  • Bitcoin Cash bulls have defended the $440 demand zone and forced a short-term rally to $470.
  • Though the trading volume was lower in comparison to periods earlier in 2026, there was a good chance BCH would rally toward $500 and higher.


热门币种推荐

相关问答

QWhat is the long-term demand zone that Bitcoin Cash (BCH) is holding, as mentioned in the article?

AThe long-term demand zone that Bitcoin Cash is holding is at the $440 level.

QAccording to the article, what is the mid-range level of Bitcoin Cash's long-term trading range?

AThe mid-range level of Bitcoin Cash's long-term trading range is $478.

QWhat signal on the 4-hour chart from March 16th suggested a potential buying opportunity for BCH?

AA bullish flip on the 4-hour chart on March 16th suggested a potential buying opportunity.

QWhat would invalidate the short-term bullish idea for Bitcoin Cash?

AA drop below the $440 level would invalidate the short-term bullish idea.

QWhat are the next two price targets mentioned for BCH if the bullish move continues?

AThe next two price targets mentioned are $494 and $510.

你可能也喜欢

富达Q3报告:BTC、ETH与SOL持续筑底,本轮加密熊市还要走多远?

富达数字资产发布了2026年第三季度加密市场信号报告。报告指出,当前加密市场整体仍处于熊市筑底阶段。 **市场总览:** * **加权NUPL(净未实现盈亏):** 已降至-0.01,表明市场整体略低于盈亏平衡线。仅比特币(BTC)仍录得未实现盈利,以太坊(ETH)和Solana(SOL)均处于亏损状态,BTC起到了市场稳定器的作用。 * **BTC主导率:** 升至68%,资金仍高度集中于BTC,尚未出现向其他数字资产的轮动迹象。 * **资产表现:** BTC、ETH、SOL过去一年及年初至今价格全线下跌,多项指标接近历史投降区间。现货ETP持续净流出,宏观环境及市场情绪构成拖累。 **比特币(BTC):** * **NUPL(0.09):** 处于“希望-恐惧”区间,情绪谨慎。 * **动能信号:** 负面,下跌形成偏空脉冲。 * **Yardstick(算力市盈率):** 正面,接近历史低位,显示BTC相对于网络能源投入可能被低估。参照历史底部周期(约300天),当前约203天的调整可能已走完三分之二,2026年10月是可观察的时间窗口。 * **相对黄金表现:** 负面,但近期跌势趋缓。 * **算力:** 负面,受价格低迷及AI算力资源竞争影响,算力从高点回落。 **以太坊(ETH):** * **NUPL(-0.43):** 处于“投降”区间,但历史显示较低NUPL往往对应较高长期回报。 * **动能信号:** 负面,上涨动能未恢复。 * **使用指标:** 中性,链上活动随价格下跌有所降温。 * **稳定币转账额:** 正面,持续创历史新高,显示真实使用需求增强。 * **网络费用:** 负面,受扩容影响持续下降。 **Solana(SOL):** * **NUPL(-0.72):** 处于“投降”区间,历史波动大。 * **动能信号:** 负面,但短期波动率已高于中期,需关注企稳可能。 * **使用指标:** 正面,链上交易活动在熊市中仍保持韧性并增长。 * **稳定币转账额:** 正面,长期上升趋势完好。 * **网络费用:** 中性,下降趋势可能接近底部。 **总结:** 报告认为,市场正处于寻找底部的修复过程中。BTC凭借其流动性优势相对抗跌,而ETH和SOL承受更大压力。虽然多项指标显示市场情绪低迷且接近历史投降区域,为长期投资者可能提供了有吸引力的入场位置,但全面复苏仍需等待更广泛的市场风险偏好恢复和基本面改善。

marsbit2小时前

富达Q3报告:BTC、ETH与SOL持续筑底,本轮加密熊市还要走多远?

marsbit2小时前

交易

现货

热门文章

加密市场宏观研报:《GENIUS Act》法案取得重大进展,BTC突破历史新高,后市全新展望

2025年5月22日,比特币价格正式突破11万美元大关,创下历史新高。在政策面、宏观经济、资金面与投资者结构共同作用下,一场结构性牛市浪潮正在展开。而此轮上涨背后的核心驱动,是美国《GENIUS稳定币法案》的实质性进展以及多项利好的叠加。本文将从政策端突破、宏观环境转向、链上与ETF资金结构、交易行为演化,以及重点受益赛道五大维度,全面解析此轮BTC再创新高的深层逻辑,并前瞻下半年市场的潜在趋势。

1.8k人学过发布于 2025.05.22更新于 2025.05.22

加密市场宏观研报:《GENIUS Act》法案取得重大进展,BTC突破历史新高,后市全新展望

相关讨论

欢迎来到HTX社区。在这里,您可以了解最新的平台发展动态并获得专业的市场意见。以下是用户对BTC(BTC)币价的意见。

活动图片