A new report has revealed that a total of $732 billion in capital has flowed into Bitcoin this cycle, more than all other cycles combined.
Bitcoin Has Seen Historic Growth In Realized Cap This Cycle
On-chain analytics firm Glassnode has released its Q4 2025 Digital Assets Report in collaboration with crypto investment firm Fasanara Digital, shedding light on how the market landscape has developed in the fourth quarter of 2025.
One of the things the report has talked about is the trend in the Realized Cap of Bitcoin. This capitalization model calculates the total value of the cryptocurrency by assuming the the value of each individual token is equal to the price at which it was last transacted on the blockchain.
The last transaction of any token is likely to represent the last time it changed hands, so the price at its time could be considered as its current cost basis. As such, the Realized Cap is a sum of the acquisition values of all coins in circulation. In other words, the model represents the total amount of capital that the investors used to purchase the asset’s supply. Considering this, changes in the indicator naturally correspond to the netflow of capital.
Below is a chart that shows how the Bitcoin Realized Cap has fluctuated over the last few years.
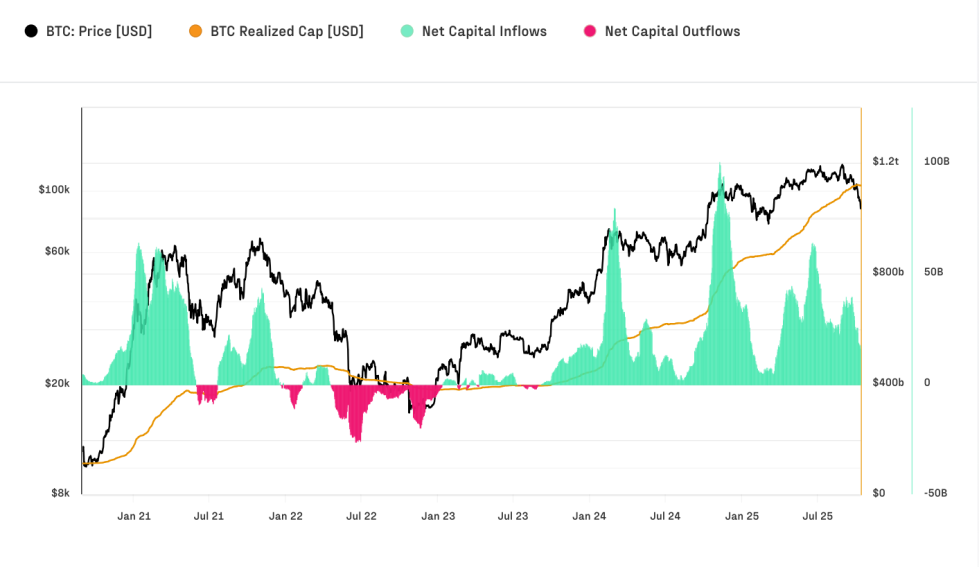
Looks like the value of the indicator has been exploring new highs since a while now | Source: Glassnode x Fasanara Digital Assets Report
As displayed in the graph, the monthly change in the Bitcoin Realized Cap has remained positive over the last couple of years, indicating that the network has been enjoying a sustained expansion in stored capital.
The rate of inflows has varied a lot over the cycle, however, accelerating to high levels during rallies and slowing down during flat or bearish periods. Most recently, the monthly increase in the metric hit a high of $39.8 billion in October, but the bearish momentum since then has meant a cooldown to $15 billion.
Following the continued rise in the Realized Cap, its value has reached a new all-time high (ATH) of $1.1 trillion. The report noted that this marks “a historic milestone that underscores Bitcoin’s continued evolution as a globally held, high-liquidity asset.”
The Realized Cap has clearly witnessed a significant amount of growth this cycle. But how does it stack up against the capital inflows of the past cycles? Here is another chart, this one comparing the cumulative Realized Cap change for each cycle:
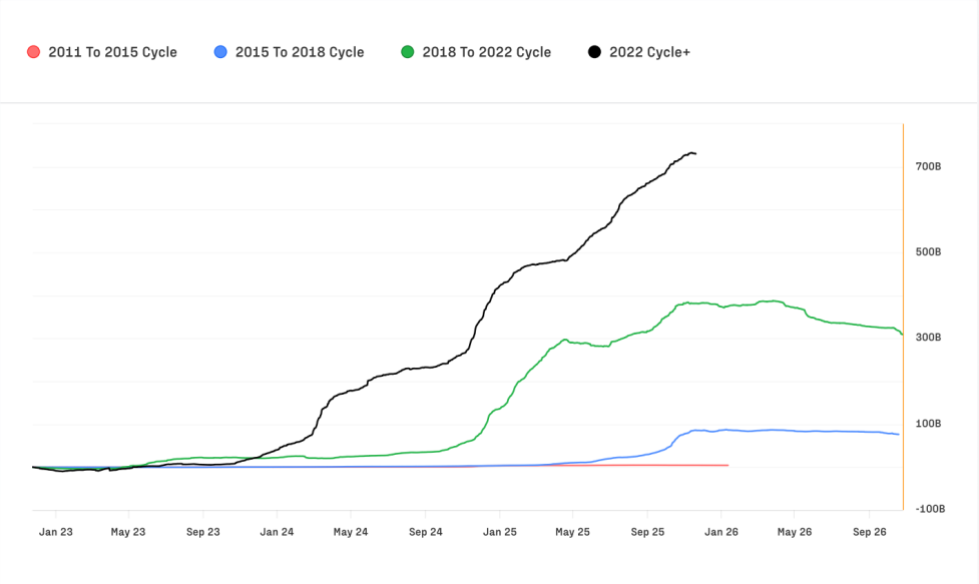
The current cycle seems to have significantly outpaced the others | Source: Glassnode x Fasanara Digital Assets Report
In total, the current cycle has attracted over $732 billion in capital. The last cycle saw $388 billion in inflows, and the two cycles before that about $90 billion combined. Thus, the latest cycle has not only outpaced each of the past cycles, but it has in fact seen a higher Realized Cap increase than all of them combined.
BTC Price
Bitcoin’s latest recovery has so far been holding as its price is trading around $92,800.
The trend in the price of the coin over the last five days | Source: BTCUSDT on TradingView

Related Posts