Executive Summary
- Bitcoin trades in a fragile $81K–$89K range after losing key cost-basis support, mirroring Q1 2022 weakness.
- Realized losses are elevated, with STH loss ratios collapsing to 0.07x, signaling fading liquidity and demand.
- Long-term holders still realize profit, but their momentum is weakening and could shift if liquidity deteriorates further.
- Futures markets show orderly deleveraging, neutral funding, and reduced leverage across BTC and altcoins.
- Options positioning remains defensive, with heavy puts near 84K and upside still being faded around 100K.
- Implied volatility stays elevated, and the December expiry is shaping up as a key volatility event.
- Overall sentiment is cautious, and recovery requires reclaiming major cost-basis models and renewed inflows.
On-chain Insights
Drifting Into Void
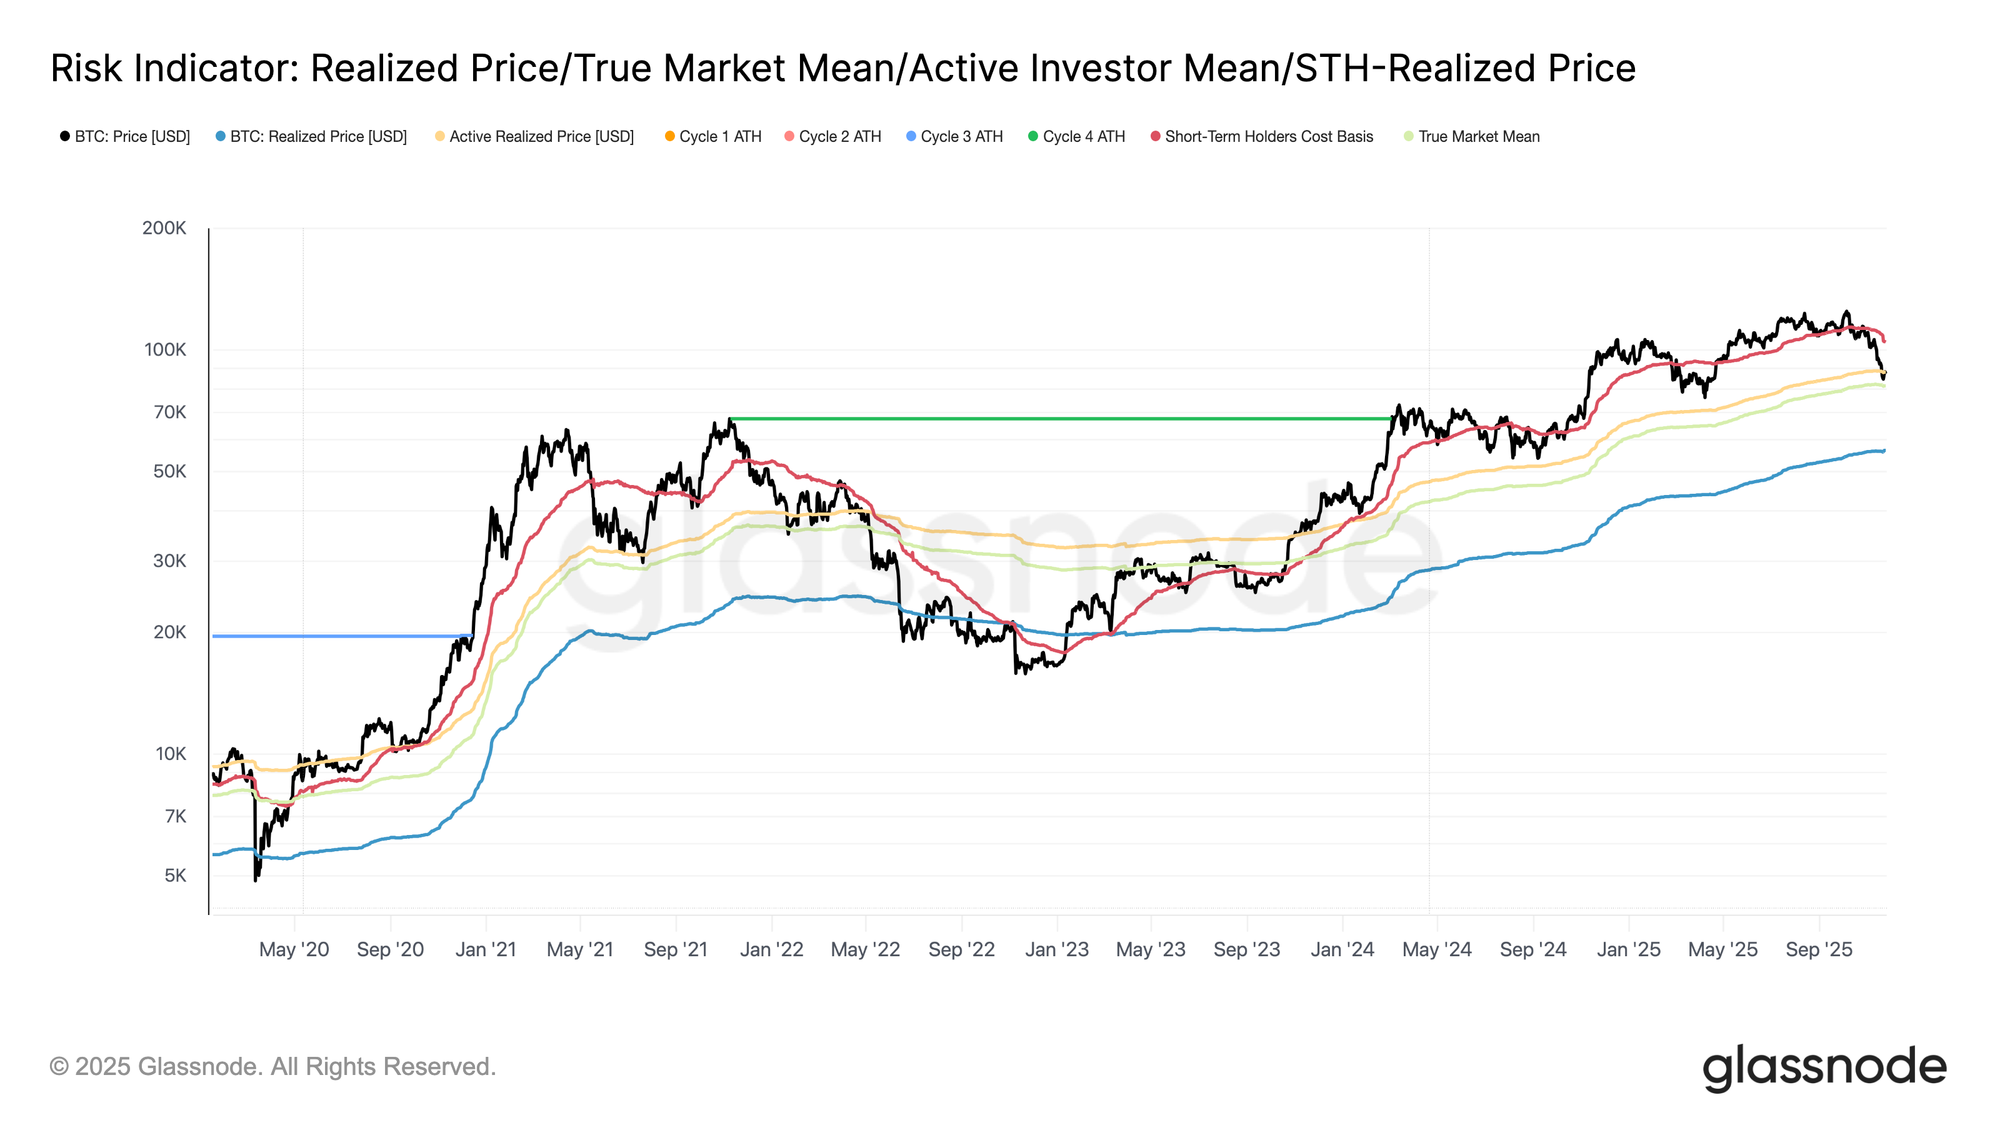
Trading below the short-term holder cost basis (~$104.6K) since early October has pushed Bitcoin into a zone that highlights the market’s lack of liquidity and demand. Price is now retesting a major structural range typically defined by the Active Realized Cap Price—the cost basis of all non-dormant coins—and the True Market Mean, which reflects coins acquired on the secondary market.
Over the past weeks, Bitcoin has compressed into the $81K–$89K band, a structure closely resembling the Q1 2022 post-ATH interval, where the market weakened under fading demand. This current range echoes the same dynamic with market drifting lower, constrained by limited inflows and fragile liquidity.
Losses Stack Up
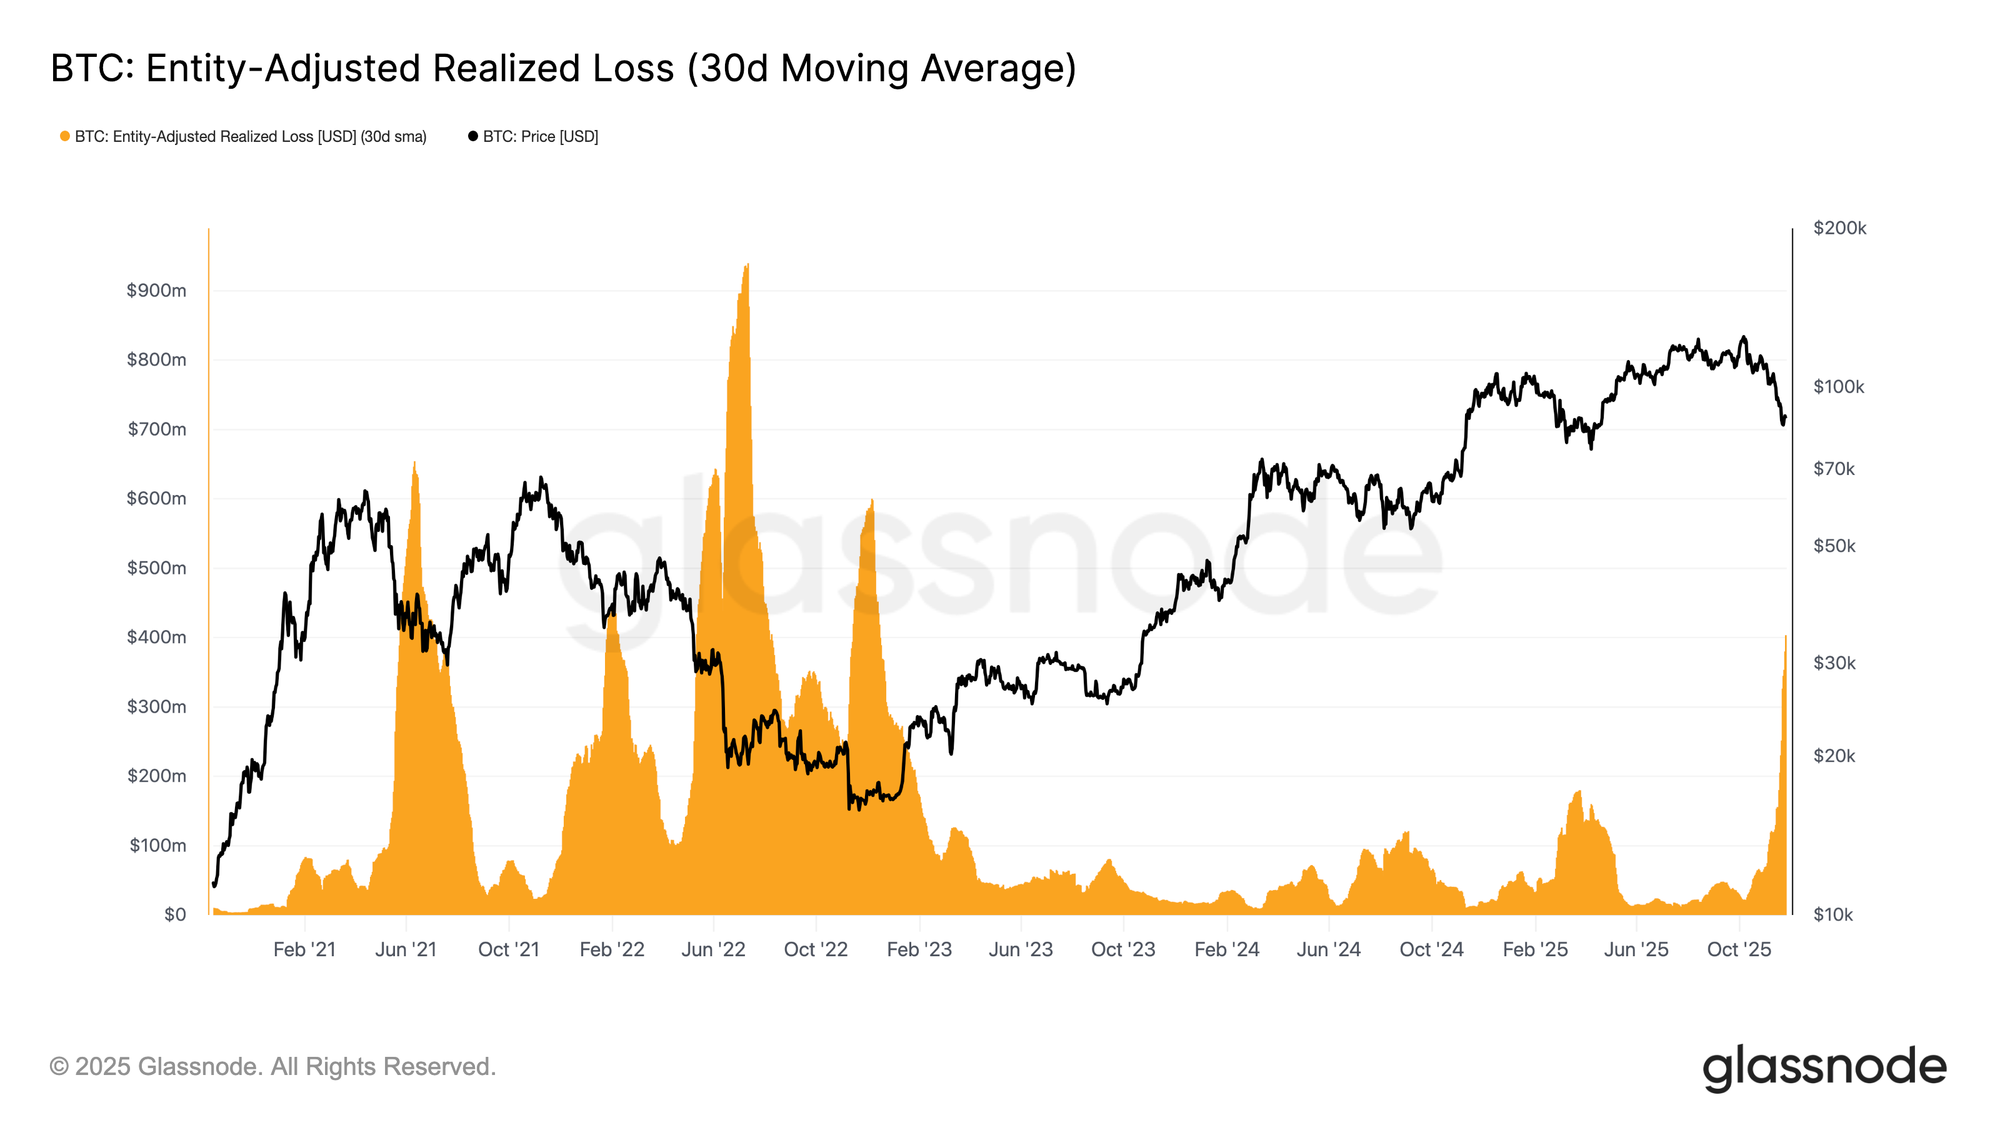
Transitioning deeper into this comparison, another angle that mirrors Q1 2022 is the sharp rise in Entity-Adjusted Realized Loss (30D-SMA), now climbing to $403.4M per day.
This level exceeds the waves of realized losses seen at both major lows earlier in this cycle, signalling a clear erosion of confidence in the uptrend. Such elevated loss realization is typical of a weakened, liquidity-seeking market, where investors increasingly exit at a loss as momentum fades.
Liquidity Stress Signals
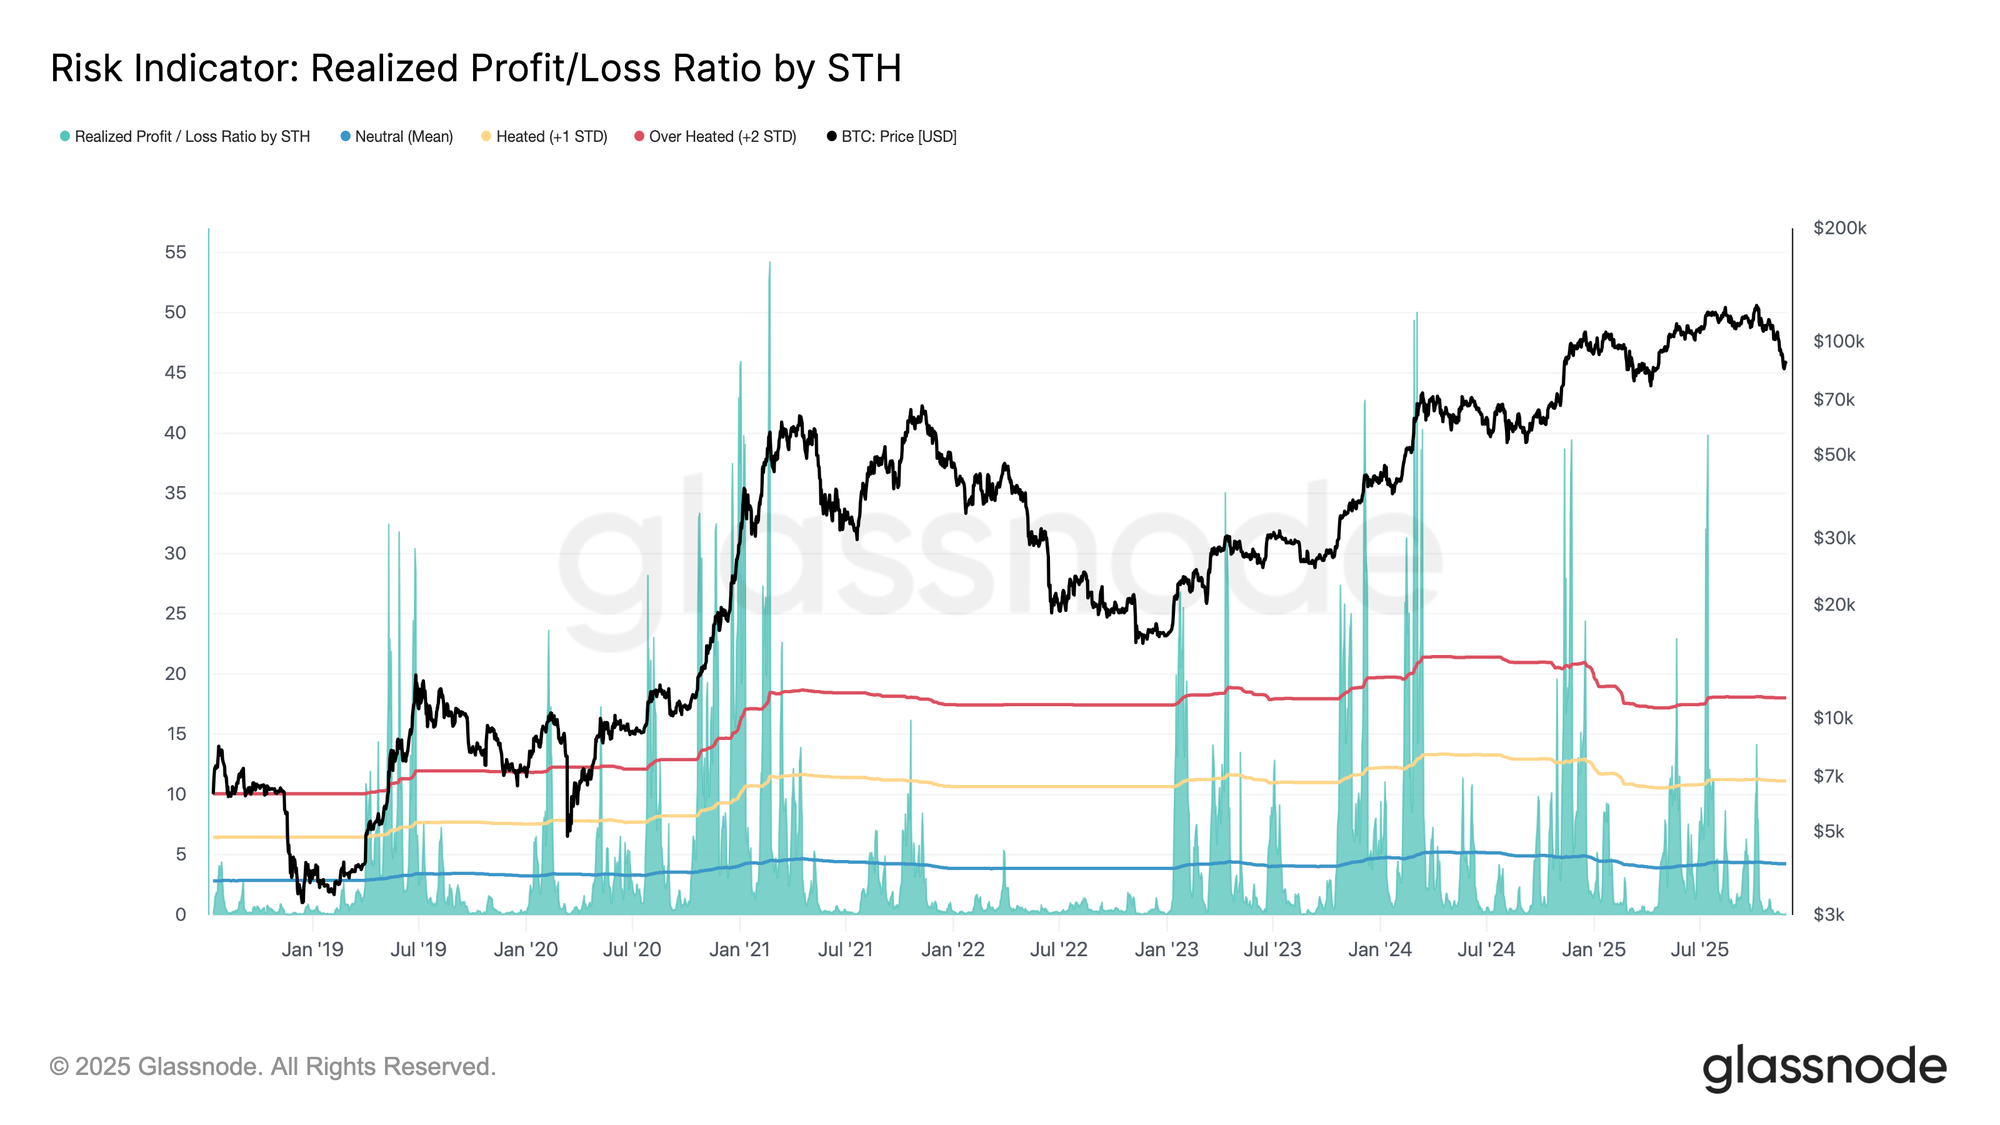
With market structure weakening, liquidity becomes the key lens for understanding what comes next. A prolonged low-liquidity regime increases the risk of further contraction, and the STH Realized Profit/Loss Ratio offers one of the clearest windows into current demand momentum.
This ratio, which compares realized profits to realized losses among recent investors, slipped below its neutral Mean (4.3x) in early October and has now collapsed to 0.07x. Such overwhelming loss dominance confirms that liquidity has evaporated, especially after the heavy demand absorption seen in Q2–Q3 2025 as long-term holders increased their spending.
If this ratio remains depressed, market conditions could begin to mirror the weakness of Q1 2022, raising the risk of a breakdown below the True Market Mean (~$81K).
Long-Term Liquidity at Risk
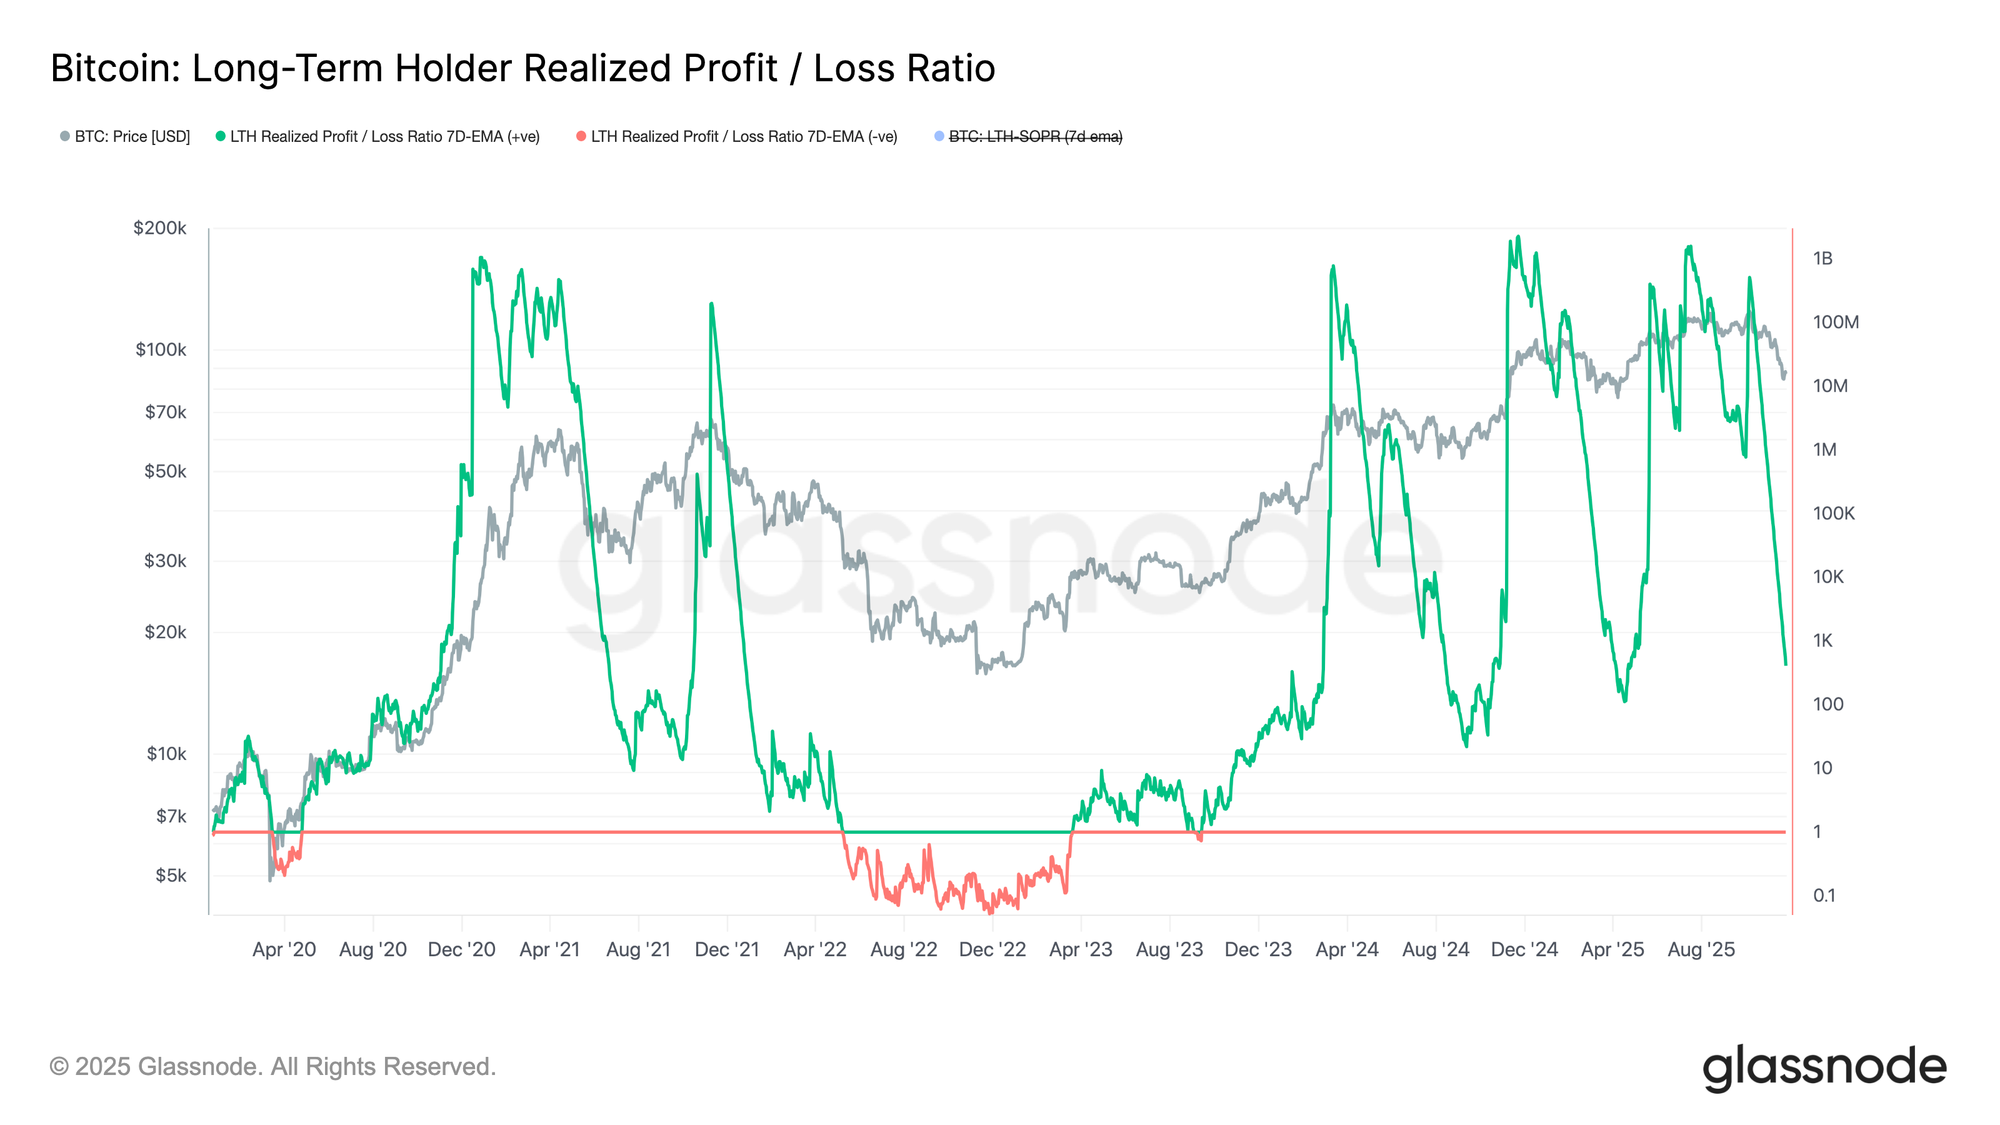
Liquidity traced through the realized profit/loss lens can also be extended to long-term momentum by examining the LTH Realized Profit/Loss Ratio. The 7D-SMA of this metric has followed the spot price lower, sharply dropping to 408x. Trading above ~100x still indicates healthier liquidity conditions compared to Q1 2022 or the major bottom-formation phases of this cycle, meaning long-term holders are still realizing profit, not loss.
However, if liquidity continues to fade and this ratio compresses toward 10x or lower, the probability of transitioning into a deeper bear market becomes difficult to ignore. This threshold has historically marked severe stress across long-term cohorts.
Off-Chain Insights
Leverage Bleeds Out
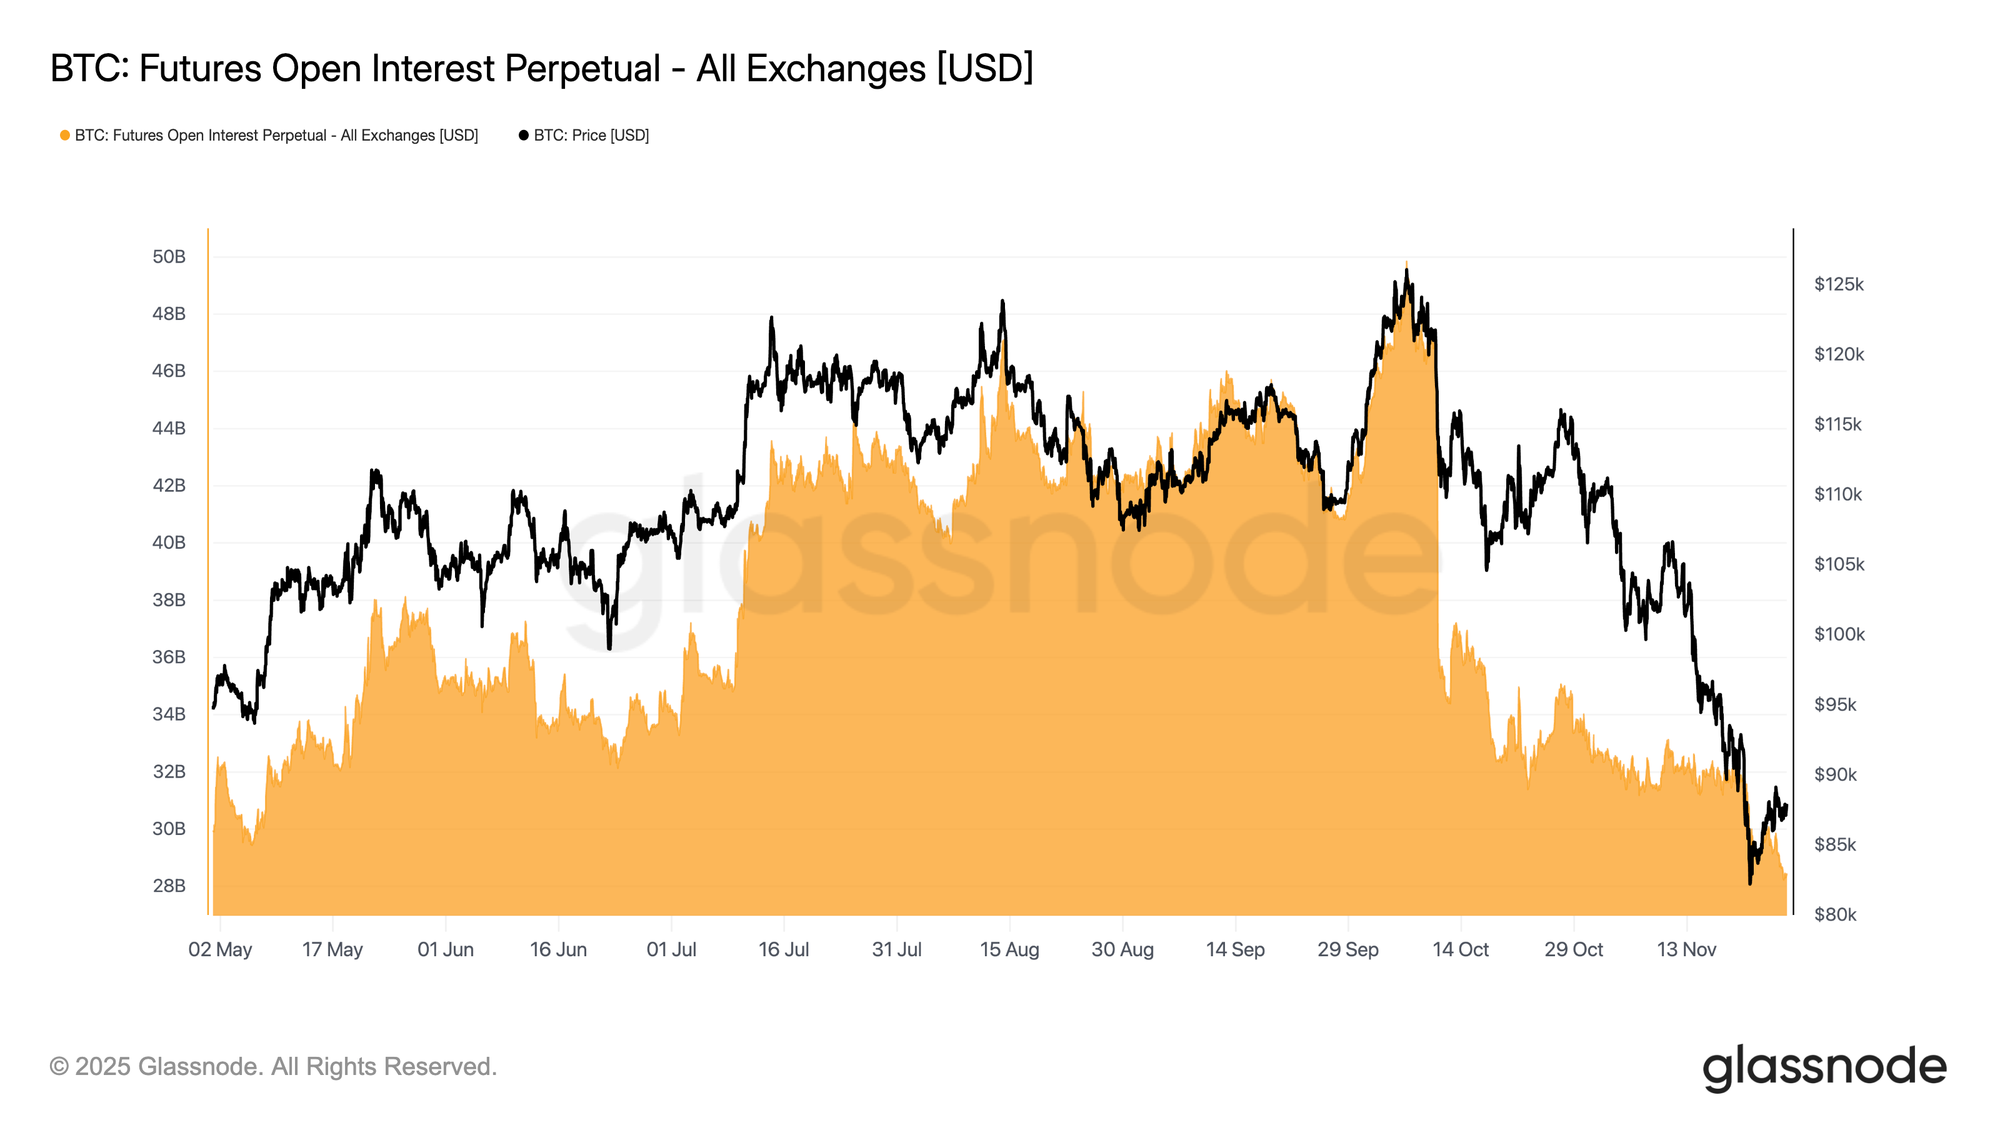
Shifting to off-chain dynamics, futures open interest continues to fall alongside price, steadily unwinding the leverage accumulated during earlier rallies. This deleveraging has remained orderly, with little evidence of forced liquidations, suggesting derivatives traders are adopting a controlled, risk-off posture rather than panic unwinding.
The market now rests on a leaner leverage base, which lowers the odds of sharp, liquidation-driven volatility and reflects a more cautious, defensive positioning across futures markets.
Funding Turns Cautious
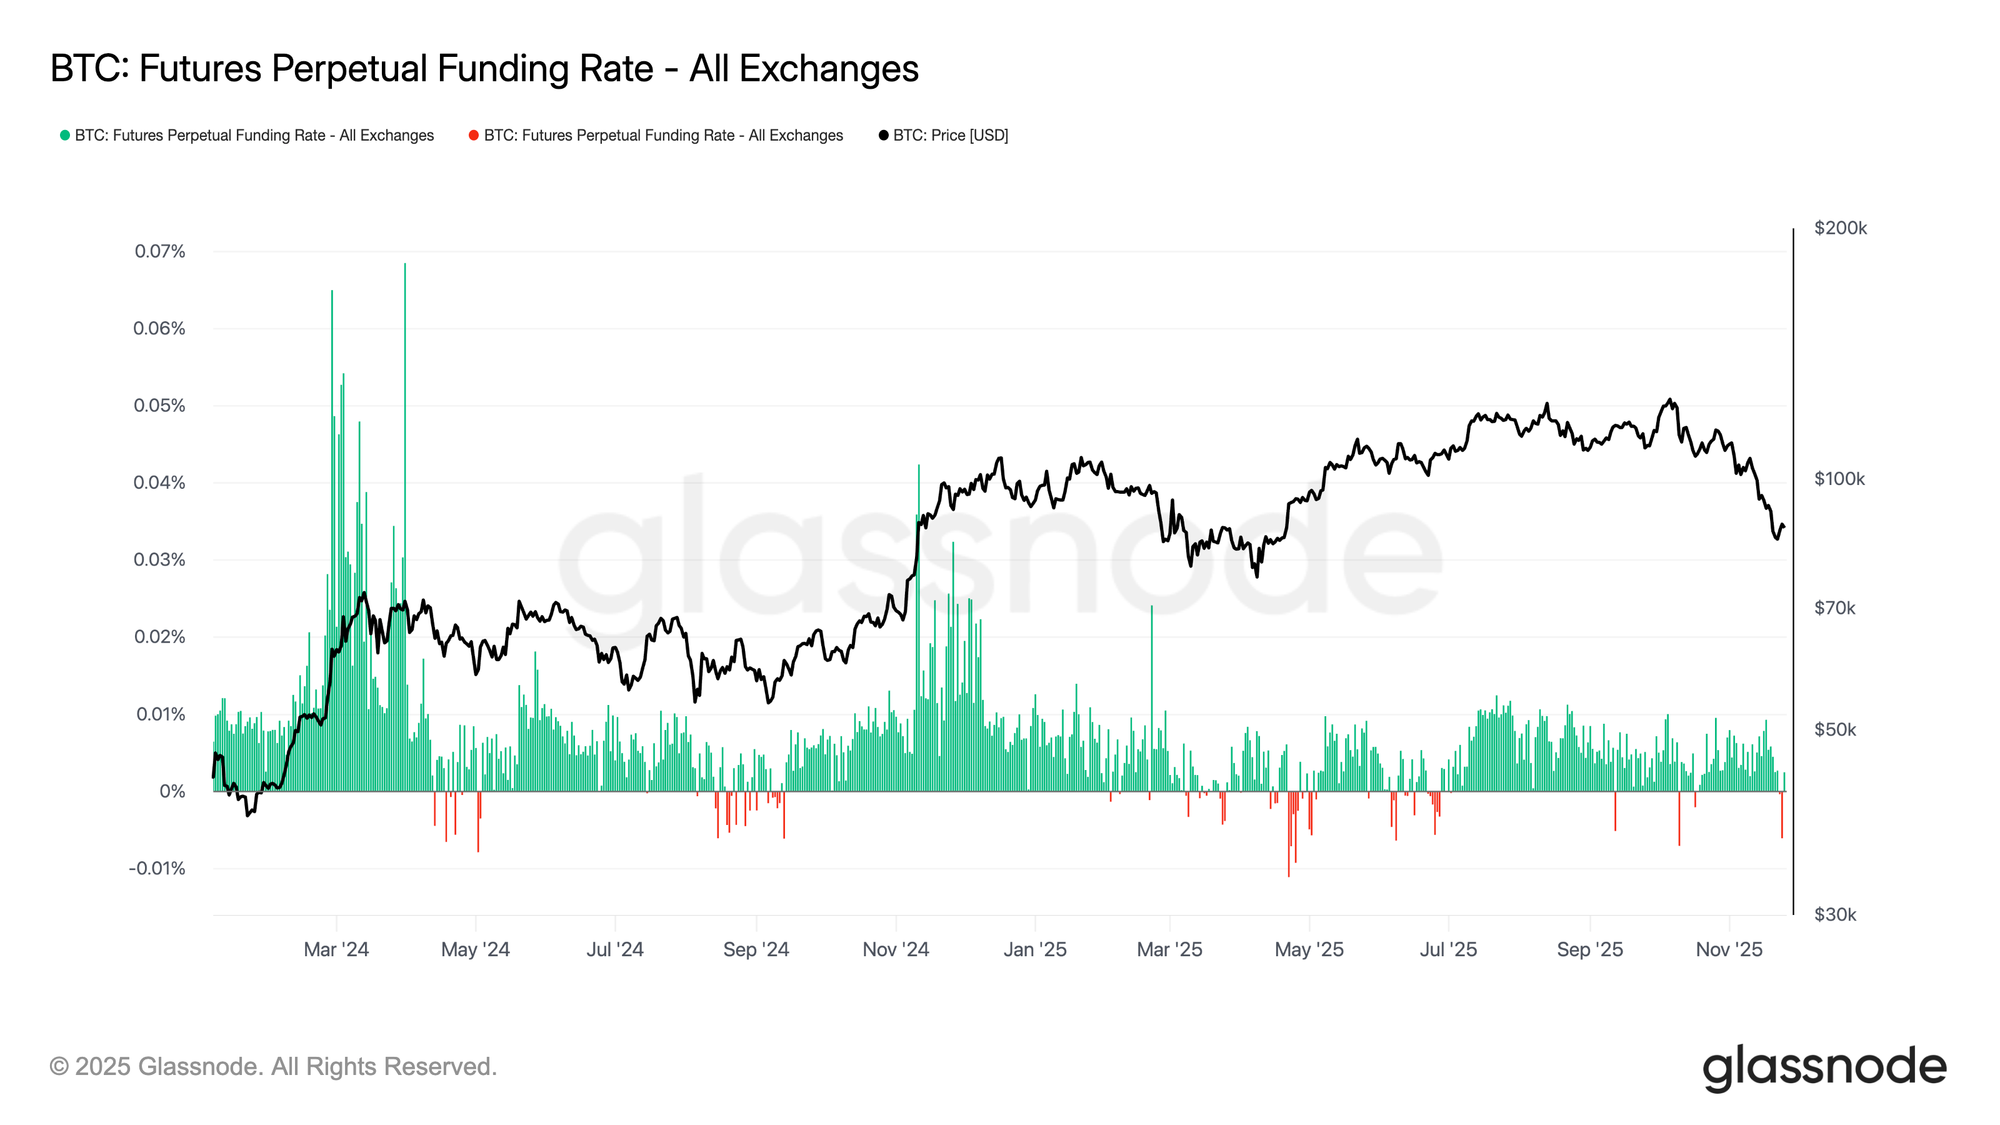
In parallel to the drop in open interest, perpetual funding rates have hovered near neutral, with occasional dips into negative territory. This marks a clear shift from the consistently positive funding typical of more speculative phases, signalling a more balanced and cautious derivatives environment.
Neither aggressive short exposure nor strong long interest is taking control, leaving the market in a tentative state of fragile equilibrium as traders wait for clearer signals before committing to direction.
A New High in Options OI
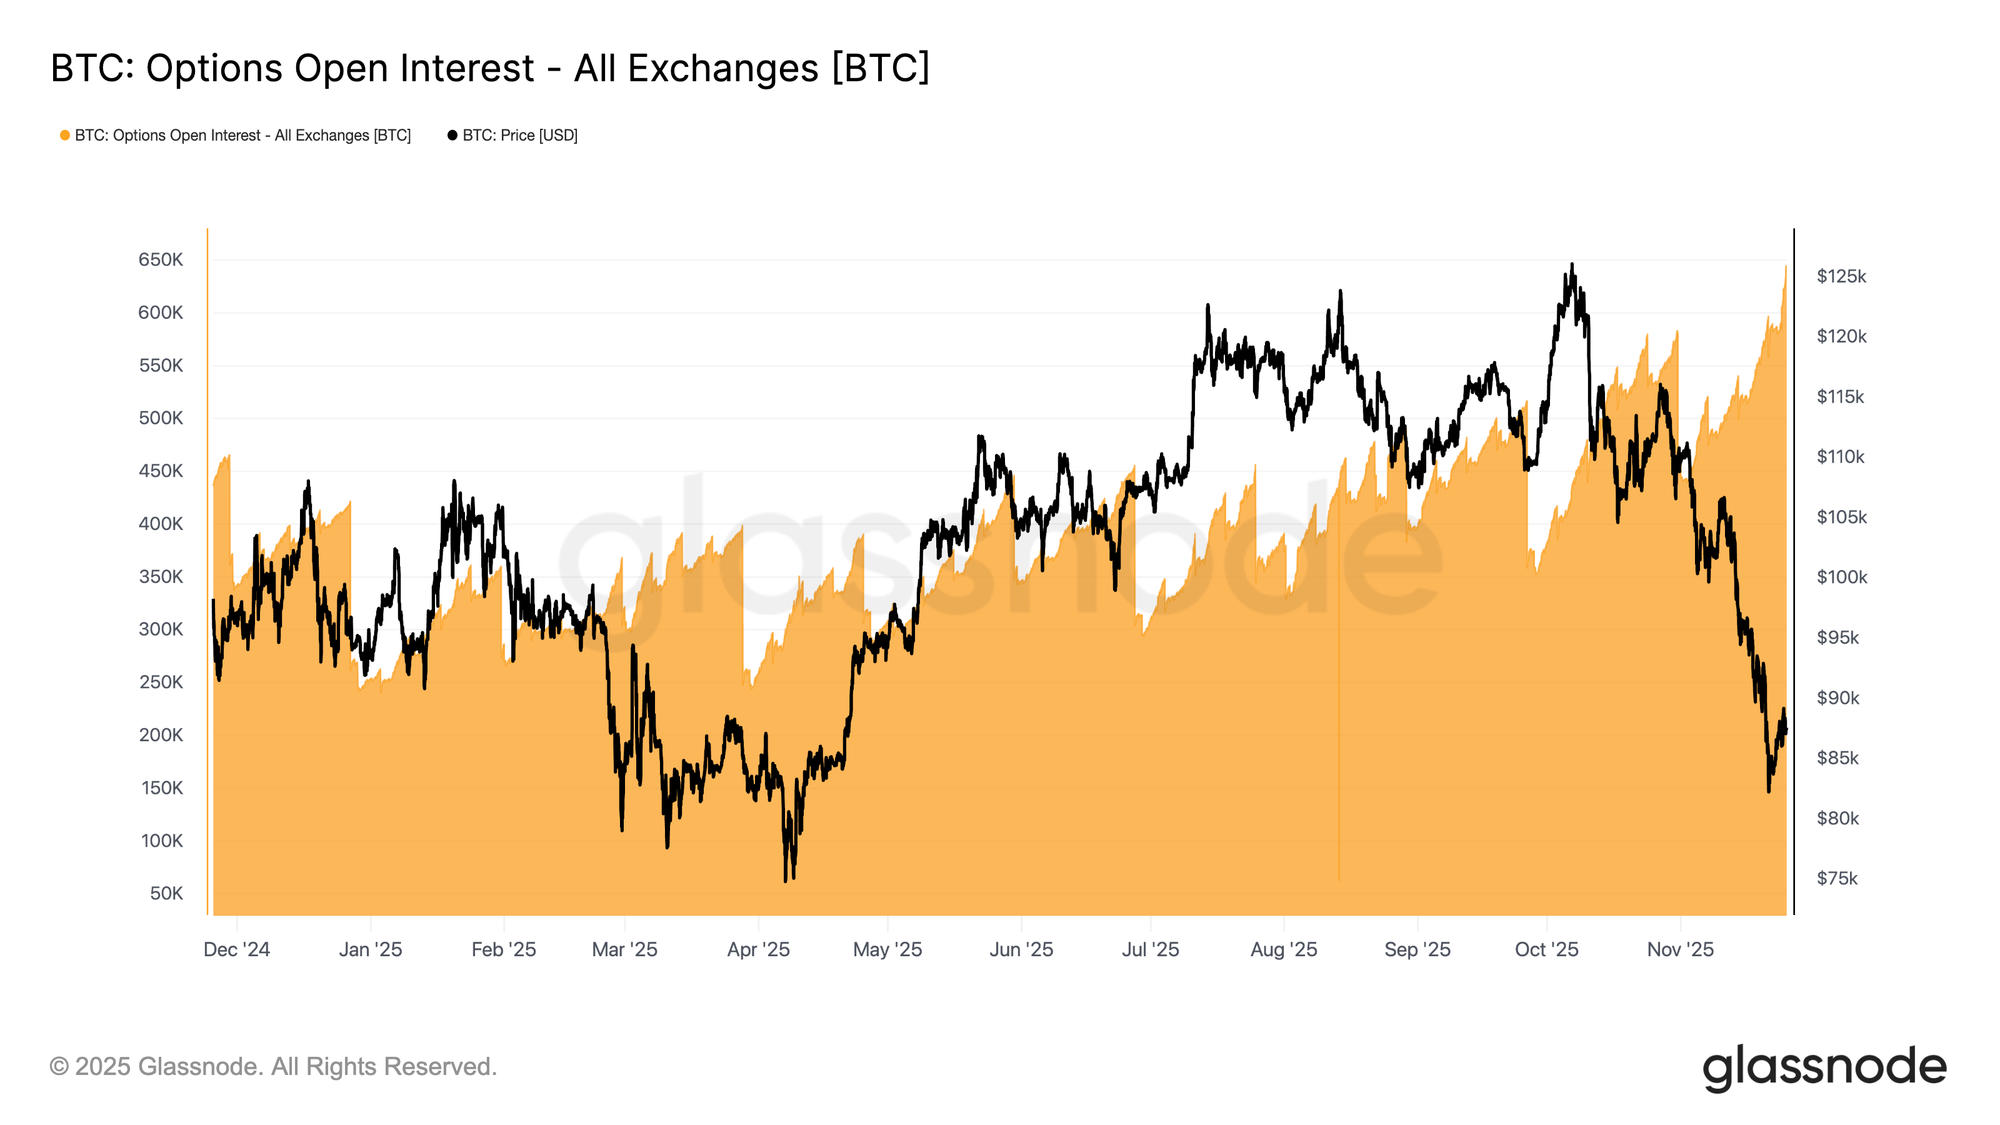
The recent surge in volatility has increased activity across the options market. A combination of volatility-arbitrage strategies and renewed demand for risk management has pushed BTC-denominated options open interest to its highest level ever. It’s important to emphasize that this applies only to BTC terms. In USD terms, open interest remains well below the late-October peak, when Bitcoin was trading near $110k.
Even so, the current build-up highlights how engaged the market has become as participants reposition around the latest price swing. This sets the stage for the upcoming key expiry, which is shaping up to be one of the most significant in the near term.
Upside Capped & Downside Risk Not Washed Out
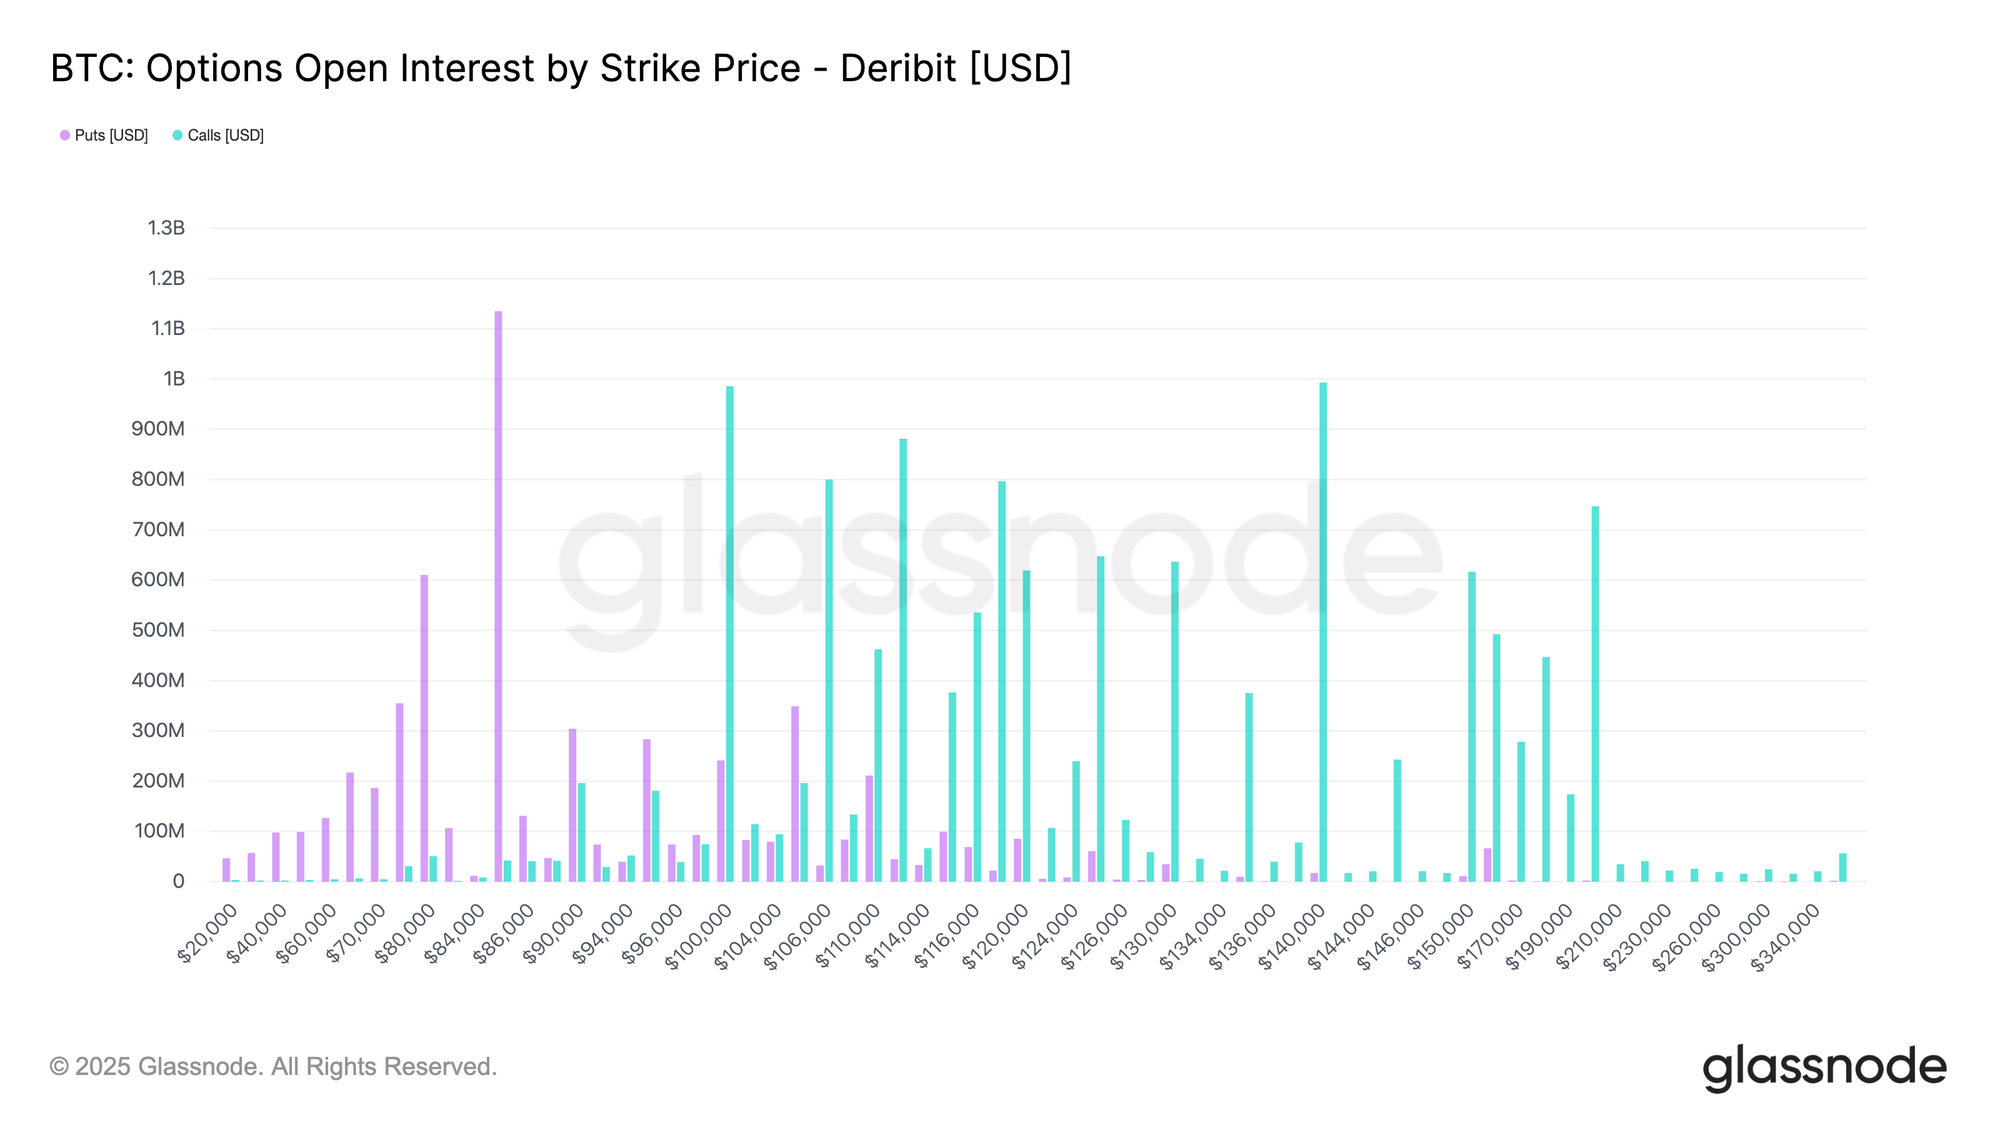
The most important expiry of the year is approaching, and its influence has grown alongside the expansion of the options market. Large clusters of open interest, and the hedging flows around them, help shape which price levels attract liquidity. Hedging needs rise as gamma increases, and gamma is typically highest as we near expiry and when spot trades close to the at-the-money strike. This makes late December a period where volatility can meaningfully pick up.
The strike distribution shows a heavy put concentration near $84k and growing call interest around $100k. The zone between these strikes is relatively thin, creating room for sharper movement within that range. Dealers are short gamma on puts and long gamma on calls, implying that upside may remain capped over the coming weeks, while downside risk has not been fully cleared. In short, the recent rebound may continue to struggle below key resistance.
A Short-Term Skew Less Bearish
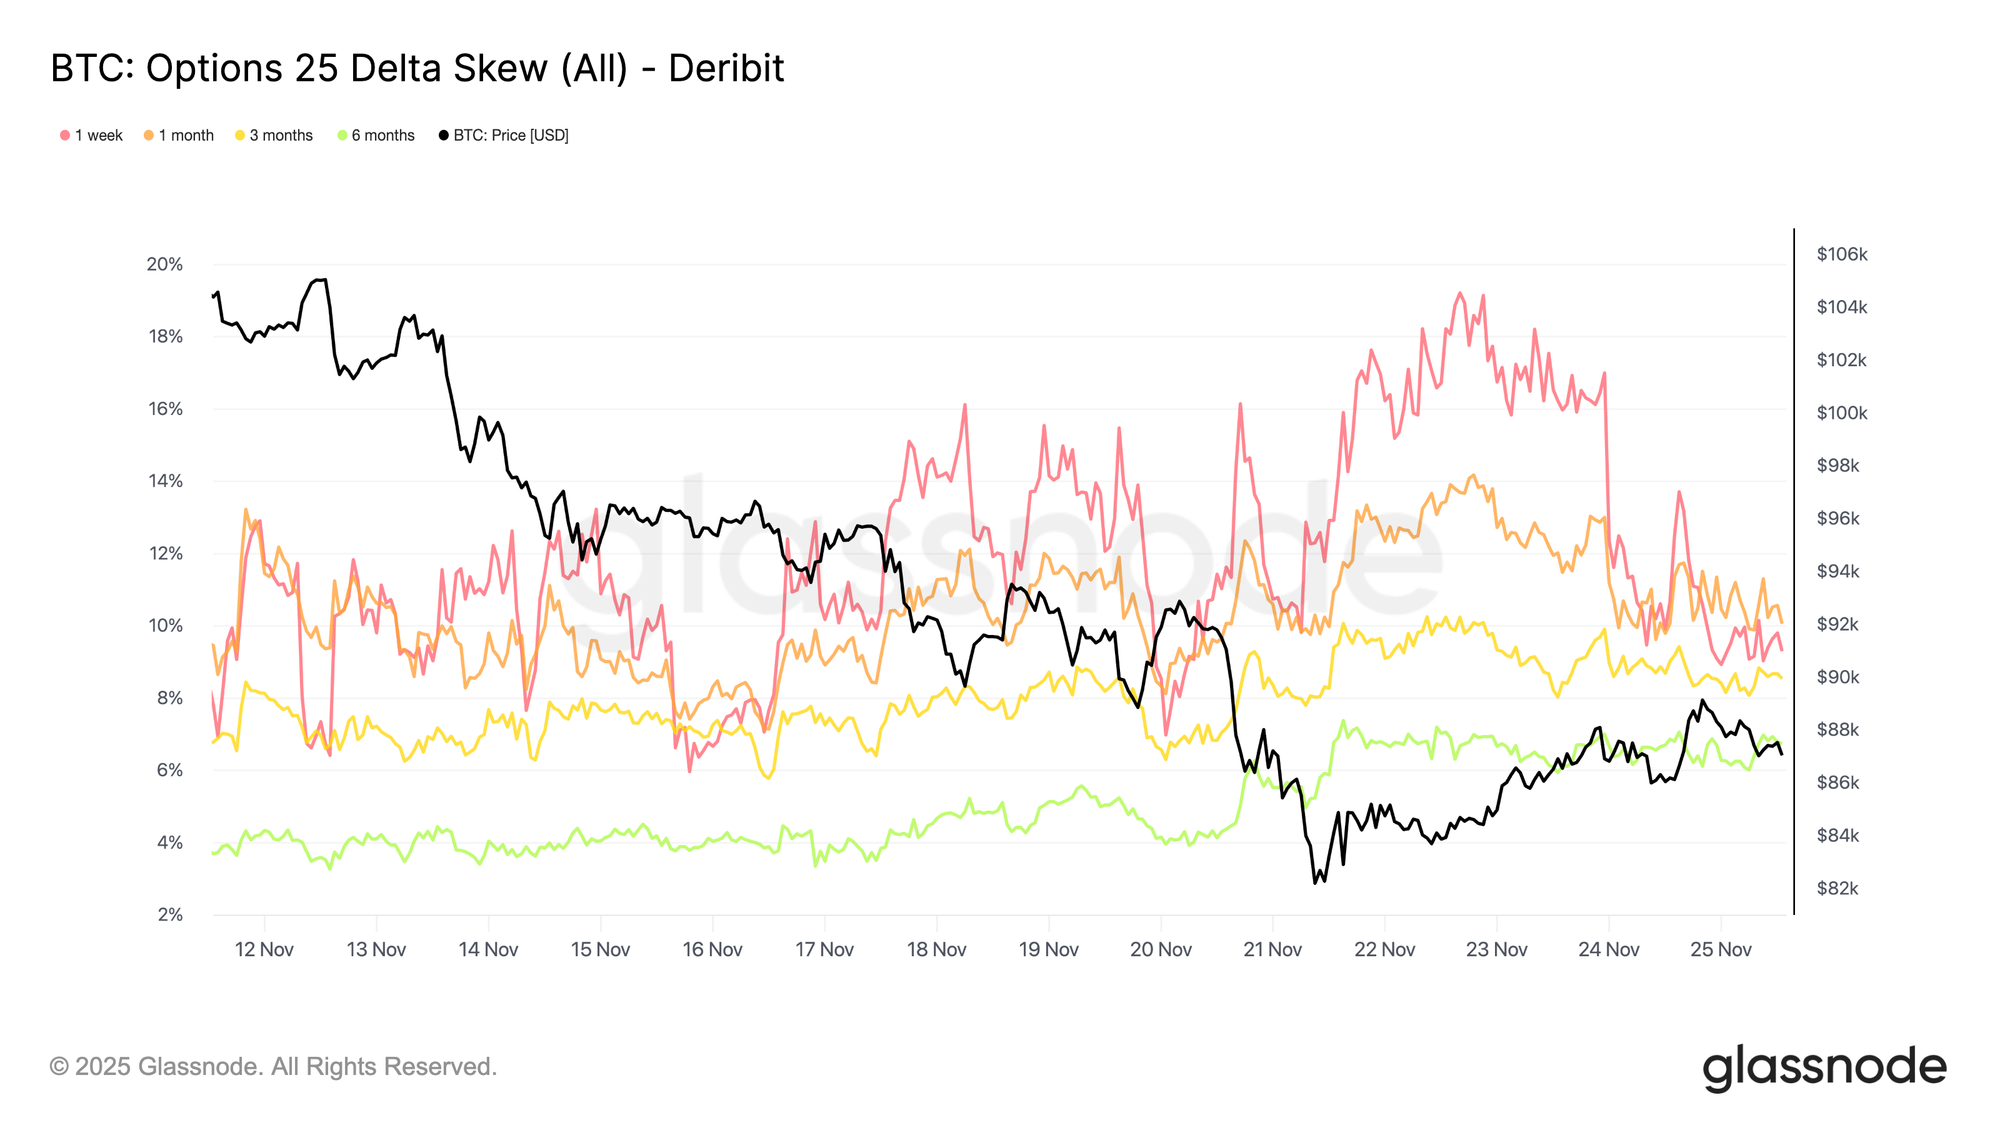
Moving from strike positioning to sentiment indicators, the 25-delta skew shows a clear shift in short-term expectations. The one-week skew dropped sharply from an 18.5% put premium on Sunday to 9.3% by Tuesday morning, now sitting below the one-month skew. This reset suggests the market has, for now, priced out the most immediate crash risk. Short-dated demand for protection has eased noticeably following the recent rebound.
The picture further out of the curve is different. Over the past two weeks, the six-month skew in favor of puts has nearly doubled, reflecting rising concern about a prolonged bearish path into 2026. Longer-dated skew remains elevated relative to short-term maturities, pointing to persistent demand for tail-risk protection even as near-term fear moderates.
Volatility Reverting
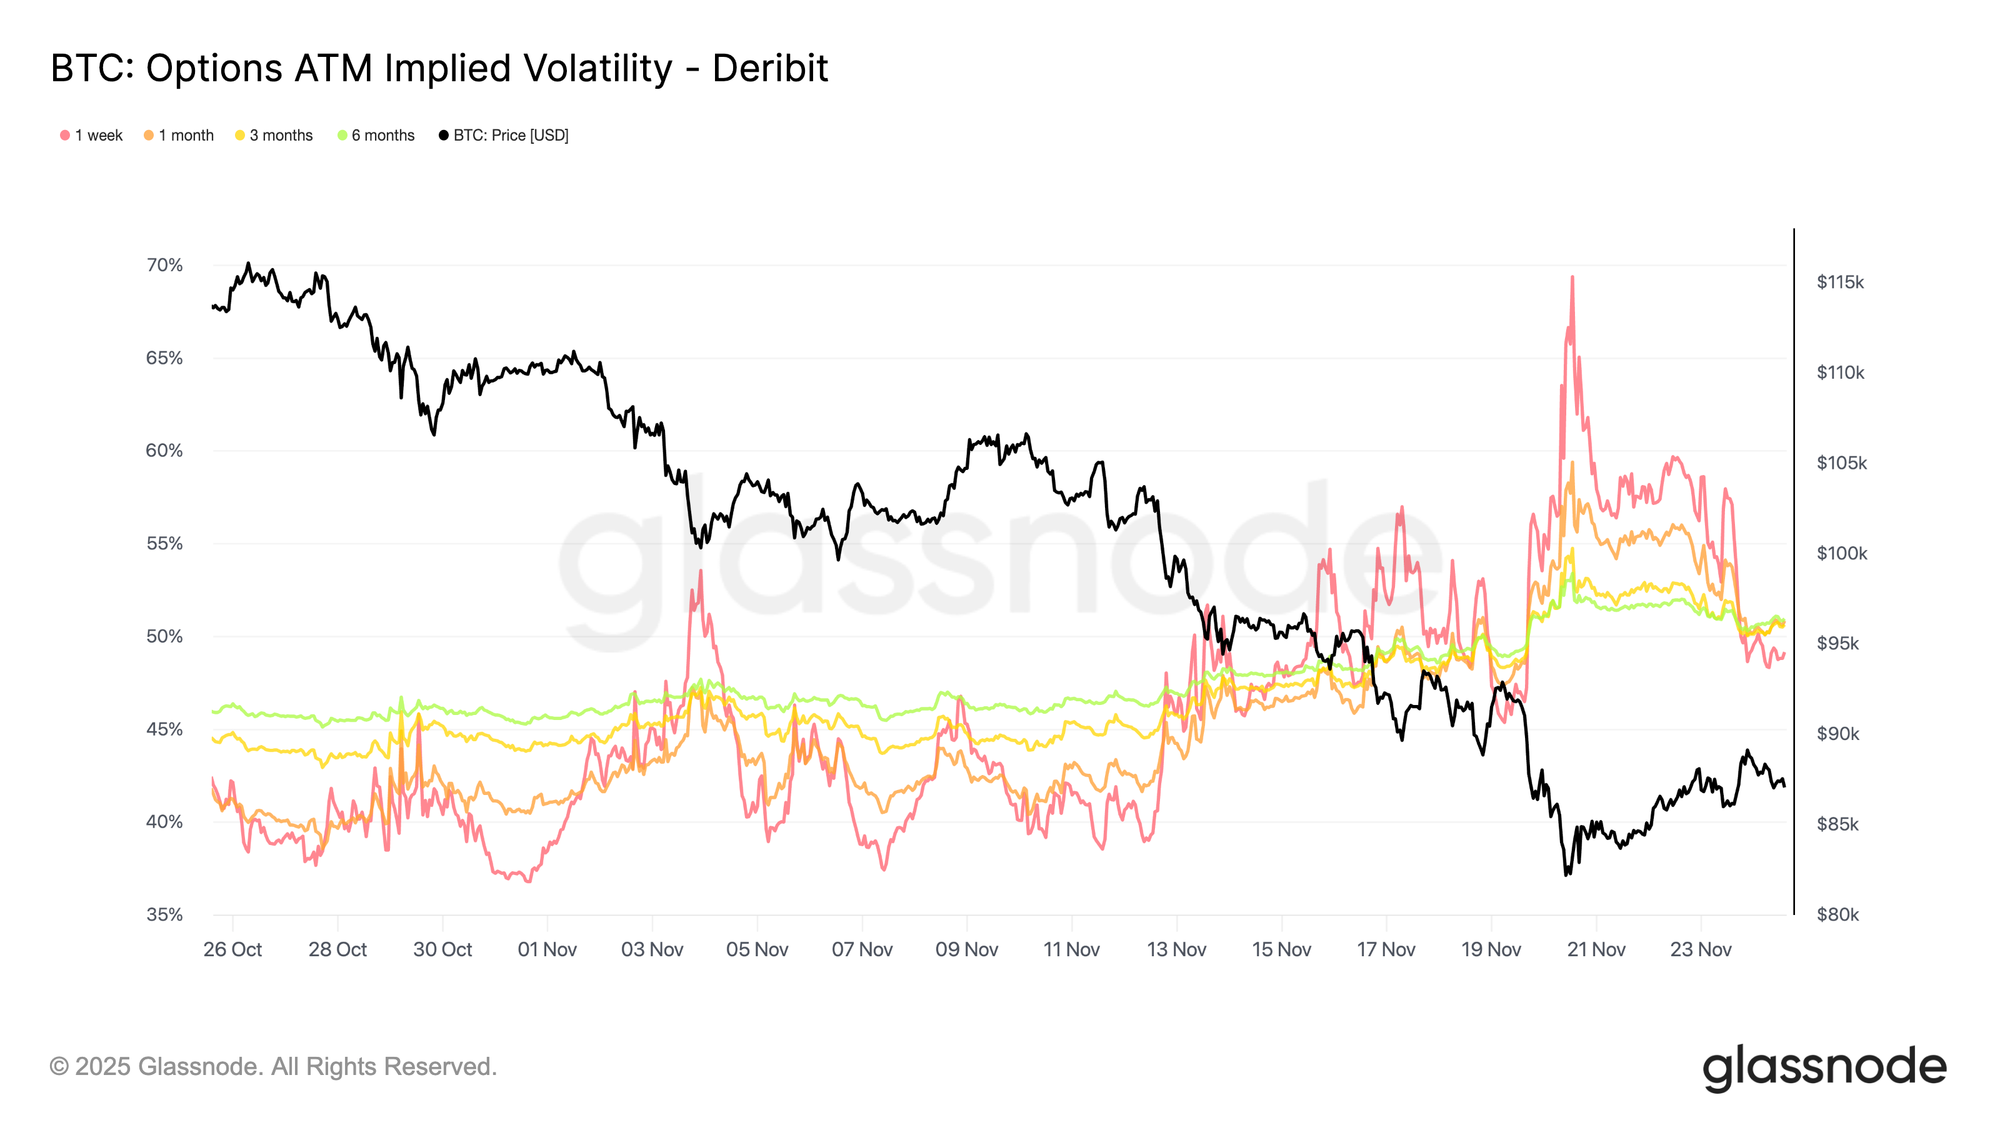
Following the shift in skew, volatility itself is beginning to move back toward more typical levels. Recent patterns show a clear mean reversion, suggesting that volatility sellers are stepping back in — though implied volatility still sits above what the market has delivered in recent sessions. One-month implied volatility remains elevated, even after the short end dropped roughly 20 vol points from its peak earlier in the week and about 10 vol points from levels seen in recent days. This retracement indicates that part of the stress premium is being unwound.
Taken together, the decline in implied volatility and the easing of put skew point to softer demand for immediate downside protection. Short-term fear has cooled, even if the broader environment remains prone to sudden shifts.
In Positive Carry Territory
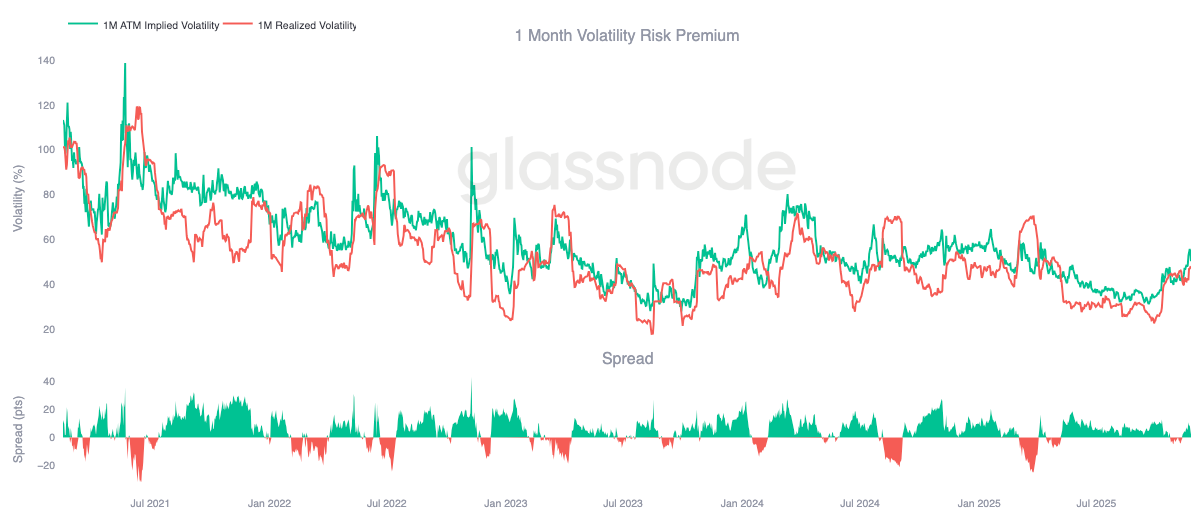
Shifting from volatility levels to carry dynamics, the current market environment has moved into positive carry territory. In options terms, positive carry means short positions earn theta because realized volatility is running below implied volatility. Put simply, the market is not moving as much as the options market is pricing in, allowing sellers to collect time decay without giving it back through hedging losses.
One-month implied volatility remains elevated, and far-out-of-the-money options expiring in late December still command high premiums. This setup makes selling volatility appear attractive from a carry perspective, since implied volatility sits above what the market has recently delivered. However, conditions can shift quickly, and the upcoming Federal Reserve meeting introduces potential event risk that could change realized volatility and the carry landscape.
Downside Flow
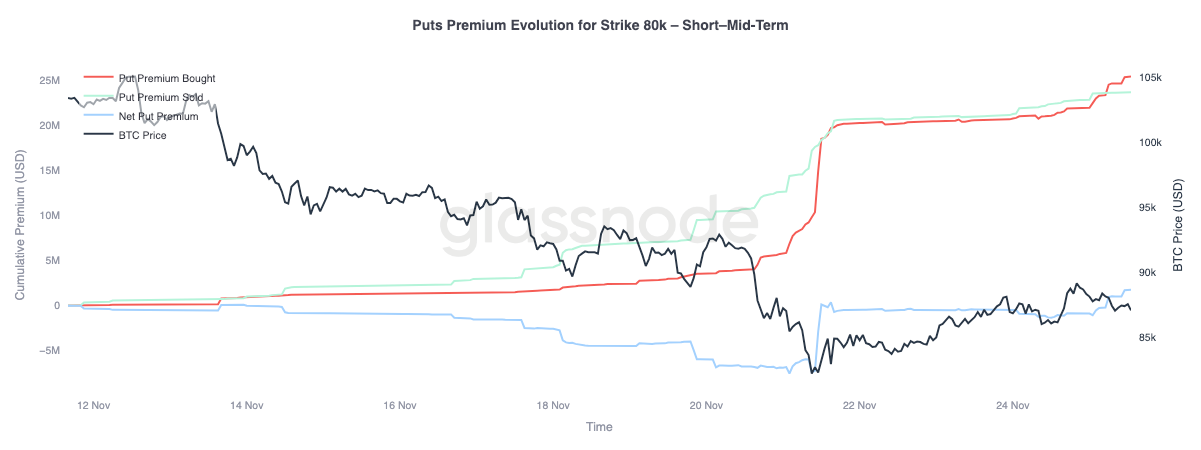
Turning to flows, the activity around the $80k put offers a clear view of how downside protection has evolved across short- and mid-term expiries. Put demand has flattened over the past four days, aligning with the rebound that began near $80.5k. This plateau indicates that the immediate need for short-dated hedges has eased. The sharp pickup in downside protection observed during the selloff has not continued since the recovery started.
With short-dated downside flows fading, the market is signaling that the probability of an extended move lower is now viewed as smaller than during the recent decline. Sentiment has shifted from urgent protection to a more measured, cautious stance.
Upside Flow
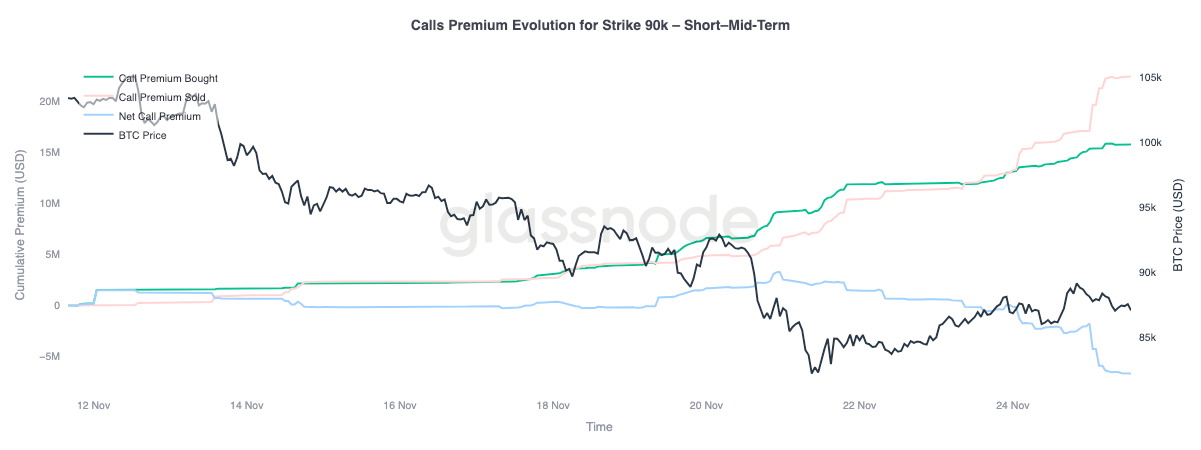
Looking at flows on the upside provides a contrasting message. Even though the market now sees a reduced risk of an immediate crash, it does not yet believe in a sustained recovery. The preference has been to fade attempts to reclaim the 90,000 level rather than position for a breakout, highlighting that confidence in the rebound remains limited.
The flow data supports this view. Call premium sold has exceeded call premium bought, while price has been grinding higher. Participants are using the bounce to sell premium and collect carry, rather than commit to upside continuation. The recent move up may have removed short-term panic, but it has not resolved the deeper structural fragility still present in the market.
Conclusion
Bitcoin remains in a structurally fragile state, trading within the $81K–$89K range after breaking below key cost-basis levels. On-chain data shows rising stress: STH loss ratios collapsing to 0.07x, long-term holders reducing profit margins, and realized losses reaching levels comparable to early-cycle lows. Liquidity continues to thin, and unless demand strengthens, the risk of retesting the True Market Mean (~$81K) remains elevated.
Off-chain signals echo this caution. Futures open interest is unwinding steadily, funding rates are neutral, and leverage across major assets has faded. In the options market, heavy put interest near 84K, capped call appetite near 100K, and elevated implied volatility all point to a market bracing for volatility into the December expiry. Upside flows are still being faded, while downside protection is stabilizing rather than disappearing.
In sum, Bitcoin is not in full capitulation but remains firmly in a low-liquidity, low-conviction environment. Until price reclaims major cost-basis levels and fresh demand returns, the market is likely to stay in a defensive consolidation phase.
Disclaimer: This report does not provide any investment advice. All data is provided for informational and educational purposes only. No investment decision shall be based on the information provided here, and you are solely responsible for your own investment decisions.
Exchange balances presented are derived from Glassnode’s comprehensive database of address labels, which are amassed through both officially published exchange information and proprietary clustering algorithms. While we strive to ensure the utmost accuracy in representing exchange balances, it is important to note that these figures might not always encapsulate the entirety of an exchange’s reserves, particularly when exchanges refrain from disclosing their official addresses. We urge users to exercise caution and discretion when utilizing these metrics. Glassnode shall not be held responsible for any discrepancies or potential inaccuracies.
Please read our Transparency Notice when using exchange data.