Bitcoin is now trading roughly 30% below its $126,000 all-time high, reflecting a market gripped by selling pressure, uncertainty, and fading confidence. The sharp downturn has shaken investors who expected continued upside, and many analysts are beginning to argue that the cycle has already peaked.
Price action remains fragile, with buyers struggling to regain control and momentum indicators pointing to exhaustion rather than strength. Yet, despite the bearish tone, there are emerging signs that the current phase may be approaching an inflection point.
According to top analyst Axel Adler, both the Bitcoin Bull-Bear Index and the Futures Flow Index remain firmly within a bearish regime, signaling that market structure still favors downside risk. However, Adler highlights that Bitcoin is currently trading 11% below its 30-day fair value of $99.2K, suggesting a notable disconnect between price and underlying derivatives positioning.
This divergence has historically appeared near corrective exhaustion zones rather than early-stage declines. Additionally, short-term dynamics across both indices indicate the first signs of an attempted reversal, with selling pressure slowly weakening and momentum beginning to stabilize.
Bearish Structure Weakens as Bitcoin Attempts to Stabilize
The daily Bitcoin bull and bear structure index shows a sustained shift to the bearish side since November 11, reflecting the strongest downside momentum of this cycle. The red BEAR line moved deep into negative territory at -36%, signaling persistent dominance of selling pressure.
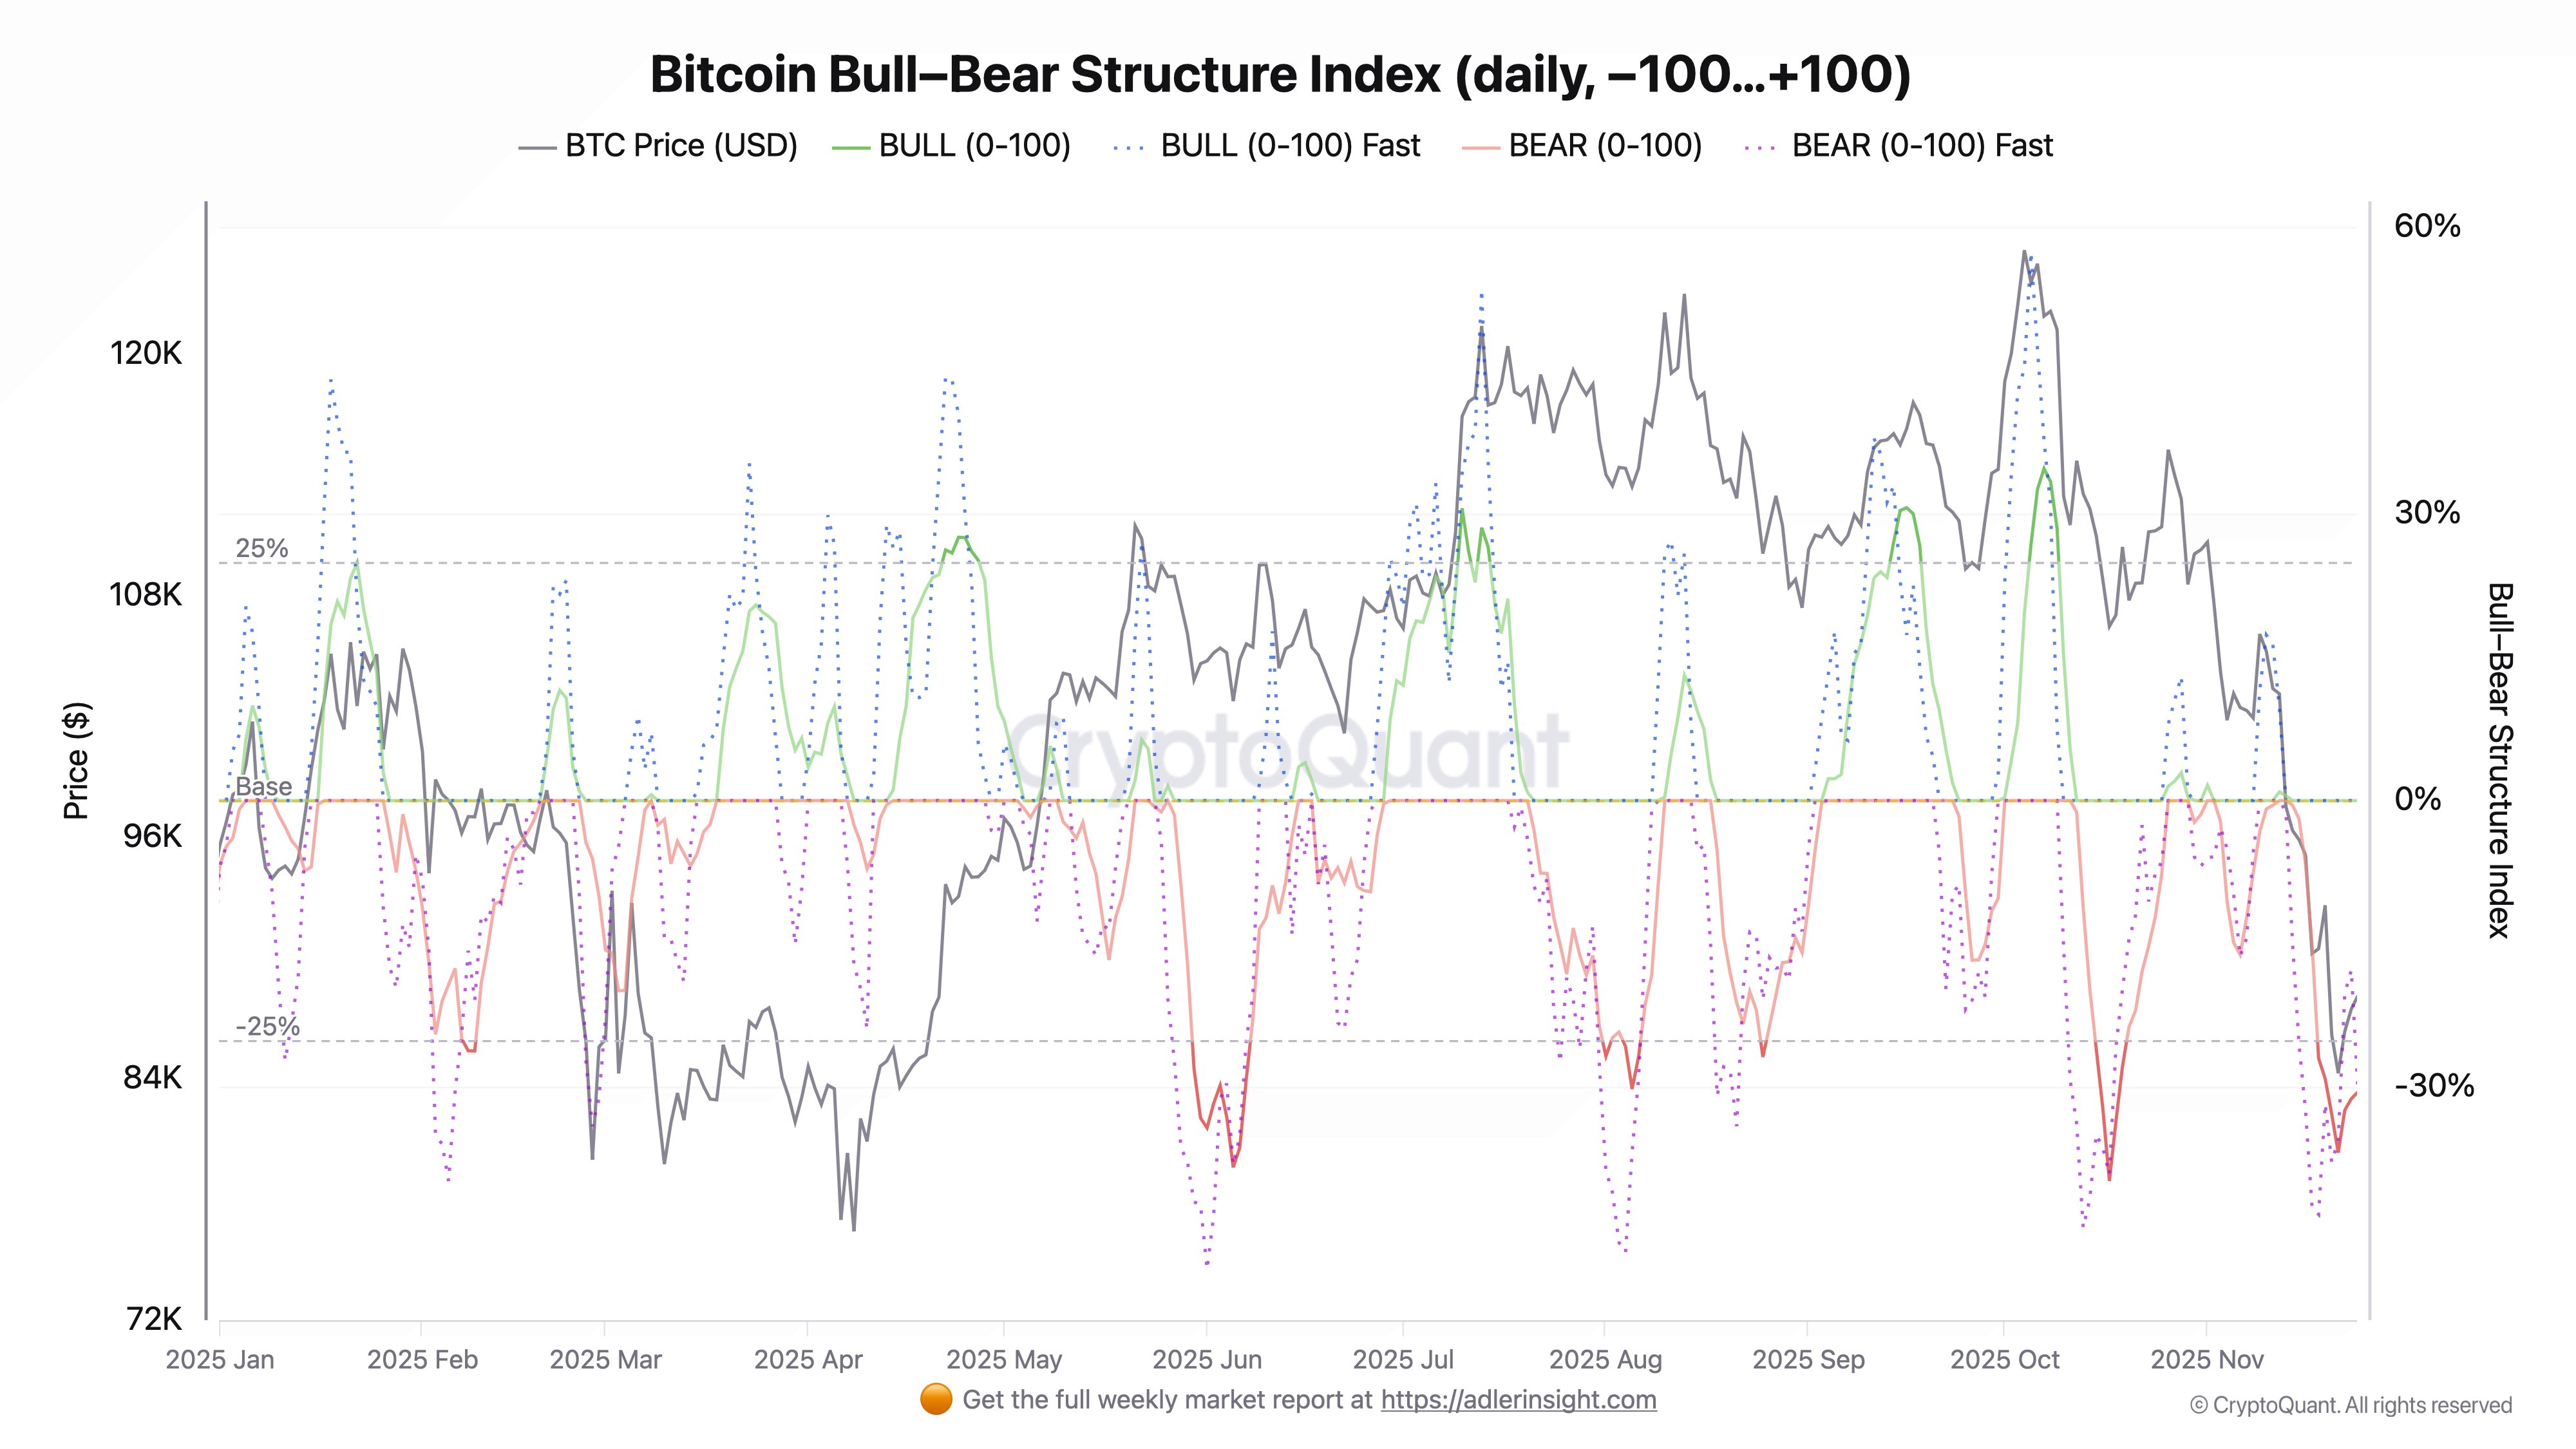
However, the indicator is now starting to reverse, suggesting that the most aggressive phase of bearish control may be fading. At the same time, Bitcoin is consolidating around $87,000 after briefly plunging to $80,000, marking an early attempt to stabilize and rebuild support following the sharp decline.
Fast versions of the index highlight increased volatility, with the metric rising from -43 to -20 — a clear sign that bear pressure is easing. Although this does not yet indicate a trend reversal, it reflects a meaningful reduction in downside intensity. In the futures market, the index remains in a bearish regime as well, with values rising but still failing to break above the key 55 threshold. A move above that level would signal the first structural attempt to transition back into a bullish phase.
The fair value level, currently positioned at $99,000, shows Bitcoin trading $11,000 below equilibrium, reinforcing undervaluation. Together, both indices indicate that the market is attempting to exit the bearish regime it has been trapped in for more than a month, though confirmation will require stronger follow-through.
Weekly Structure Tests Key Support Amid Attempted Stabilization
Bitcoin’s weekly chart shows the market attempting to stabilize after a sharp decline from its all-time high near $126,000. Price is currently trading around $87,300, reflecting a significant drawdown of more than 30% from the peak. The recent candle structure highlights a temporary rebound after tagging lows near $80,000, suggesting that buyers have stepped in at a critical support zone.
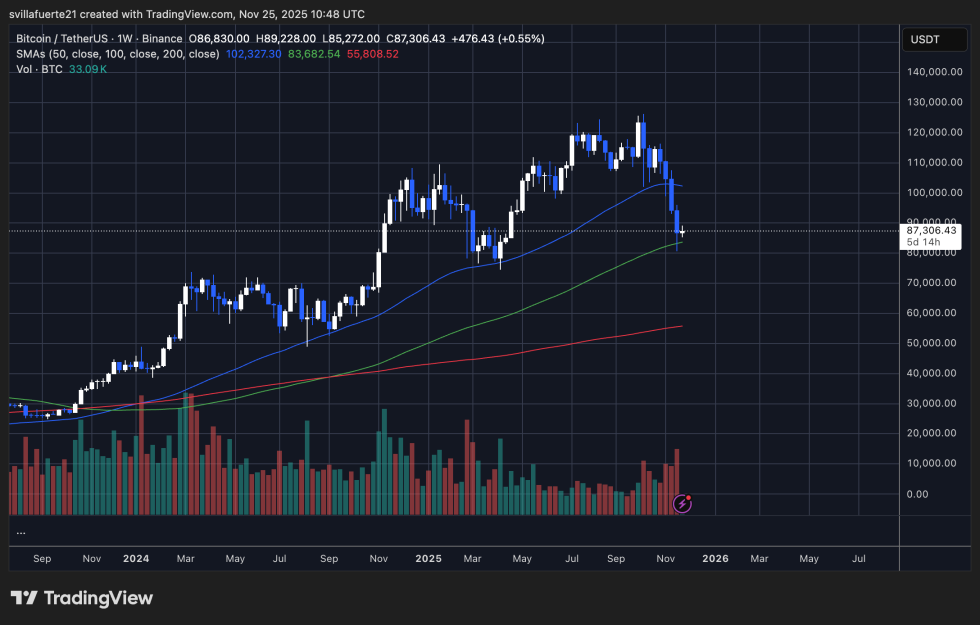
The 100-week moving average, sitting close to current levels, is acting as an important dynamic support and has historically served as a threshold separating bullish continuation from deeper cyclical breakdowns. Despite the bounce, the price remains below the 50-week moving average, which is beginning to curl downward, signaling weakening trend strength.
Volume increased noticeably during the selloff, reflecting capitulation behavior and aggressive repositioning among market participants.
Related Reading: Bitcoin Loses $85K as Coinbase Premium Stays Negative for 21 Straight Days – Details
If Bitcoin maintains support above this zone and reclaims the 50-week moving average, a recovery toward the $95,000–$102,000 region becomes plausible. However, if selling pressure resumes and the price loses the 100-week moving average, the next downside magnet sits near the $75,000–$78,000 range.
The weekly structure shows a market in correction but not yet in a confirmed macro reversal, with the upcoming candles likely determining whether the cycle continues or breaks down further.
Featured image from ChatGPT, chart from TradingView.com

Related Posts