Excerpt
Bitcoin continues to defend key on-chain support at the short-term holder cost basis, while ETFs and cooling LTH supply offer stability. Options markets reset post-expiry, with OI rebuilding, volatility easing, and flows tilting toward cautious Q4 upside.
Executive Summary
- Bitcoin repeatedly defended the short-term holder cost basis, underscoring its role as a key pivot between bullish continuation and bearish risk. Price faces strong resistance at the $118k supply cluster, where recent top buyers may look to exit.
- Long-term holder distribution has cooled after months of steady selling, and ETF inflows have resumed, providing a stabilizing influence on market structure. Together, these dynamics point to healthier demand-side conditions.
- The Fear & Greed Index has retreated from sustained Greed into Neutral and Fear territory, reflecting profit-taking and reduced risk appetite. RVT trends confirm this cooling backdrop, with fewer profits realized relative to network value.
- Options open interest reset after last week’s record expiry, now rebuilding into Q4. This reset clears hedging-driven noise and leaves room for new positioning to guide price action.
- Volatility signals are easing, with front-end IV declining and skew moving closer to neutral. The term structure remains in contango, with back-end IV holding firm in the 39–43% range.
- Flows show cautious upside interest, with traders adding risk reversals and cheap convexity while selling puts. This positioning reflects measured optimism aligned with seasonal “Uptober” dynamics.
- Dealer gamma exposure is balanced across both sides, muting hedging flows and helping dampen intraday volatility. With no large expiries ahead, the near-term backdrop remains stable and neutral.
Holding the Line
Bitcoin’s FOMC rally quickly reversed as profit-taking pushed prices down to $109k, slipping below the short-term holder cost basis at $111.6k. The decline was met with strong buy-side demand, driving a rebound toward $118.8k. This report explores key on-chain and options indicators to assess market dynamics and gauge prevailing expectations among speculative participants.
On-Chain Outlook
Holding the Line
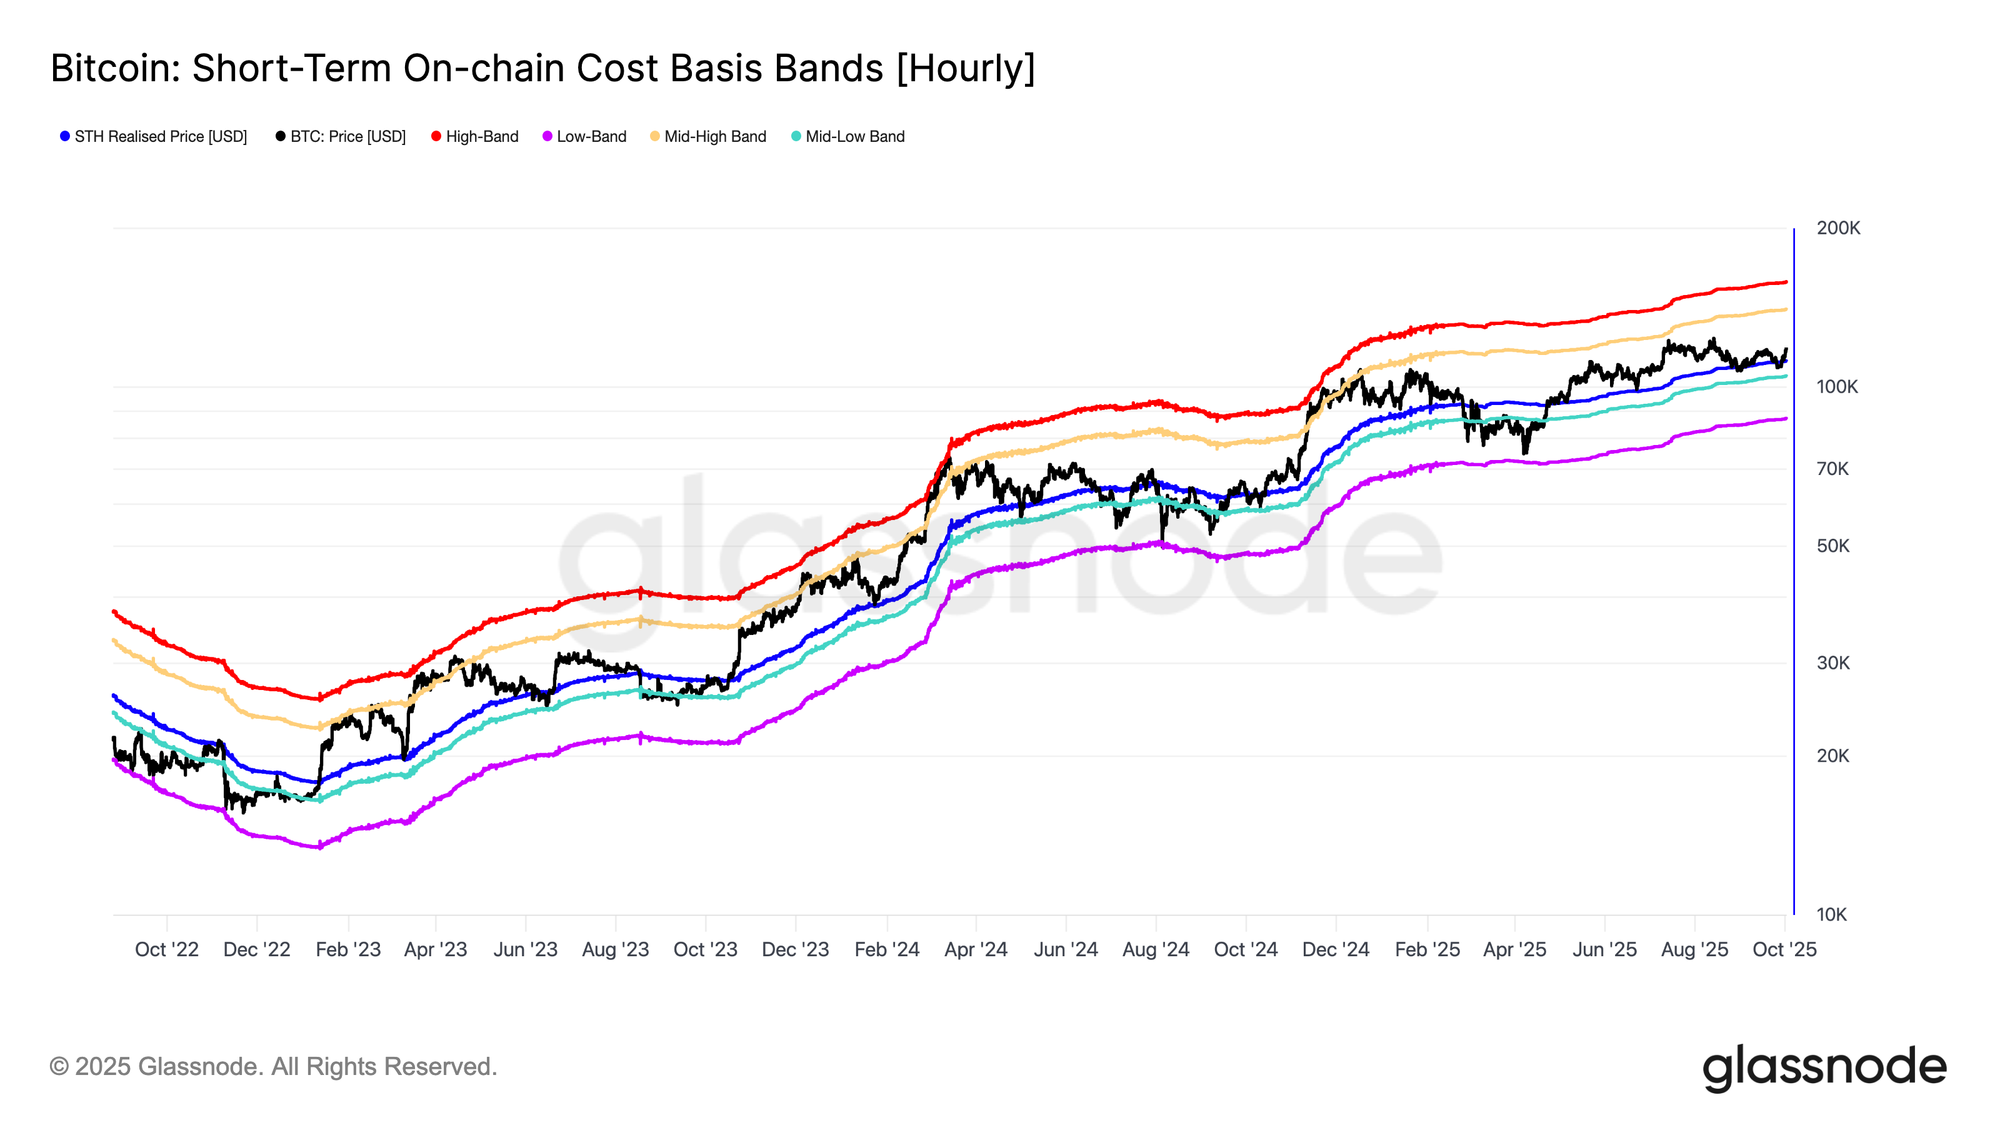
Building on this rebound, the short-term holder cost basis has once again emerged as a critical pivot. Since May 2025, this level has acted as support on five separate occasions, underscoring its role as a defining boundary between bullish and bearish regimes.
Each successful defense reinforces investor conviction and highlights the sensitivity of short-term capital to this threshold. Sustaining above this cost basis improves the odds of further upside, while it does not guarantee continuation.
Supply Overhang
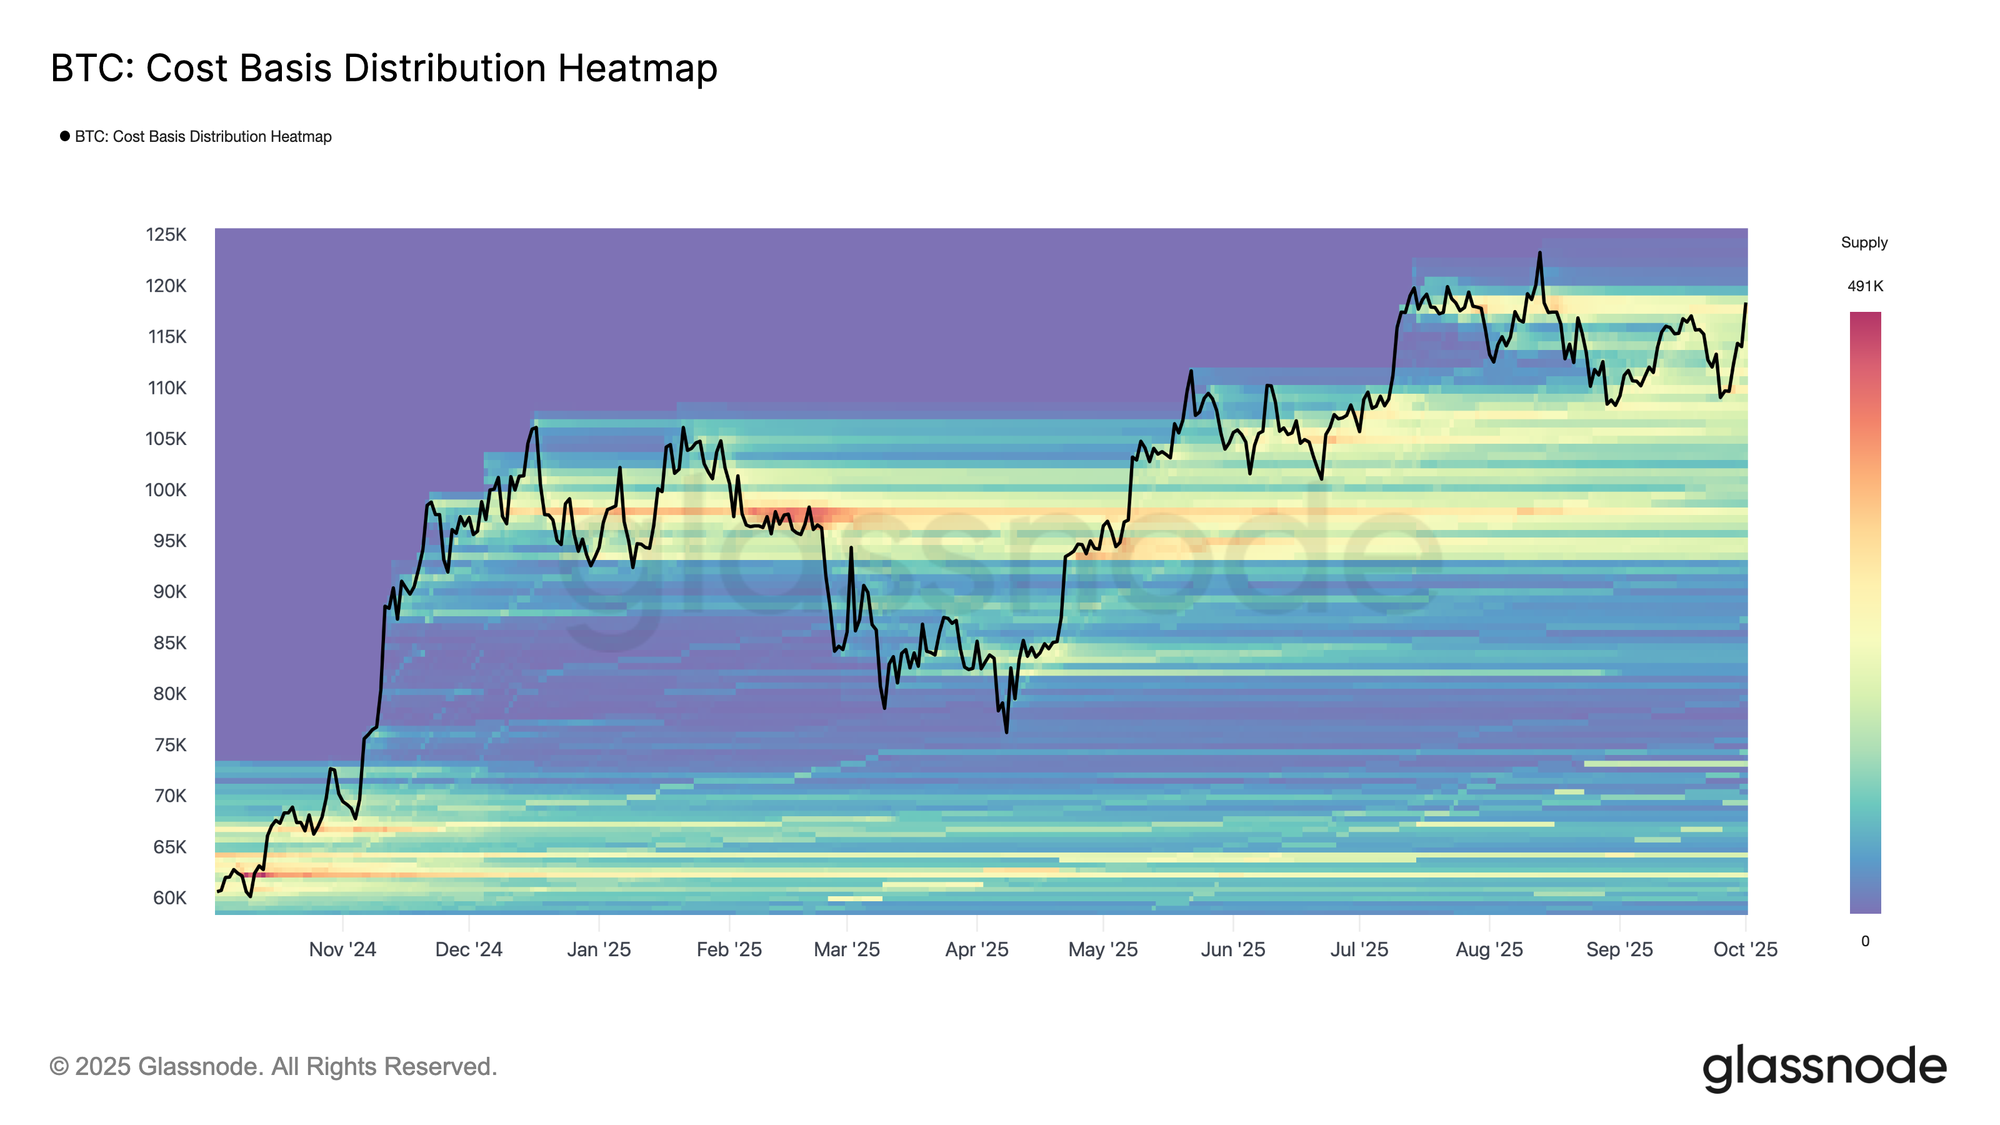
However, sustaining momentum requires clearing a significant hurdle. The recent bounce now faces a dense supply cluster accumulated between late August and the $114k–$118k range. Holders who bought near these highs may view the rebound as an opportunity to exit at break-even or modest profit, creating notable overhead resistance.
Overcoming this wave of sell pressure is crucial before the market can attempt another push toward new all-time highs. A decisive stabilization above $118k would signal that demand is absorbing the top-buyers’ supply, strengthening the case for further upside.
Cooling Payload
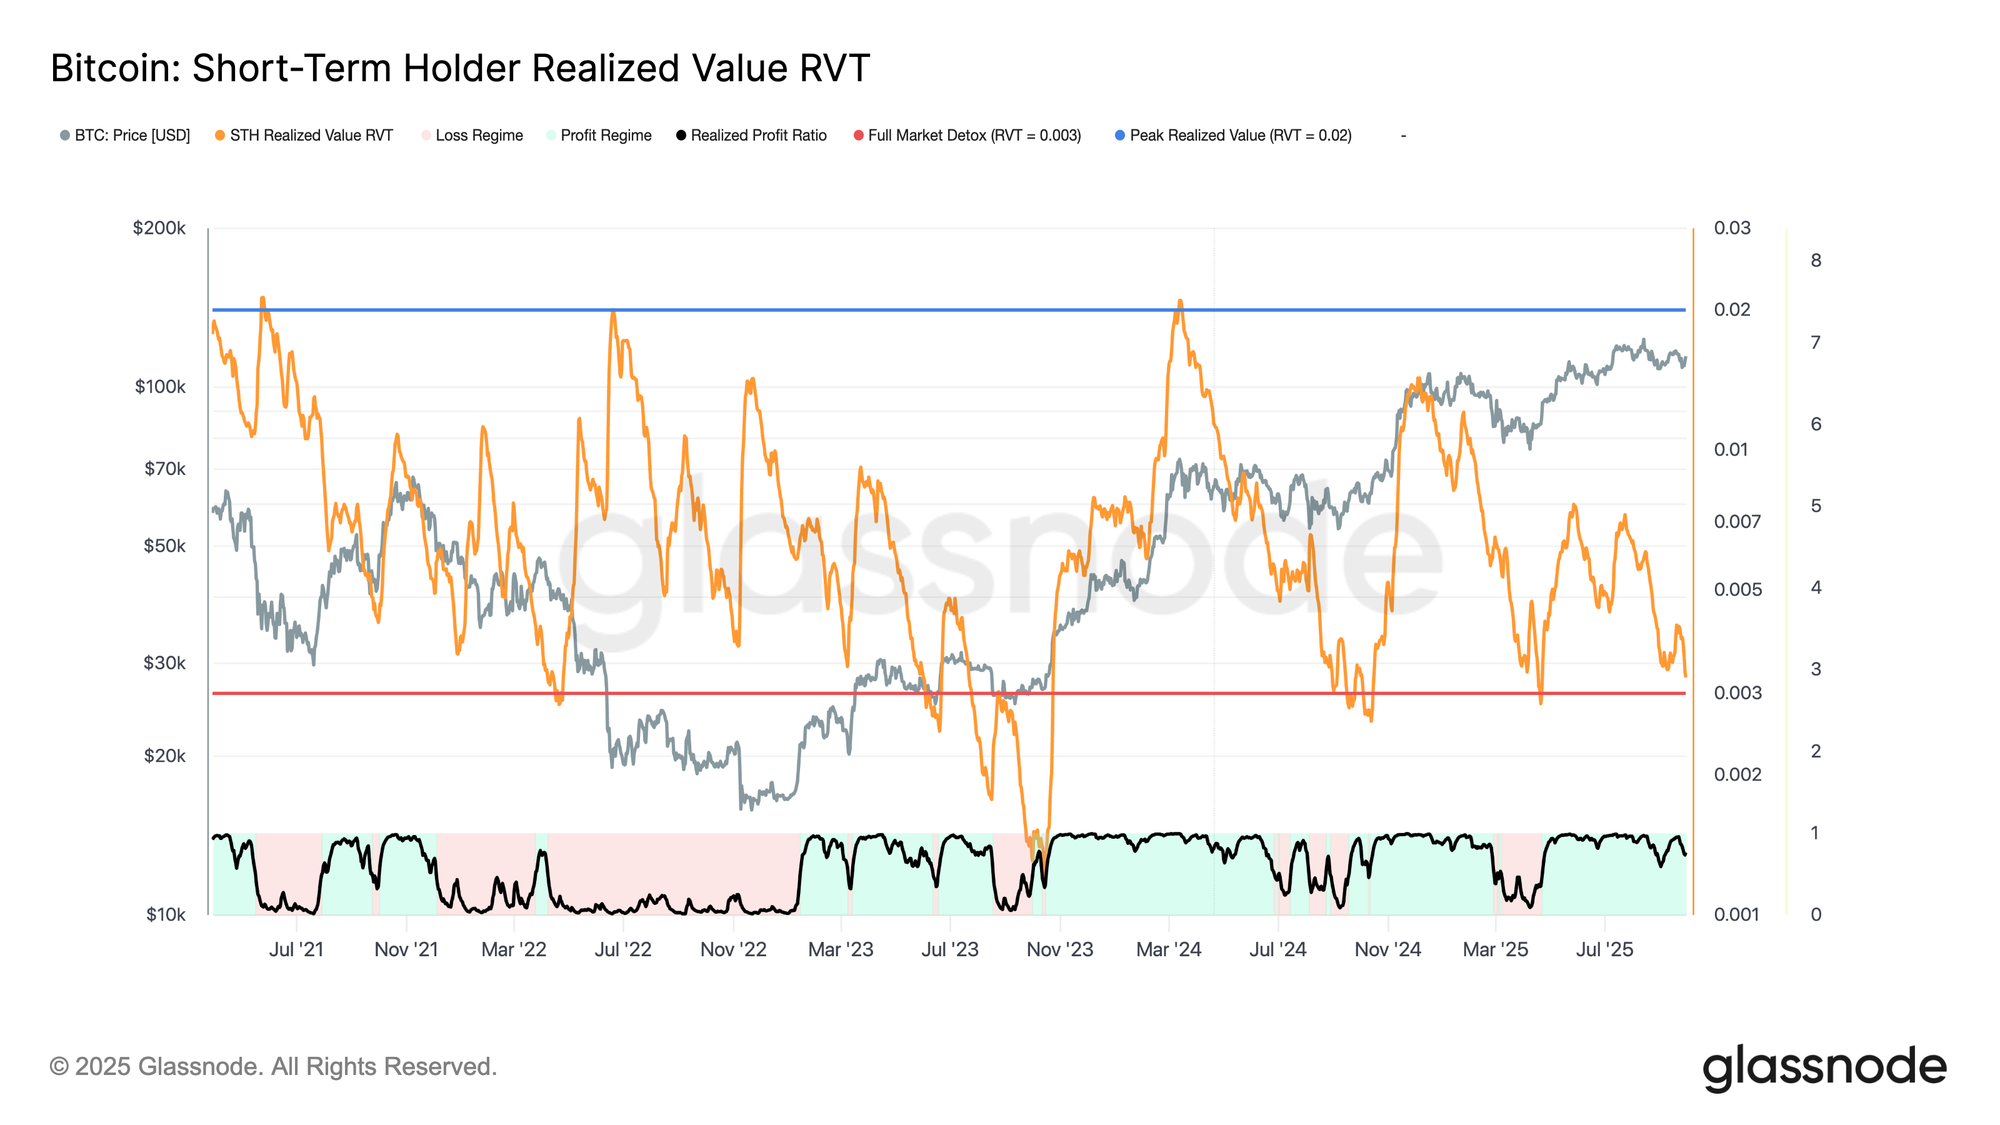
Despite price repeatedly finding support around the short-term holder cost basis, a longer-term trend is emerging beneath the surface. The Short-Term Holder Realized Value (RVT) ratio, which measures the economic value realized relative to the nominal value transferred, has steadily declined since May.
Elevated RVT values often indicate overheated markets, while contractions toward the “Full Market Detox” zone point to fading speculative excess.
At present, RVT is well below peak extremes, suggesting short-term holders are realizing fewer profits relative to overall network activity. Should RVT compress further and combine with capitulation signals, it could usher in an accumulation phase as investors wait for clearer market direction.
Fear or Disbelief?
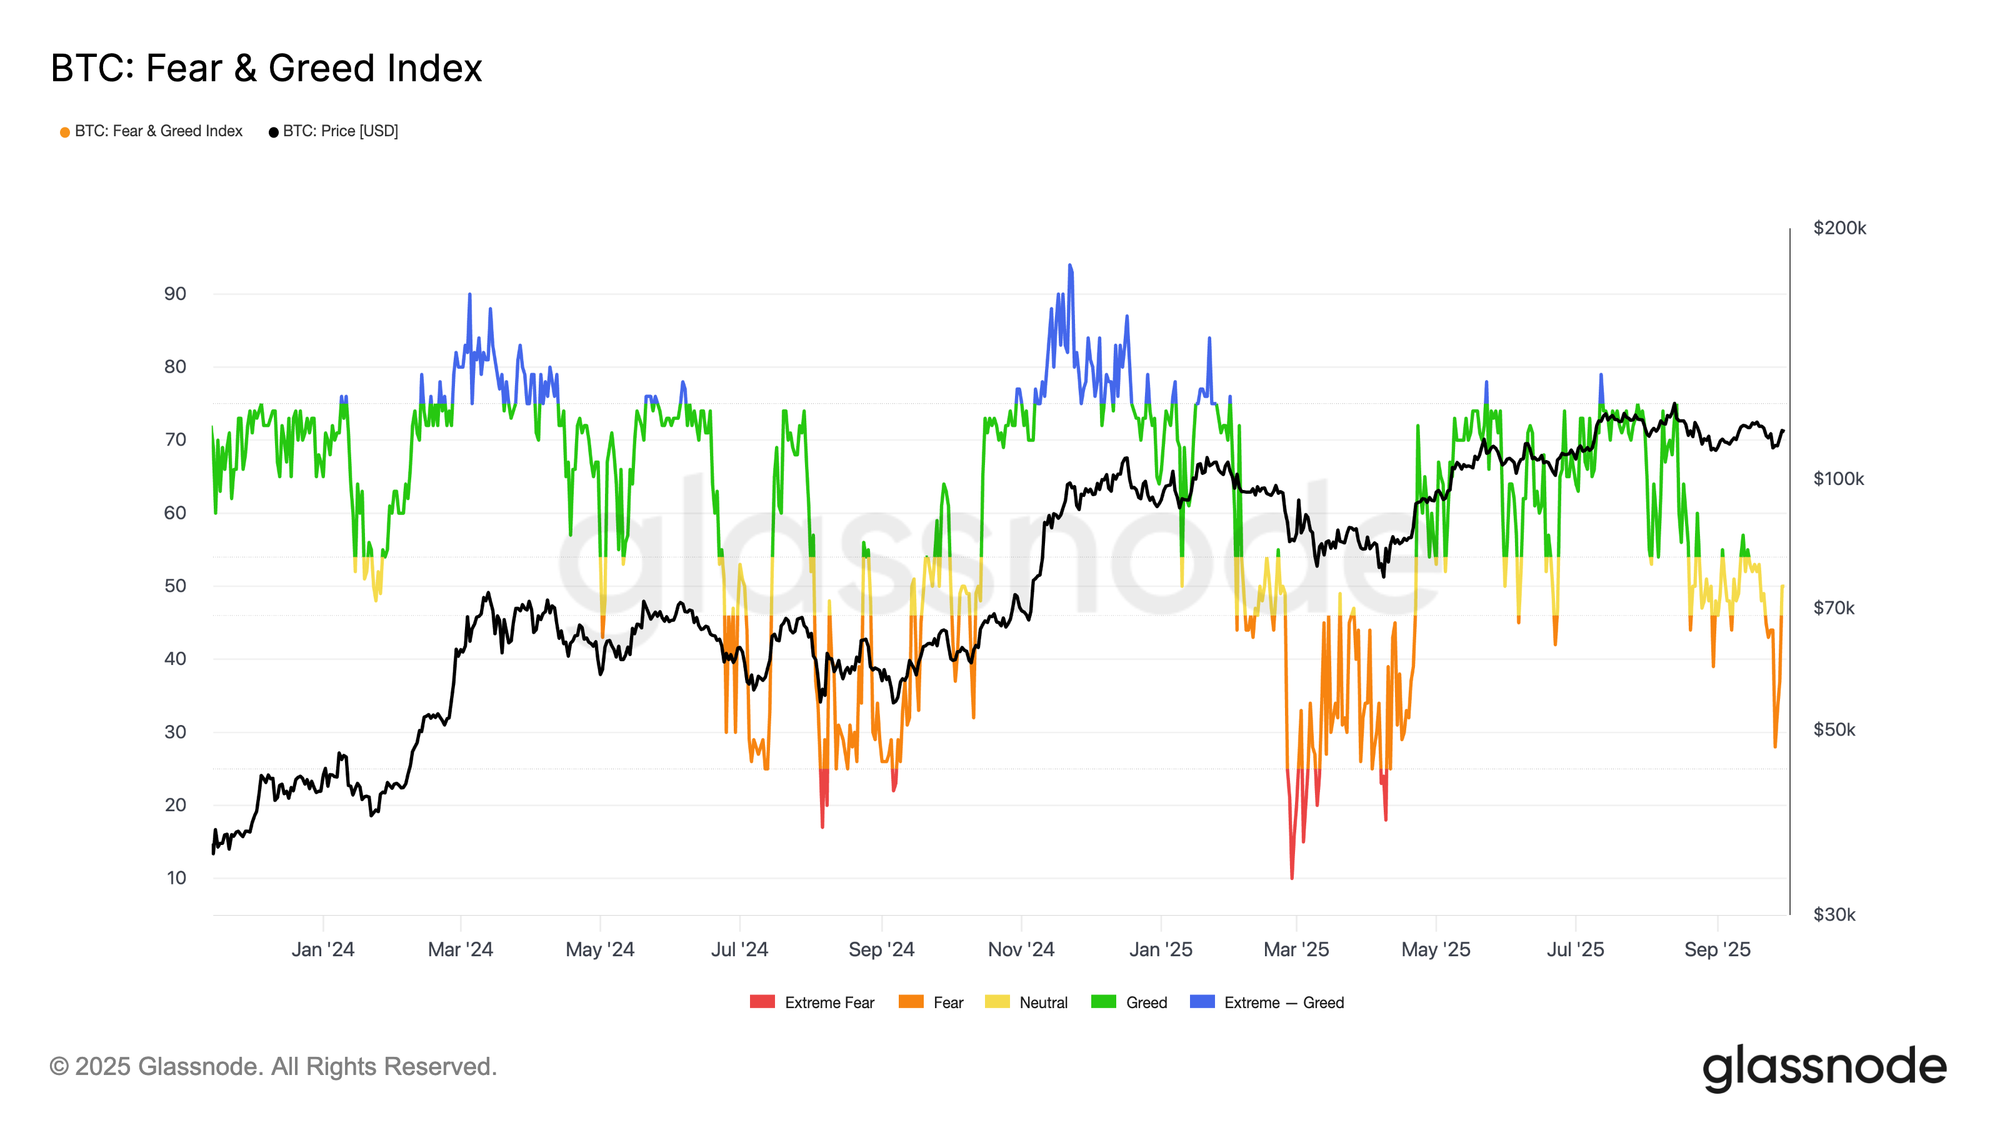
As the broader backdrop of cooling speculative activity unfolds, sentiment has followed suit. The Bitcoin Fear & Greed Index has shifted sharply lower, sliding from sustained Greed earlier this year into Fear and Neutral territory. This shift signals profit-taking, reduced risk appetite, and a more cautious stance among participants.
While sentiment resets can weigh on momentum in the short term, they also tend to clear excessive optimism and create conditions for healthier bases of support. Current readings point to a consolidation phase, with the market waiting for renewed conviction before committing to a decisive directional move.
LTH Supply Shift
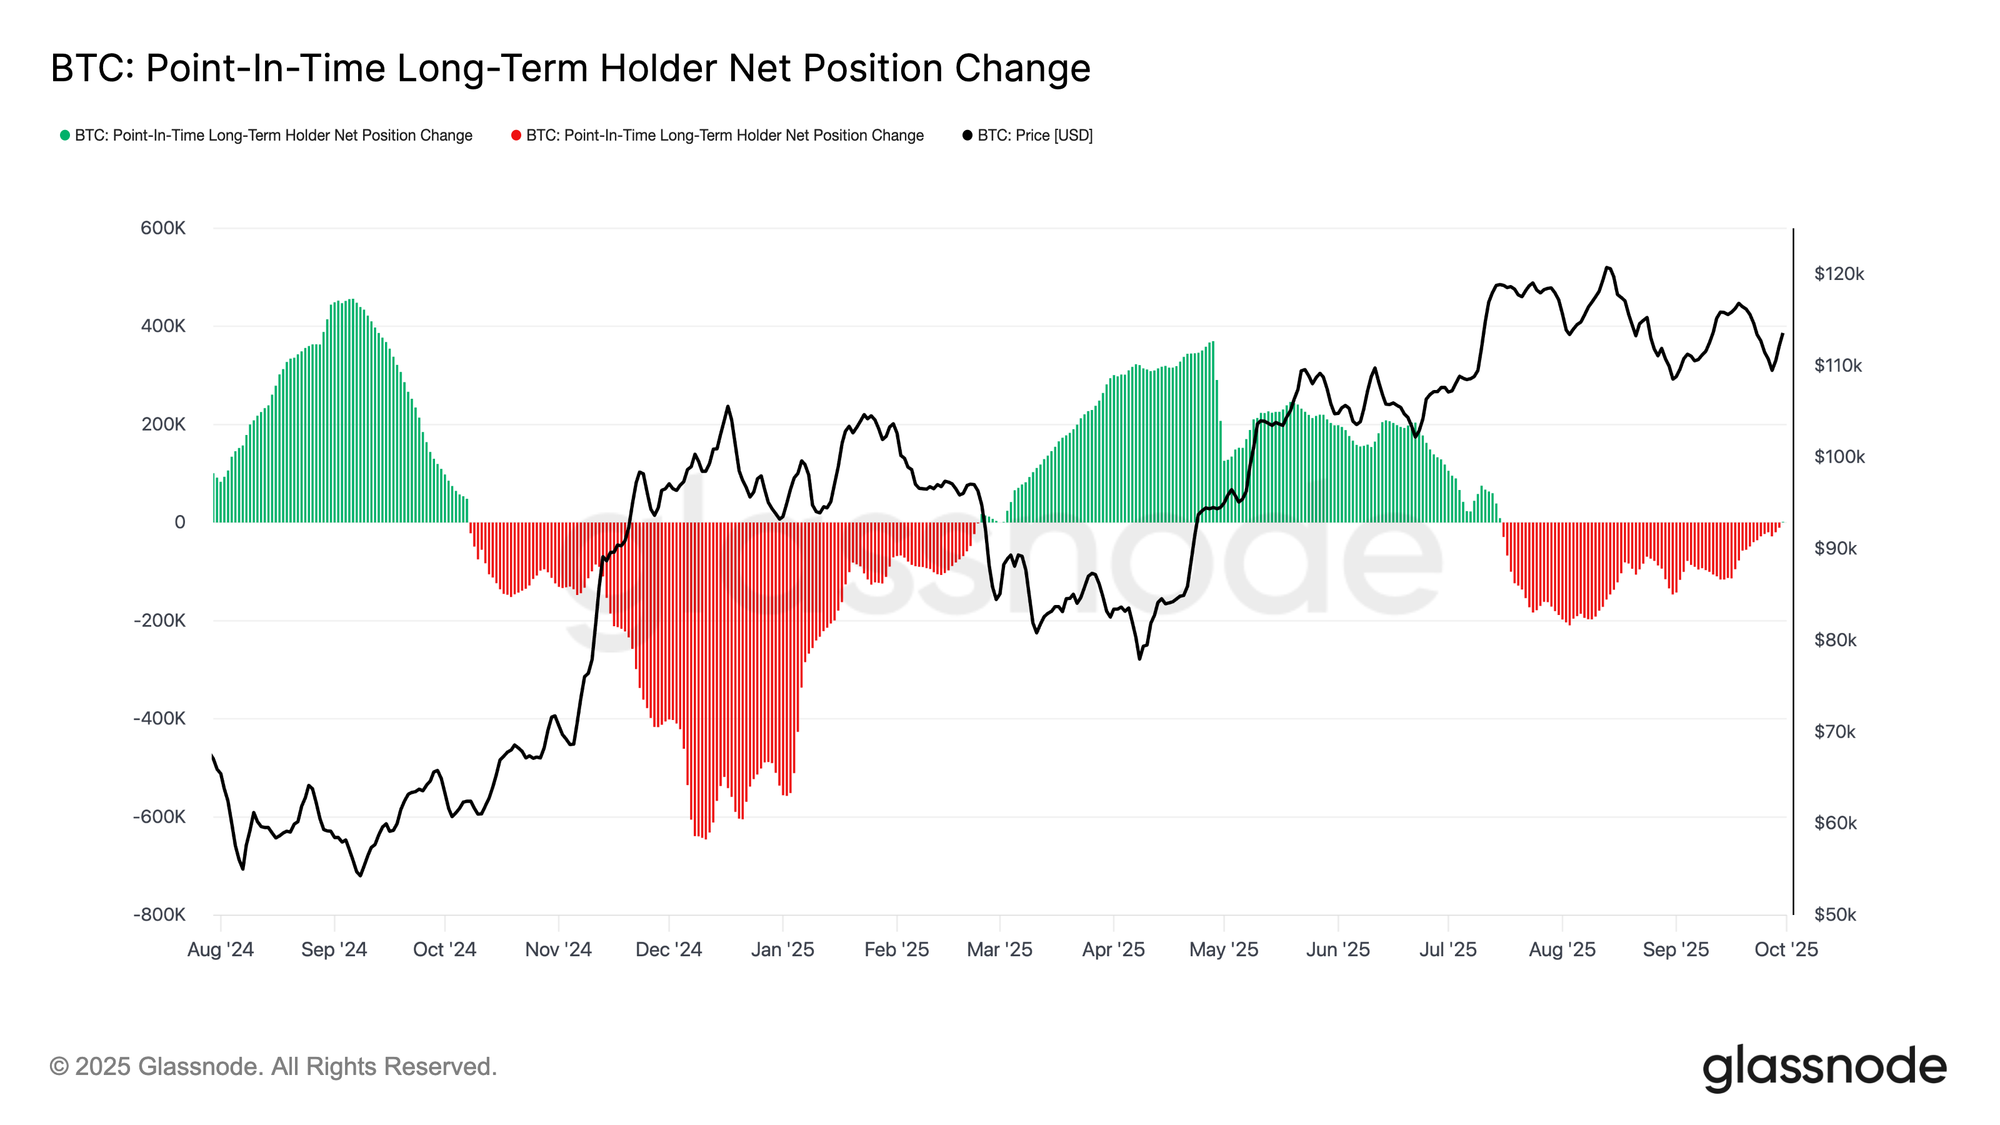
Alongside the overhead pressure from top buyers, the balance between Long-Term Holders (LTHs) and ETFs has shaped recent price action. Over the past several weeks, LTHs have acted as a core source of supply, locking in profits during rallies. However, the Long-Term Holders Net Position Change (3D) has now shifted toward neutral, signaling a slowdown in distribution after months of consistent selling. This cooling supply pressure suggests that the recent phase of long-term holder profit-taking may be easing, potentially leaving ETFs and new inflows as more decisive drivers of market direction.
ETF Flows Steadying
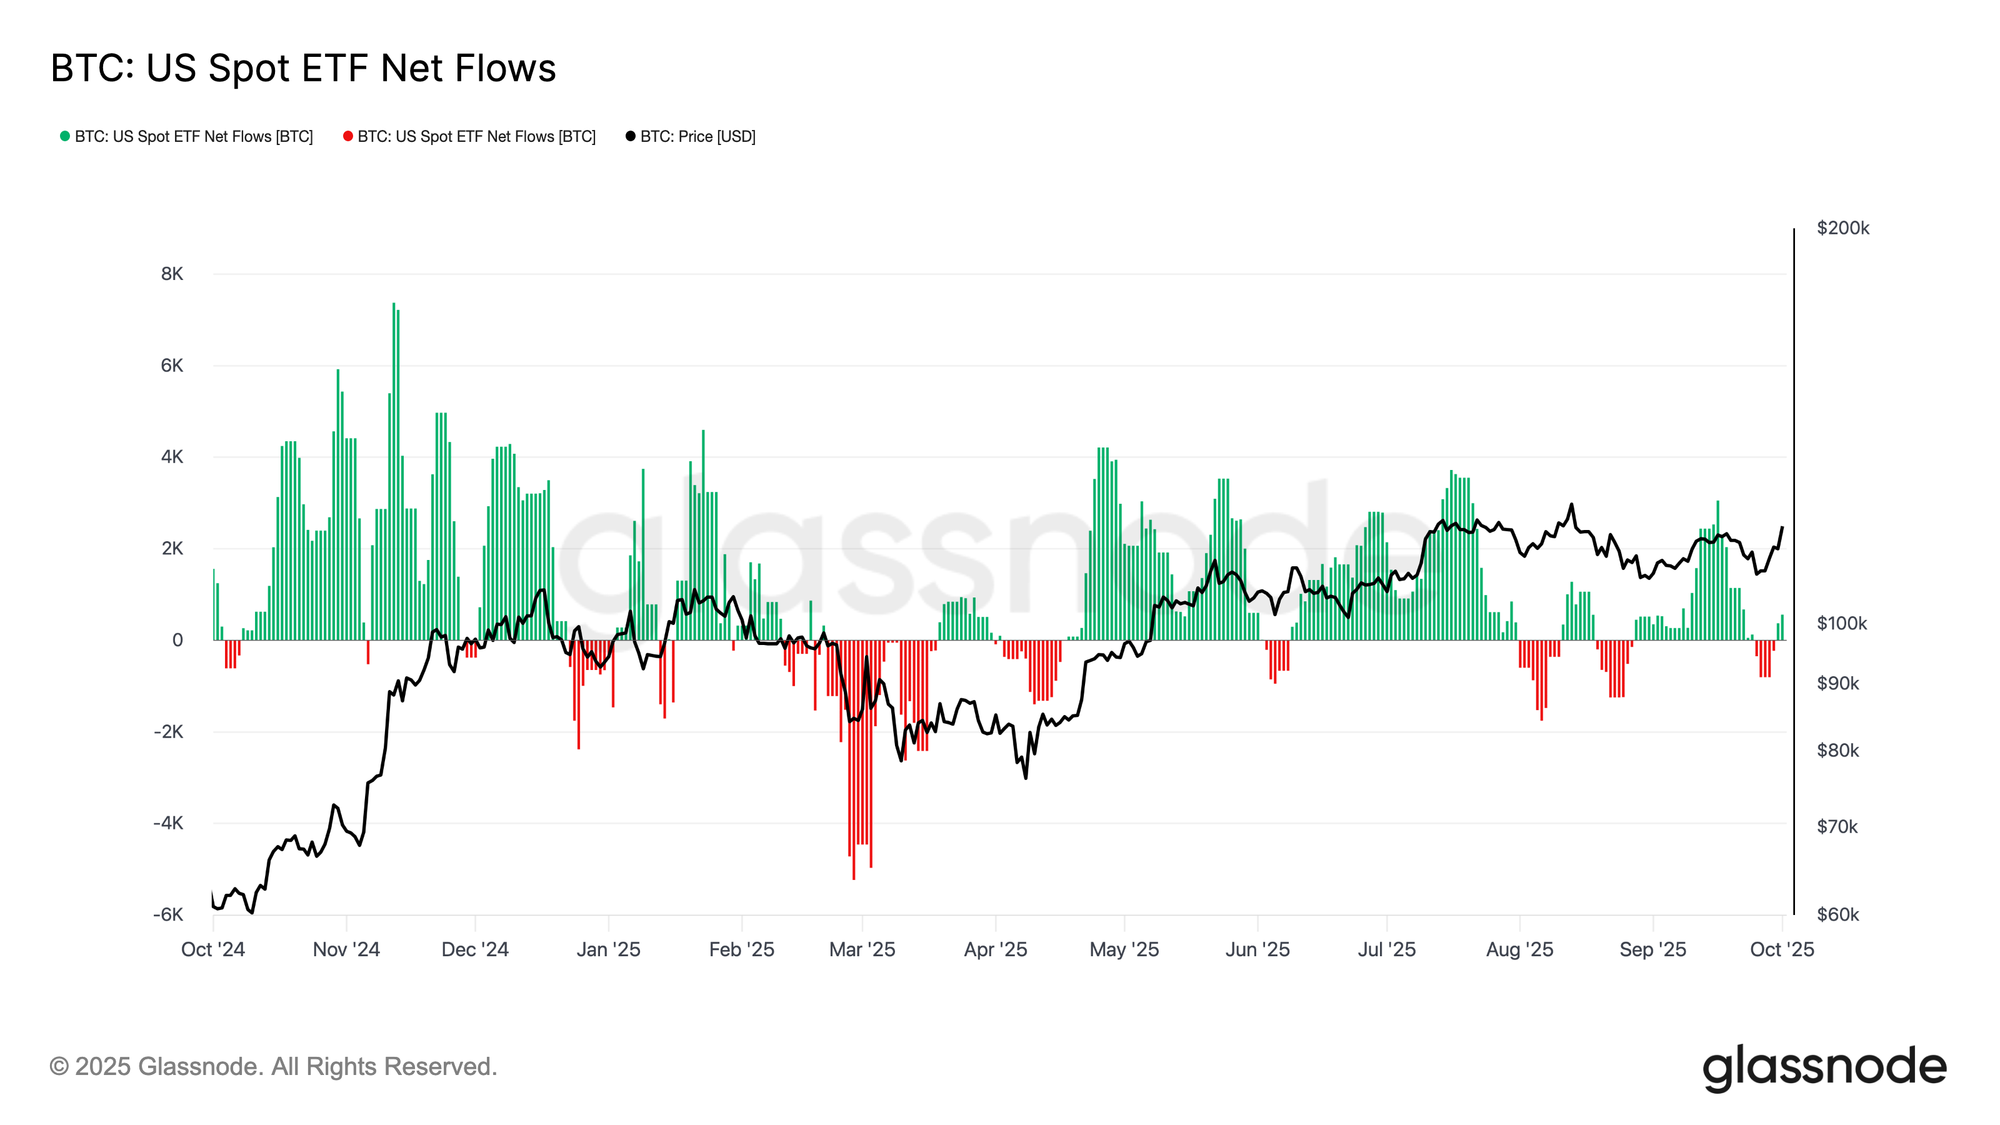
Complementing the slowdown in long-term holder distribution, US Spot Bitcoin ETFs remain a central force in market structure. Flows have been volatile in recent months, with mid-September’s strong inflows followed by a string of outflow sessions.
The most recent data, however, point to a return of net inflows, underscoring that institutional appetite remains intact despite ongoing profit rotation. Should this renewed demand align with reduced LTH selling, ETFs could provide a stabilizing force, offering a more constructive foundation for price resilience and supporting the conditions needed for a sustainable advance.
Options Market Outlook
Next, our focus shifts from on-chain signals to the options market for deeper context. Following last week’s record expiry, open interest has sharply reset and is now rebuilding into Q4. In this report, we examine positioning, volatility, and flows to evaluate how options traders are shaping expectations for Bitcoin’s next phase.
Post-Expiry Reset
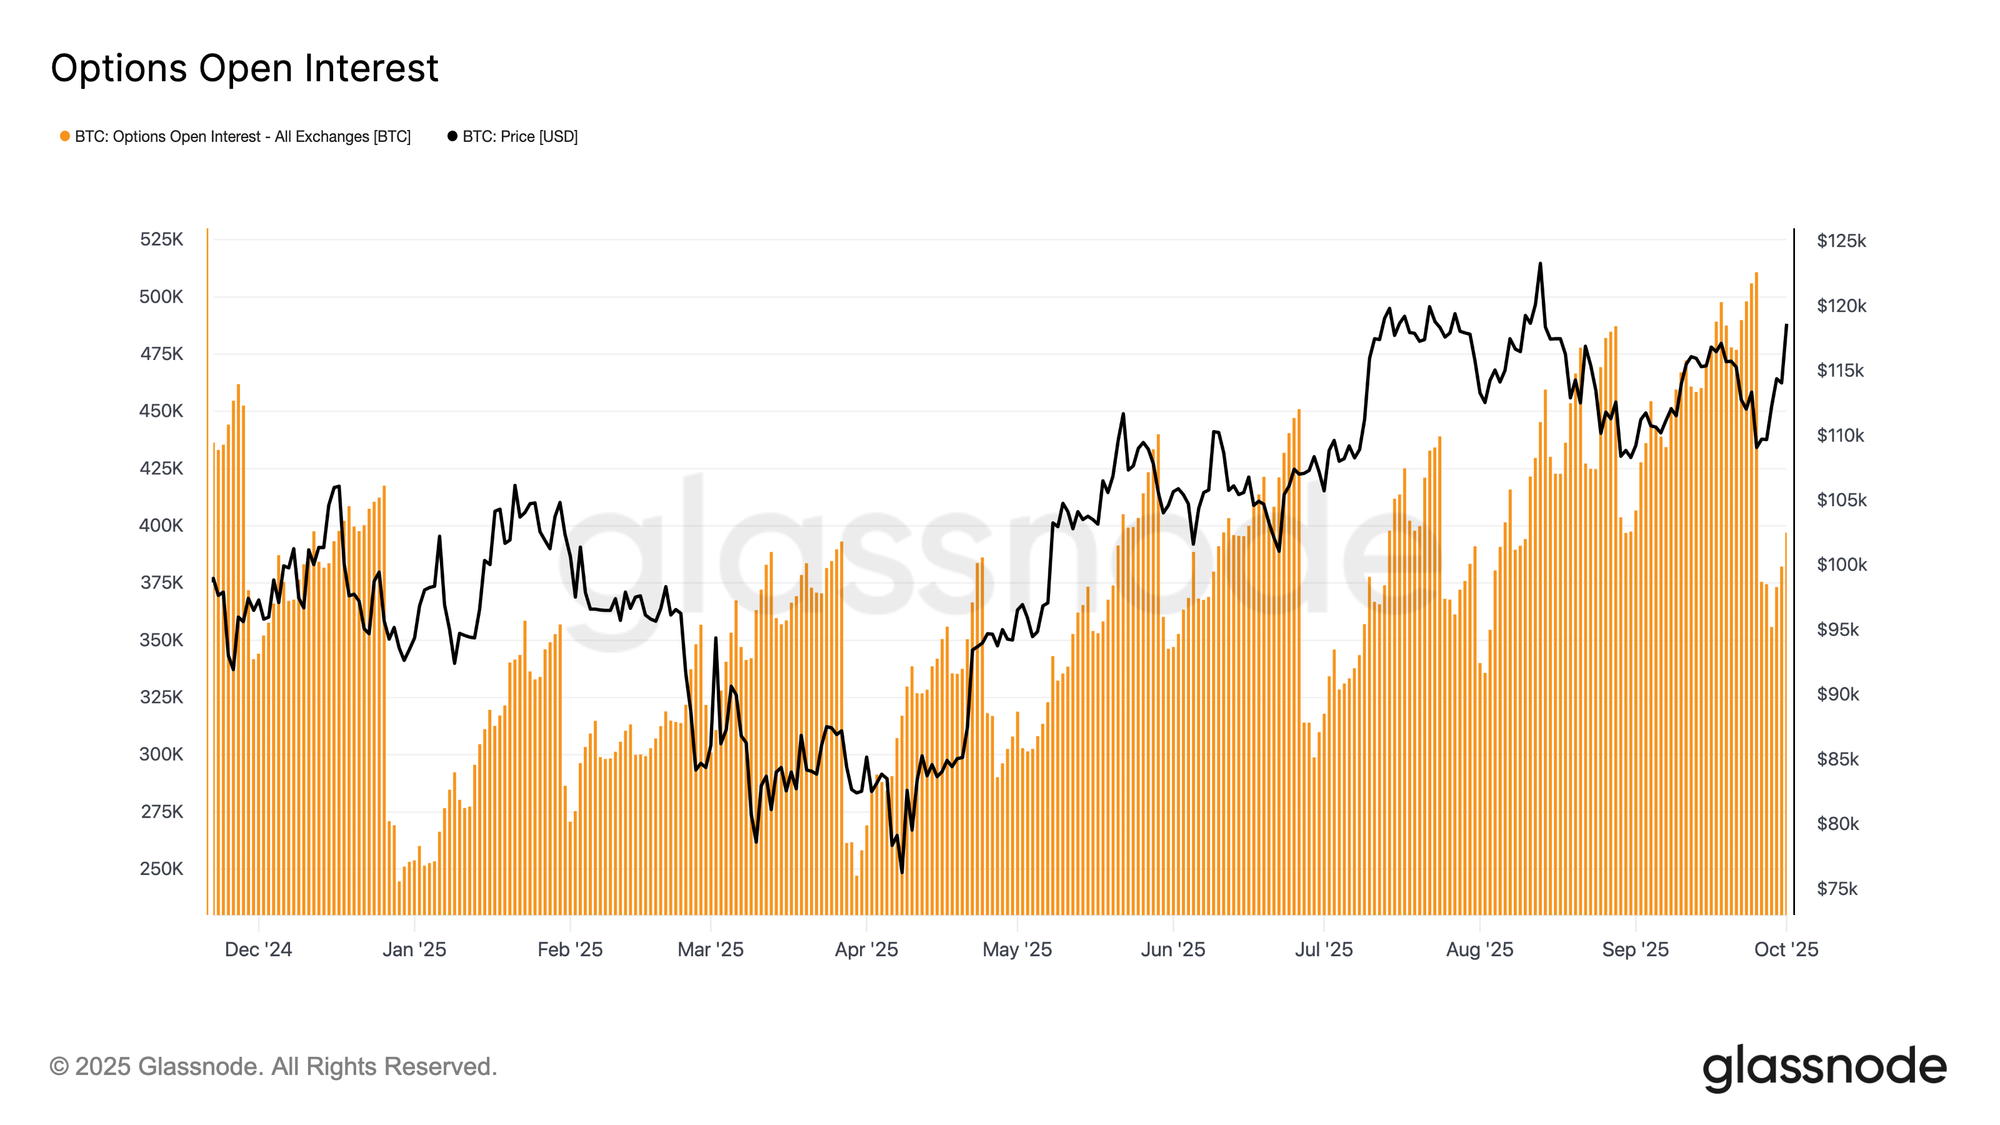
As of 08:00 UTC, Wednesday 1 October, Bitcoin has digested its largest options expiry on record, triggering a sharp reduction in open interest across expiries and strikes. This mechanical reset removes hedging-driven noise and leaves the market clearer for new positioning into Q4. Historically, major expiries often underpin price action, with the subsequent rebuild in OI reflecting more deliberate views on direction and volatility.
The current phase, therefore, marks a cleaner ground for assessing how traders are positioning into the next leg of the cycle.
Volatility Landscape
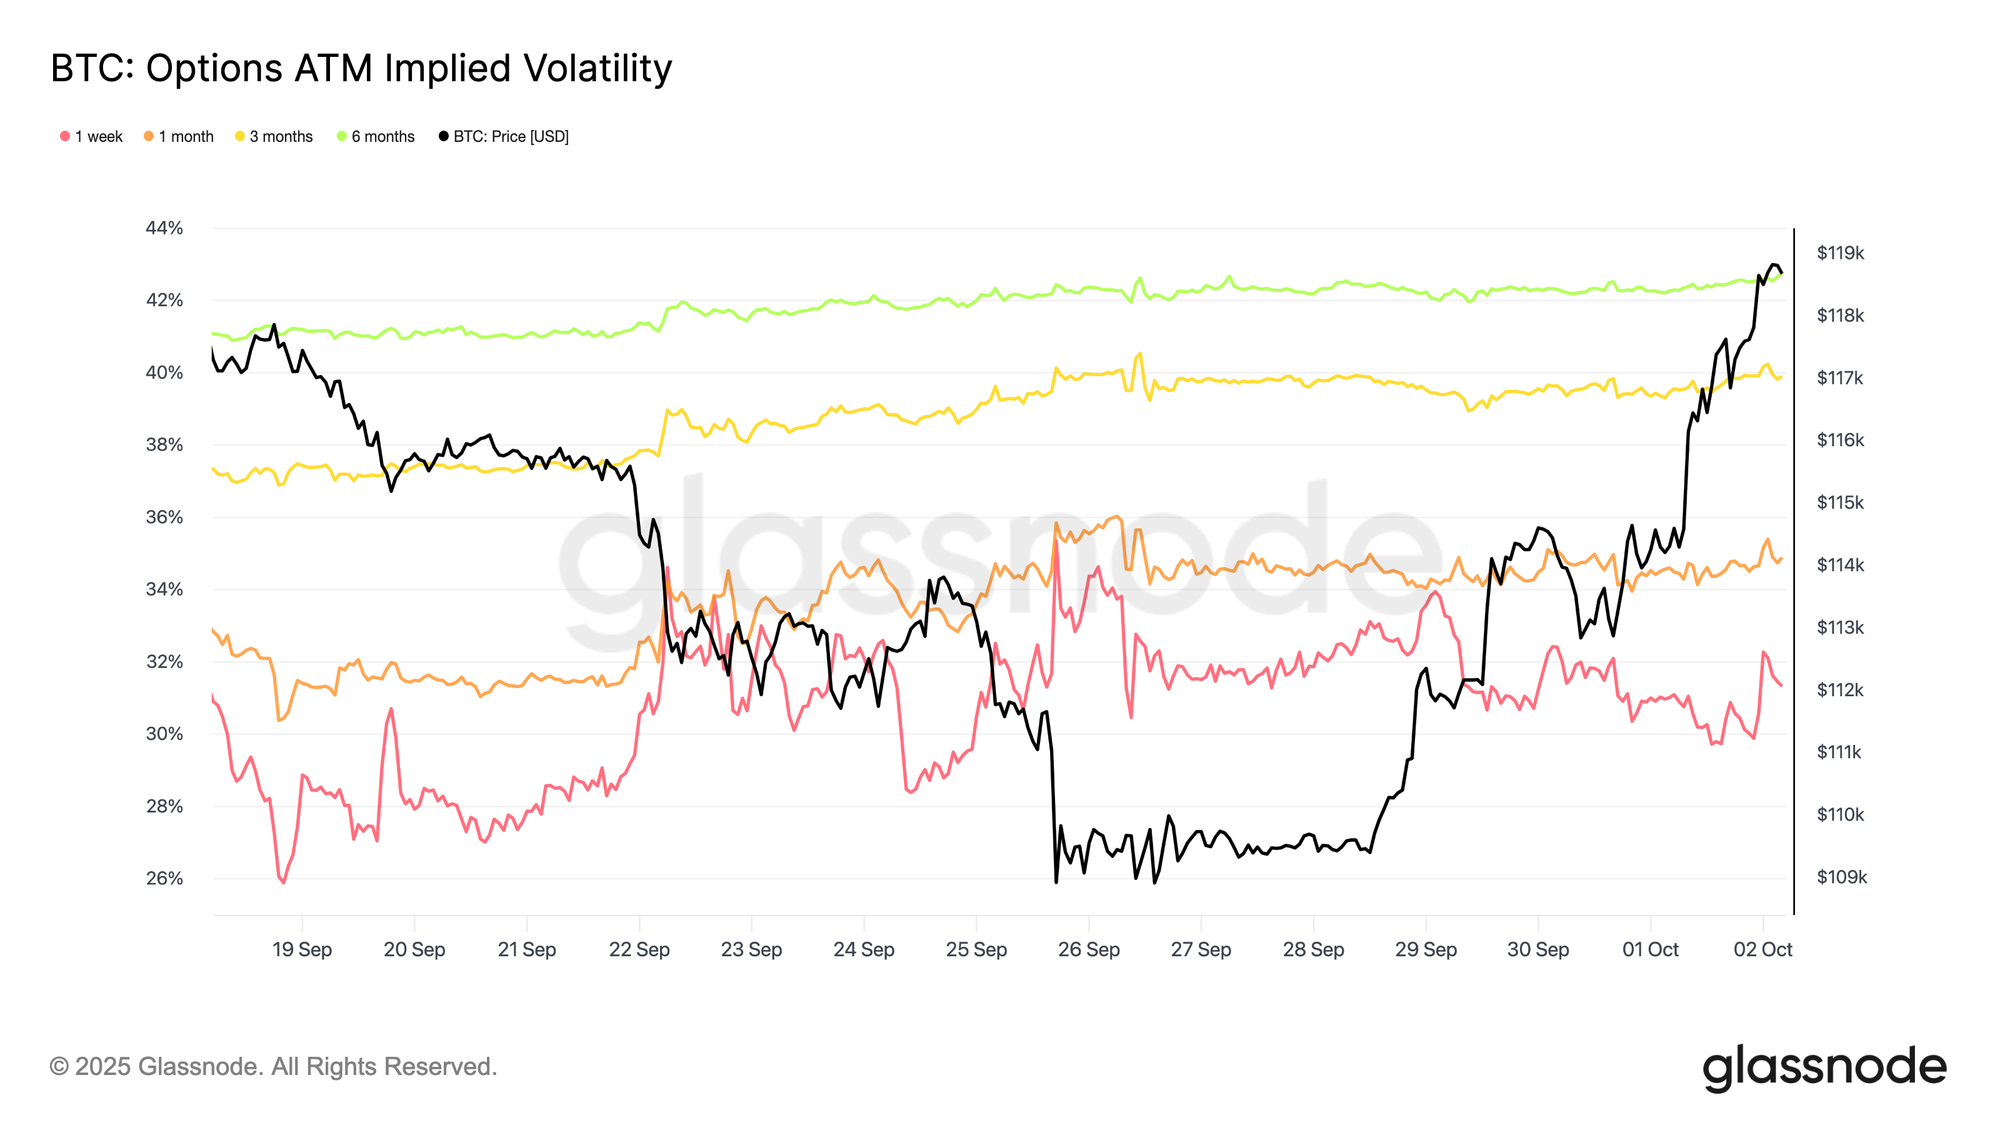
Following the reset in open interest, attention shifts to the volatility surface, where short-dated premiums have eased. One-week at-the-money implied volatility fell by nearly 5%points from last week’s highs, while the two-week tenor declined by about 2%. In contrast, longer-dated maturities held steady or edged slightly higher, leaving the curve steeper overall. This structure reflects a market where near-term stress has faded, yet caution persists further out the curve.
Despite the front-end retreat, implied volatility remains elevated relative to realized, keeping carry trades positive, though less compelling than a week earlier. The term structure remains in contango, with short-dated contracts anchored around 30% IV, while three-month and longer maturities hold between 39% and 43%. The steepening highlights a shift from short-term risk hedging to more measured, longer-dated caution.
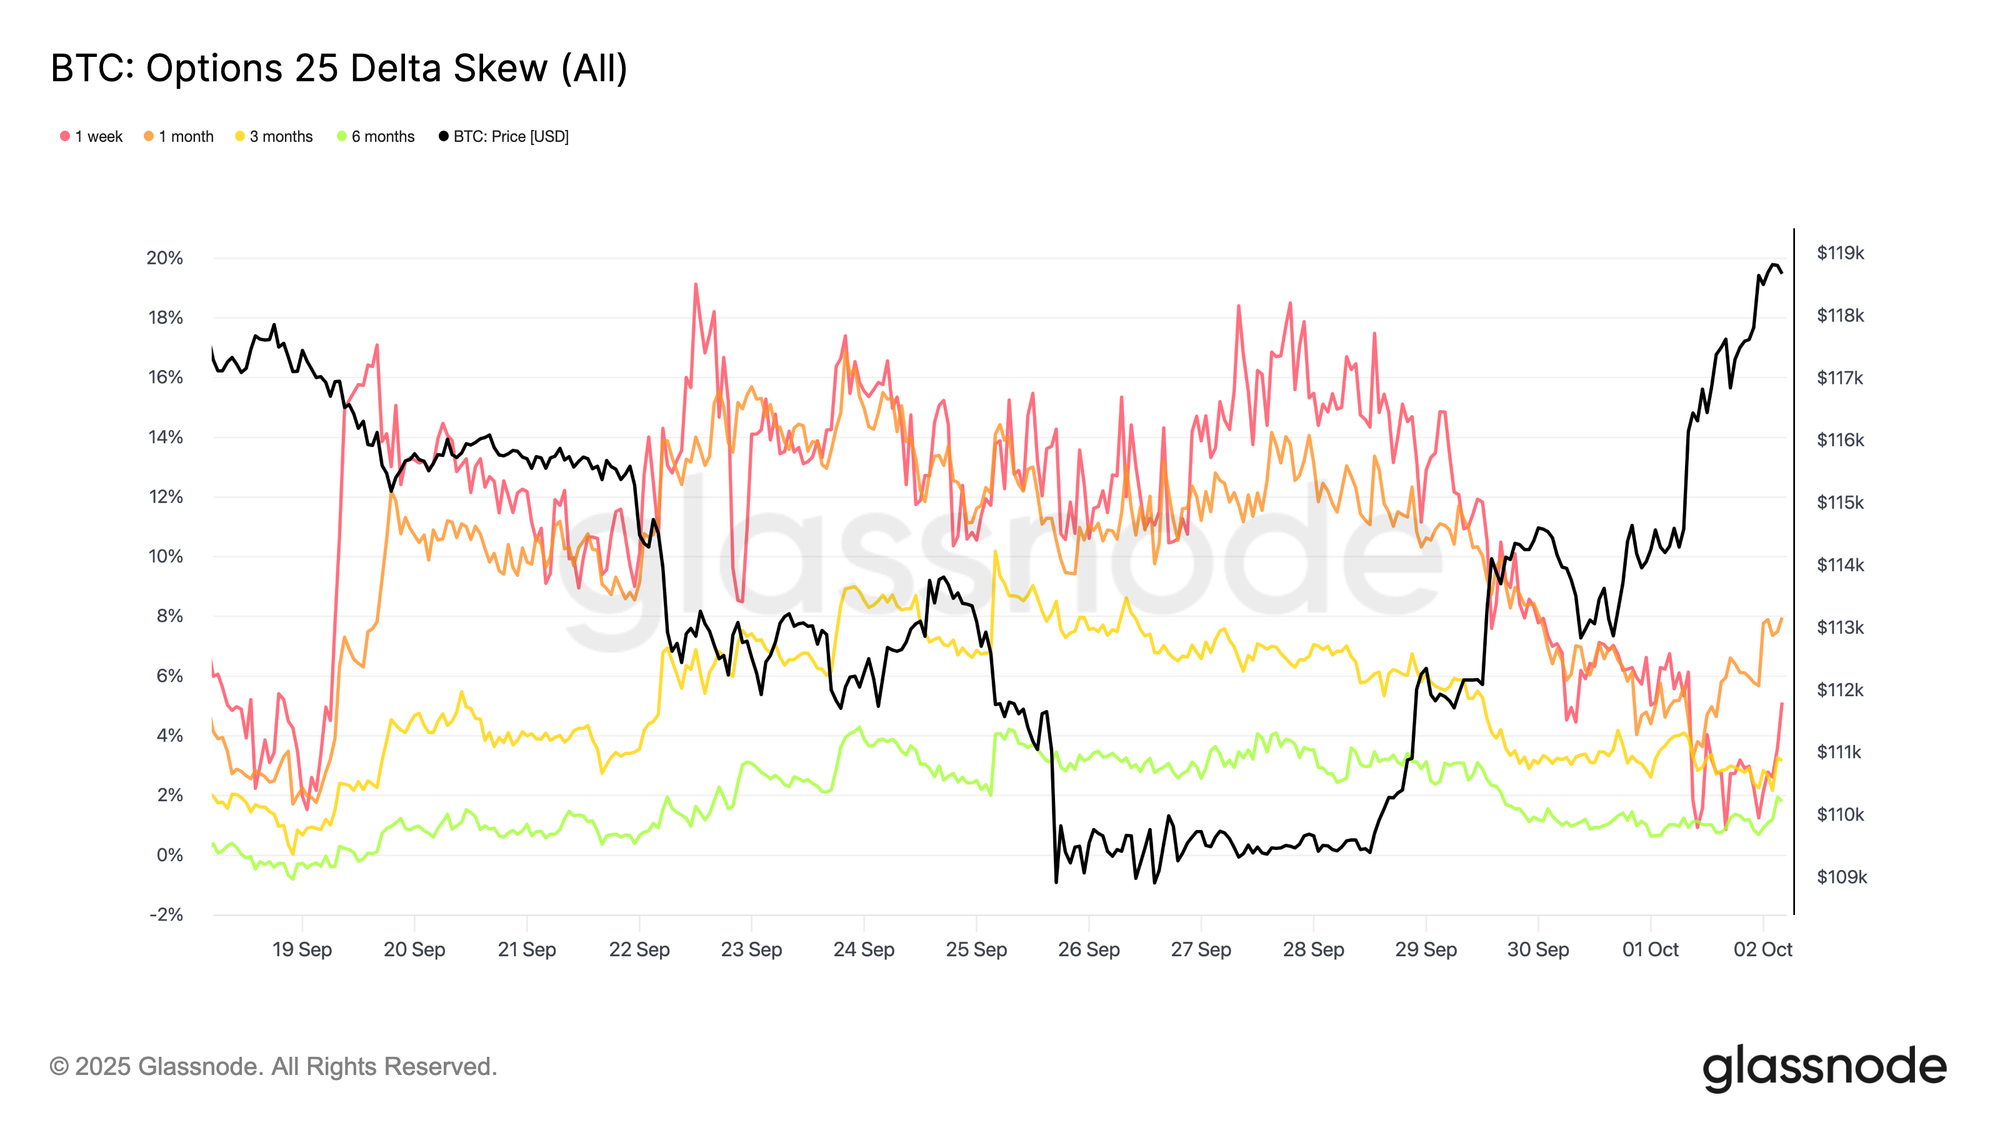
Skew Nears Neutral
Building on the softer front-end volatility, option skew has also moderated. The 25-Delta Risk Reversal in one-week contracts fell sharply from roughly 18.5 vol points to around 6 vol points, marking a significant move away from downside protection toward balance. Longer maturities have also flattened, drifting closer to neutral territory. This adjustment reflects cooling demand for puts as immediate downside stress eases, while call premiums begin to catch up. Together, the shift signals a more balanced risk outlook, where traders are less focused on hedging tail risk and more willing to express directional upside.
Flows: Upside Interest Returns
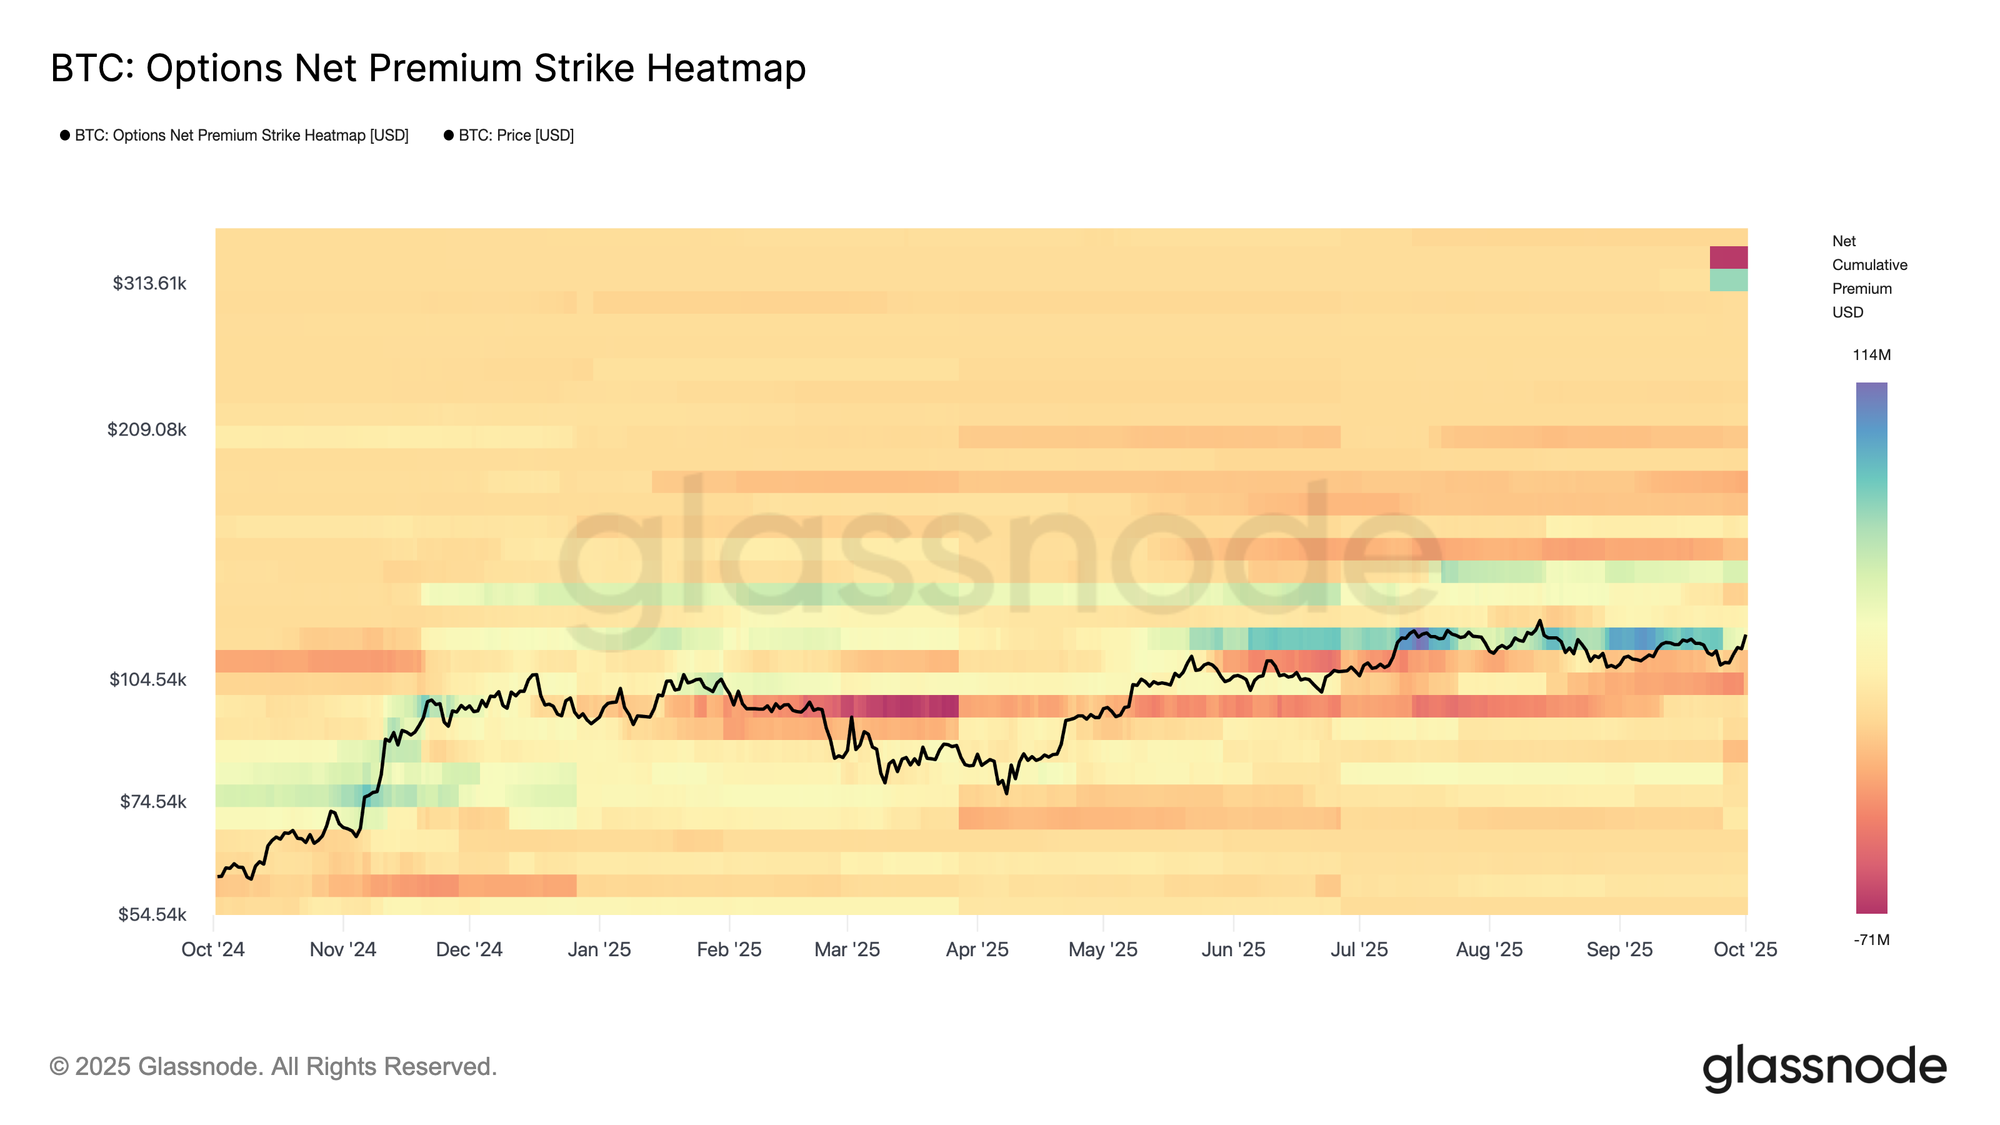
With skew moving toward neutral, positioning has shifted toward the call side. Traders have been lifting upside calls in line with the typical Q4 seasonal bias, with net call premium concentrated in the $136k–$145k range. Higher strikes, however, saw call selling, suggesting the market is not chasing extreme upside but instead using structure to capture cheap convexity.
Flows also show a preference for strategies that monetize skew while retaining optionality into year-end catalysts. Put selling has picked up as well, consistent with the skew compression noted earlier. Overall, traders appear to have used last week’s pullback to add risk reversals—selling puts and buying calls—positioning for Q4 optionality and the seasonal “Uptober” narrative.
Dealer Gamma: Neutral Backdrop
Dealer positioning remains quiet following the record expiry. With open interest normalized back to average levels, the calendar shows no major expiries in the near term. Since gamma effects are most pronounced at-the-money and close to maturity, the absence of large clusters reduces the likelihood of significant dealer-driven hedging flows.
Current positioning is broadly long gamma on both downside and upside strikes, which helps dampen intraday volatility and stabilize spot around prevailing levels. However, these exposures are modest and remain far from any meaningful expiry points, leaving the options market in a neutral state until new positioning builds closer to upcoming dates.
Conclusion
On-chain dynamics continue to highlight the pivotal role of the short-term holder cost basis, which has served as reliable support since May 2025. Price remains challenged by the dense supply cluster between $114k and $118k, yet the easing in long-term holder distribution and the return of ETF inflows suggest stabilizing demand. Sentiment, as measured by RVT and the Fear & Greed Index, points to a cooling phase, with conditions shifting toward consolidation rather than capitulation.
In the options market, the record expiry has reset positioning, with open interest now rebuilding into Q4. Volatility has softened, skew is drifting toward neutral, and the curve remains in contango with a firmer back end. Flows show measured upside interest, while dealer gamma remains broadly balanced, muting hedging flows. Together, these signals suggest a market resetting into a more neutral, constructive backdrop, awaiting conviction for the next decisive move.