The cryptocurrency market records a strong bullish reversal this week with major tokens successfully breaking out of their key resistance trend levels. Moreover, with the border market gaining traction, investors are curious if the crypto-verse could continue trading under a positive influence during the upcoming week.
Notably, the crypto-space has recorded a liquidation of over $313.48 million over the past 24 hours. Ethereum crypto recorded the highest liquidations with $27.29 million in long positions and $91.19 million in short positions, followed by Bitcoin with $8.79 million in long and $23.62 million in short positions.
Considering the present market sentiments, will Bitcoin, Ethereum, & XRP cryptocurrencies maintain a bullish momentum or is a correction imminent?
Bitcoin Eyes $120,000 Next Week?
As the market turns positive, the Bitcoin price reclaims its $116k mark and records a 24H high of $117,689. The BTC crypto had formed a consolidating trend for a period, following which it recorded a retest around the $112,000 mark. However, since then, the price is on a constant rise.
Moreover, with a market capitalization of $2.31 trillion, it has maintained its dominance at 60.0607% and is presently trading at a discount of only 6% ($6,871) from its ATH of $123,091.61.
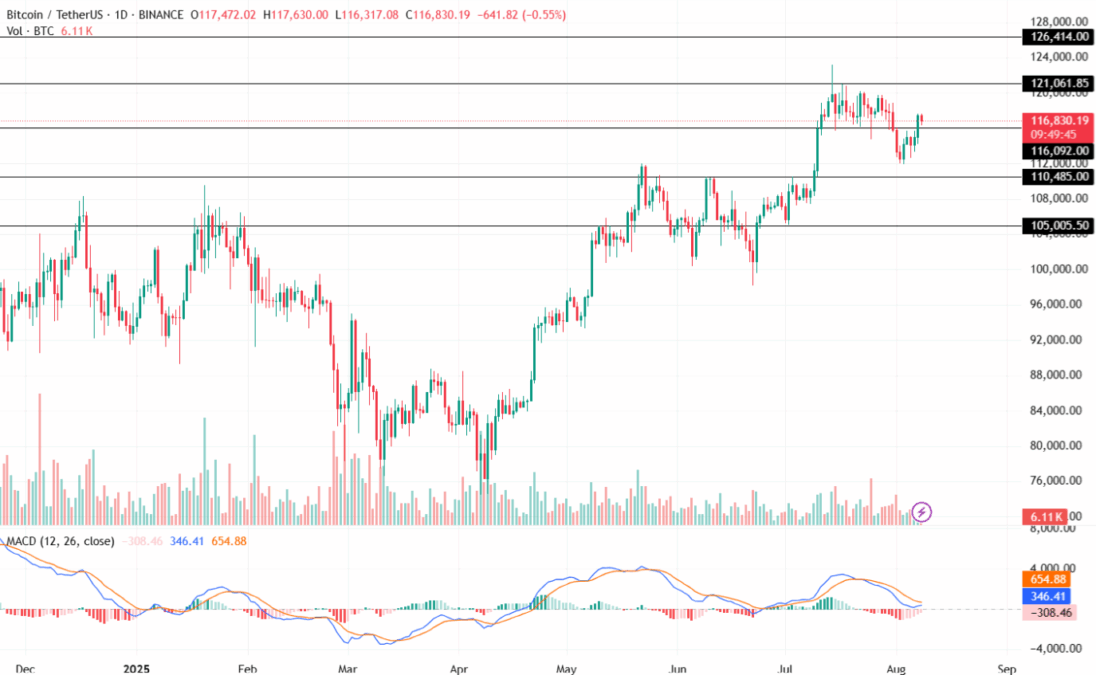
The Moving Average Convergence Divergence (MACD) indicator in the daily chart reveals a constant decline in the red histogram, suggesting an increase in the buying pressure. With its averages on the verge of a Golden Cross, the BTC price shows signs of a positive outlook.
By evaluating the press market sentiments, the Bitcoin price could retest its immediate resistance of $117,500 or its upper target of $120,000. Conversely, key support levels stand at $115,000 with its lower support trendline holding at $110,485.
Ethereum Price Retests $4,000 Today
Just as marketers were losing hope on Ethereum as it was on the verge of breaking its crucial support of $3,388 mark, the largest altcoin made an impressive comeback. Within just 6 trading days, the ETH coin price has added over 9% to its portfolio, making it one of the best trading weeks since early July.
At the time of writing, the value of ETH token was $3,983 with a high of $4,011. With this, its market share has increased to $474.35 billion.
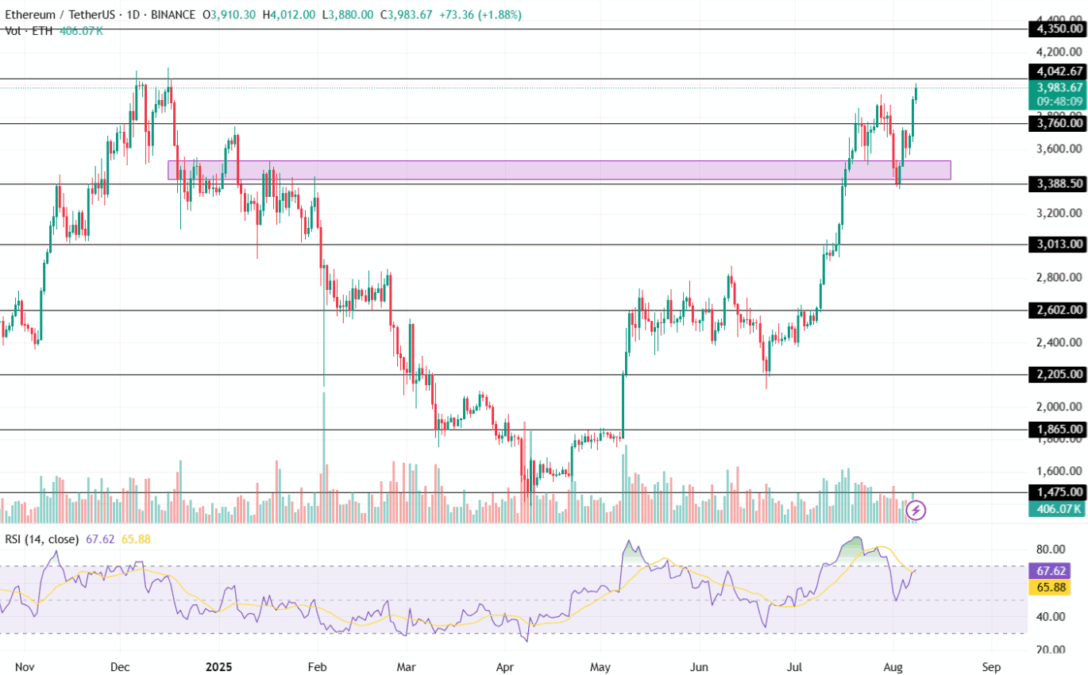
The Relative Strength Index (RSI) is currently at 67.62, suggesting a rising positive trading activity in the market. Additionally, the volume indicator shows considerable volatility, supporting the bullish angle for the altcoin.
Suppose, the ETH price maintains its value, this could push it toward its immediate resistance of $4,042. A sustained positive action may push its value toward its upper high of $4,350. On the flip side, a reversal may result in it testing its low of $3,850 or $3,760 respectively.
XRP Price Soars Over 13% This Week!
The XRP price is back under the limelight with its bullish price action this week. After successfully retesting its $3 mark, Ripple’s XRP crypto has added over 10% to its valuation in just 72 hours. This has resulted in its market share rising to $191.135 billion with a dominance of 4.9779%.
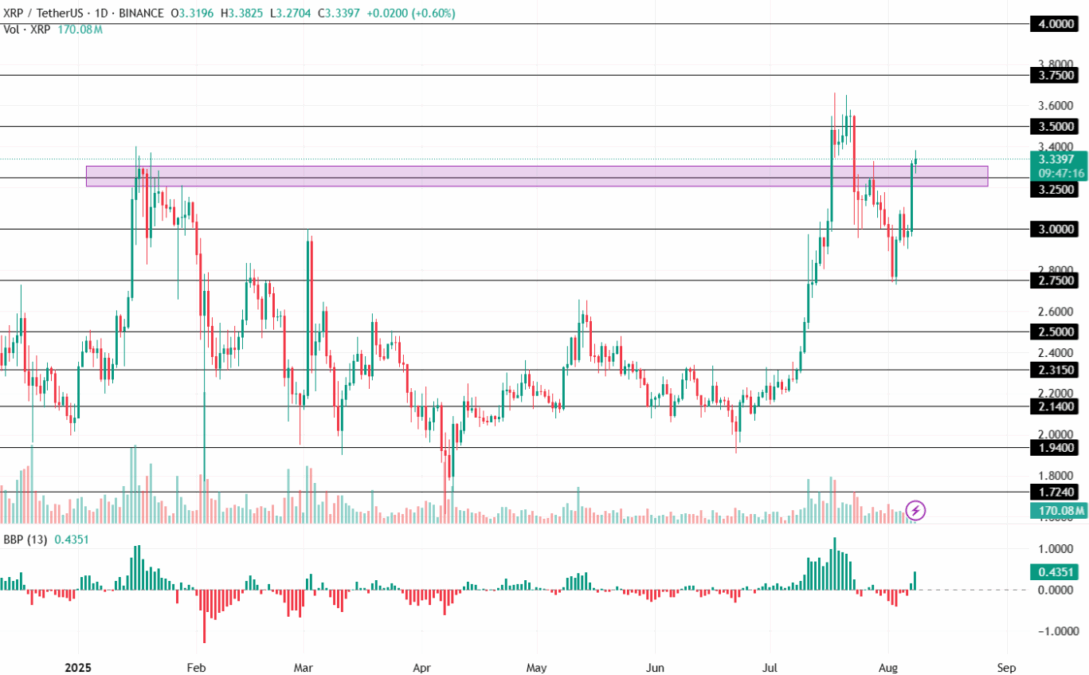
The Bear Bull Power (BBP) is a key indicator and is widely used by traders to understand the market sentiments. Currently this indicator shows a steep rise in its latest candle, suggesting a strong inflow for the altcoin in the market. A continued trend may result in it retesting higher price targets in the coming time.
The XRP price could retest its $3.50 mark if the bulls maintain dominance in the market. On the downside, increased profit-booking may pull the price toward its support of $3.25 or $3 soon.
Also Read: XRP Ledger Ethereum Sidechain Targets Developer Growth: Ripple CTO