The cryptocurrency market is close to concluding the week on a bearish note, indicating increasing negative action. Amid the ongoing market uncertainty, the valuation of the crypto market has dropped to $3.27 trillion with an intraday trading volume of $97.58 billion.
The Bitcoin price was one of the only few cryptos among the top 10 to record a positive weekly action. The BTC price has added over 3% to its valuation, resulting in it maintaining its value above the $107,000 mark. With this, the dominance of it has increased over 65% for the first time in 4 and half years.
However, the altcoin market shows a negative action with top tokens constantly recording a negative trend. Considering the present market sentiments, will the dominance of Bitcoin keep rising or will the altcoin segment make a comeback?
Bitcoin Price Holds Above the $107,000 Mark
The BTC price has formed a consolidated corridor between $102,470 and $109,631 and continues trading within it since the start of May. Despite recording multiple attempts of a breakout of a breakdown, its value has always bouncebacked within the range. With a market cap of $2.125 trillion, it is currently exchanging hands at $107,235.
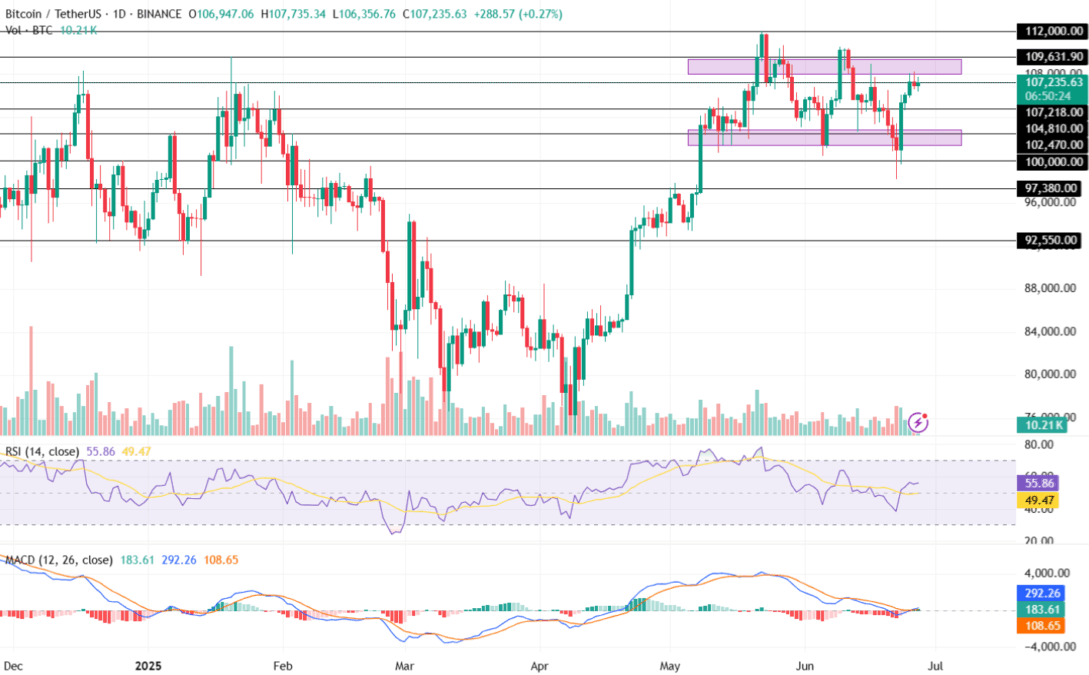
The Moving Average Convergence Divergence (MACD) indicator shows increasing volatility in the price chart. After recording a bullish crossover recently, the Bitcoin price has displayed a mixed price action. With its RSI indicator highlighting a sideways trend, the uncertainty for the BTC price is on a rise.
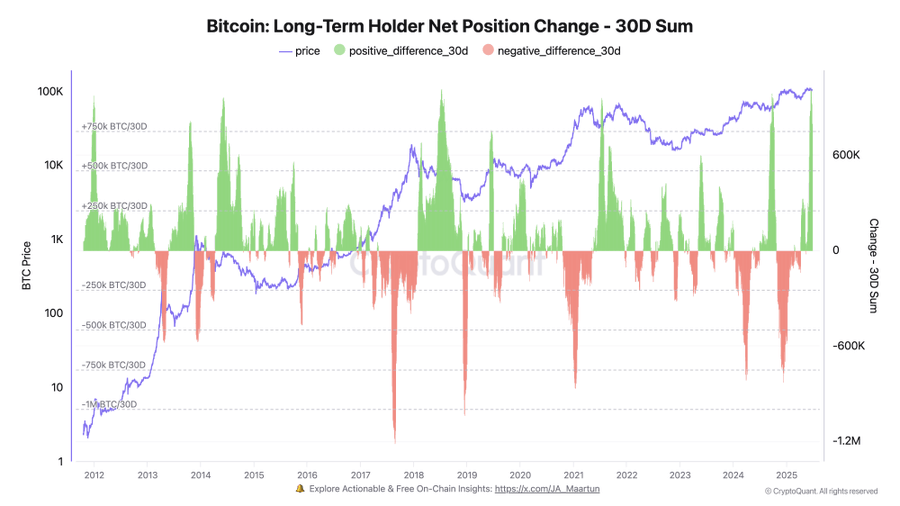
On-chain data shows that Long-term holders have added a staggering 800,000 BTC to their wallets over the past month, the highest increase ever recorded. On top of it net outflow of $1.88 billion from exchanges to private wallets gives bullish signals.
Under the positive influence of these conditions Bitcoin price could head towards its important resistance of $109,631. However, a sell-off may pull the price toward its low of $107,218 or $104,470 respectively.
Ethereum Price on The Path of A Major Price Action?
With an all-time high (ATH) of $4,891.70, the Ethereum price is trading at a discount of approximately 51%. However, the largest altcoin has maintained its value above the $2,400 level, suggesting a strong buying pressure at that point.
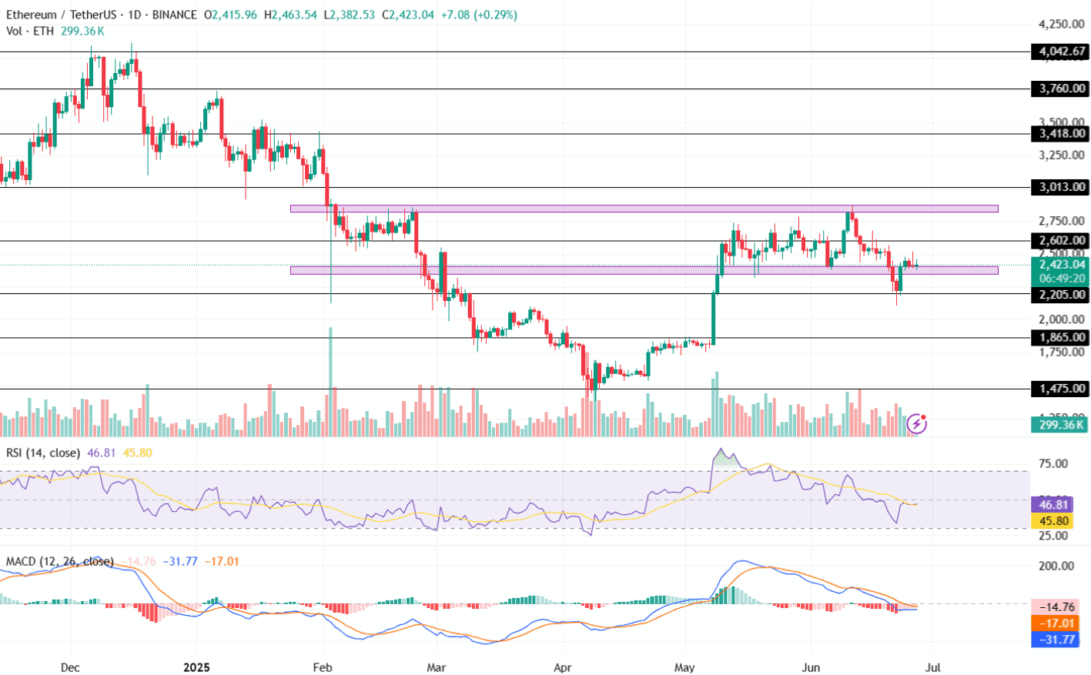
The Relative Strength Index (RSI) had retested its oversold range recently, resulting in a strong bullish reversal. However, the altcoin has failed to breach the halfway mark and has been trading just below it this week. Additionally, the MACD indicator witnesses a steady red histogram, suggesting a negative price action.
The ETH price could retest its immediate resistance level of $2,600 if the bullish sentiment intensifies. Meanwhile, the upper price target for it stands at around the $3000 mark. In case of a bearish action, the Ethereum price could plunge toward its low of $2,200 soon.
While these projections are easy to digest, various analysts are full of optimism as one of them just predicted $10,000 value for Ethereum. Though that is not an immediate target, it’s something that would take months along with a super bull cycle for altcoins.
XRP Price Forms Descending Channel Pattern
Despite recording a descending channel pattern, the XRP price has maintained its value around the $2.10 mark. The XRP token is currently listed at $2.1031 with an intraday change of -1.62%. Moreover, with a market cap of $123.45 billion, it has a market dominance of 3.776%.
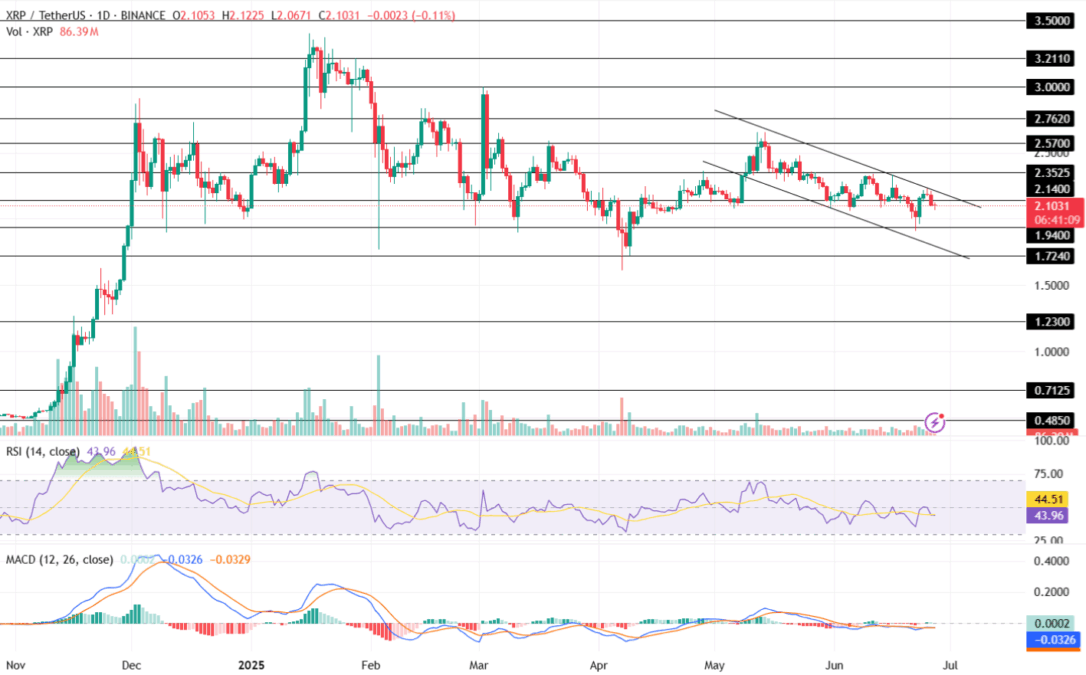
The RSI and MACD indicators have displayed a neutral price action over the past few days. While the RSI is currently valued at 43.96 (slightly bearish), the MACD shows constant flatlines with its 12 and 26-day averages showing a sideways action. This shows a weak price action for the XRP price.
The XRP coin price could retest its support trend levels of $1.94 or $1.72 if the bearish sentiment intensifies. On the other hand, a bullish reversal could result in it retesting its resistance of the channel pattern around the $2.20 mark. If the bulls maintain dominance at that point, it could head toward its upper high of $2.35.
Also Read: XRP Price Dips After Judge Torres Rejects Ripple SEC Motion, Will it Crash?