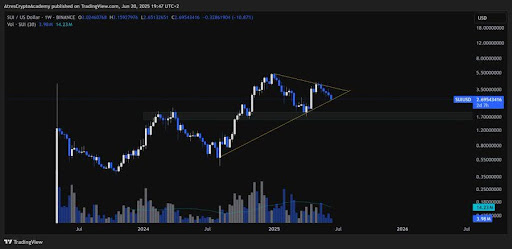
The SUI/USDT weekly chart is attracting attention as the price action tightens within a defined range. After a period of decline and consolidation, the asset is stabilizing, with key support levels holding firm. The structure suggests that the asset may be gearing up for a potential shift in trend.
Price Action Coiling Up — Will SUI Snap Upward?
SUI has formed a symmetrical triangle squeeze, a pattern known for preceding explosive moves. Its price recently dipped below the lower trendline, raising alarms for a potential breakdown. However, Atres Crypto Academy noted on X that this may have been a bull trap, a temporary shakeout before a sharp reversal.
If SUI snaps back into the triangle with strong momentum, it would signal that the breakdown was a false move, and bulls may be regaining control. In that case, the stage would be for an upside breakout, with the target set at $3.50 or more.
SUI price action is forming a falling wedge pattern, a bullish reversal setup. After dropping 37% from its May highs, the altcoin is now testing a key support zone between $2.70 and $3.00, an area that has typically drawn buying interest. WEBBZ.SUI highlighted that a confirmed breakout could propel the token toward the $4.50 to $5.00 region, and if support fails to hold, the next critical level will be the $2.00 zone.
According to Gemxbt, the 1-hour chart is showing a consolidation phase around the $2.85 level, with the price stabilizing above the 5, 10, and 20-hour moving averages, signaling strength and support in this zone.
The Relative Strength Index (RSI) is also trending upward, steadily moving away from oversold territory. This suggests that bullish momentum is building. Furthermore, the Moving Average Convergence Divergence (MACD) is approaching a bullish crossover, indicating possible upward price movement if confirmed by increased volume.
Signs Of Strength Emerging
SUI has quietly surged from under $0.60 to over $4.00 in less than a year, making an impressive nearly 7x gain despite pullbacks. The price-performance underscores the growing interest and momentum behind the token.
Emilio Crypto Bojan mentioned that the fundamentals are starting to catch up with the price action. DeFi aggregator volume has now surpassed $45 billion, with a 19% increase over the past 30 days, and bullish vibes are building ahead.
SUI is showing signs of strength after holding the critical support zone at $2.70, suggesting that a potential bounce is building. Presently, the market structure shows that conditions are favorable for a reversal, provided the bulls step in decisively. Cult Babe also revealed that the price action appears to be preparing for an upward move, with the key focus of reclaiming the $2.90 resistance level.

Related Posts