Introduction
Understanding Bitcoin’s market goes beyond just watching price movements. On-chain metrics provide deeper insights into investor behavior and market cycles by analyzing blockchain data directly. This article explores three key on-chain indicators – MVRV (Market Value to Realized Value), Bitcoin balance on exchanges, and the 1+ year HODL wave – and how they help paint a data-driven picture of Bitcoin’s market health.
MVRV Z-Score (Market Value to Realized Value)
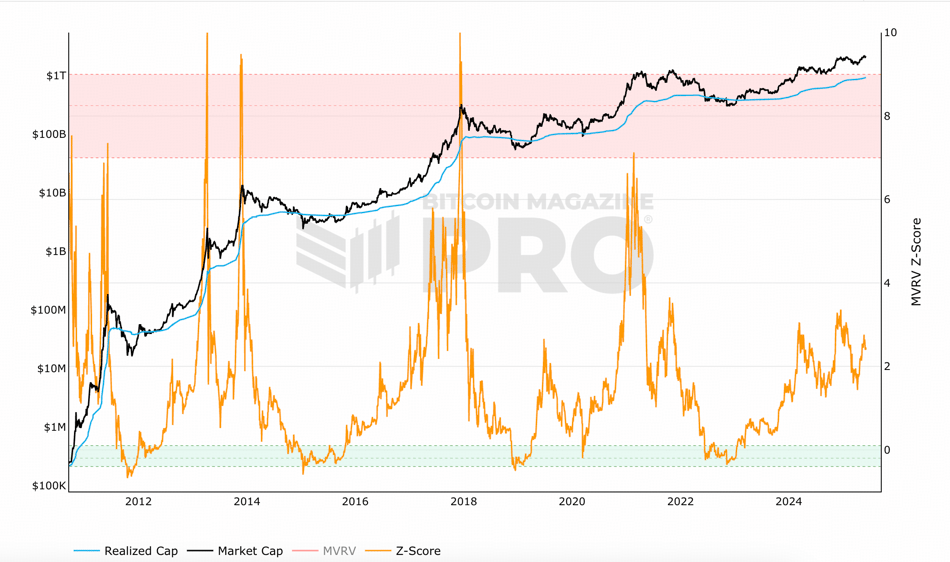
Bitcoin’s MVRV Z-Score chart, showing that current levels remain well below historical peaks. Higher MVRV Z-Score values (red areas) signaled past cycle tops, while low values (green) coincided with bear market lows.
Source: https://www.bitcoinmagazinepro.com/charts/mvrv-zscore/
What is MVRV?
MVRV stands for Market Value to Realized Value. In simple terms, it’s the ratio of Bitcoin’s total market capitalization to its realized capitalization. The market cap is just the current price times the circulating supply. The realized cap, in contrast, values each coin at the price when it last moved on-chain (essentially an aggregate “cost basis” for all BTC). By comparing these, MVRV shows the gap between current price and the average price at which coins were acquired. If the ratio is high, the average holder is in profit – on average, coins are worth much more now than what their owners paid. If MVRV is low or below 1.0, it means many holders would be sitting on losses if they sold at current prices.
Why is MVRV important?
This metric is a barometer of market sentiment and valuation extremes. A high MVRV indicates the market value is far above the aggregated cost basis, suggesting potential overvaluation – in such periods investors have large unrealized profits, so there may be greater temptation to sell (historically, MVRV spikes have aligned with major price tops). Conversely, a very low MVRV (especially below 1) means the market is trading near or even under the average on-chain cost basis, indicating possible undervaluation or capitulation – past bear market bottoms saw MVRV in this low range when most investors were underwater on their positions. In practice, analysts consider MVRV as a gauge of fair value vs. hype: it helps identify when Bitcoin is extremely overvalued or undervalued relative to what holders actually paid.
MVRV Z-Score
The MVRV Z-Score is a statistical refinement of the basic MVRV ratio. It compares Bitcoin’s market value to its realized value and then normalizes the difference using the historical standard deviation of that difference.
While MVRV gives a simple ratio, the Z-Score adds statistical depth, identifying extremes more precisely. Historically:
- A Z-Score above 7–8 has aligned with market tops (euphoria, overvaluation).
- A Z-Score near or below 0 has marked bottoms (despair, capitulation).
Unlike raw MVRV, which can drift over time due to structural shifts in realized cap, the Z-Score accounts for historical volatility, making it more robust for cycle analysis.
Potential Problem
The fundamental problem with the MVRV-Z Score lies in the fact that it is constructed entirely from on-chain data. Today, a substantial majority of Bitcoin trading occurs off-chain — particularly on centralized exchanges, ETFs as well as in the derivatives markets.
For example, if a large investor accumulates Bitcoin on Coinbase but leaves it in the exchange wallet without withdrawing to self-custody, there will be no on-chain movement. As a result, the realized value component of MVRV-Z does not update. Yet the market is clearly absorbing a large buy-side volume, a signal that MVRV-Z fails to capture.
MVRV-Z Score remains a powerful tool for identifying long-term valuation extremes based on historical price behavior and UTXO flows, it is fundamentally constrained by its on-chain-only perspective.
Bitcoin Balance on Exchanges
Total BTC held on exchanges over time (orange) versus Bitcoin’s price (black). Exchange balances grew steadily until 2020, peaking around 3.4 million BTC, then began declining. By 2025, exchange reserves have fallen near multi-year lows (signaling more coins in self-custody).

What is the “balance on exchanges” ?
This simply measures how much Bitcoin is held in wallets belonging to centralized exchanges. On-chain analytics can identify known exchange addresses and sum up all BTC in those wallets. The result is an estimate of the total supply sitting on exchanges available for trading.
Why is this important?
Exchange balance is often interpreted as an indicator of selling pressure and investor sentiment. The logic goes: when lots of BTC are parked on exchanges, those coins are just one quick sell order away from hitting the market – indicating potential supply overhang. Conversely, when the exchange balance drops, it means investors are pulling coins into cold storage, making them less immediately available for sale – a sign of accumulation and confidence (investors are comfortable holding, not looking to liquidate).
Historical trends support this view: rising exchange reserves have tended to coincide with bear markets or price declines (investors send BTC to exchanges, presumably to sell), whereas sustained declines in exchange-held BTC have often accompanied bull markets (coins moving off exchanges as people HODL for the long term).
Potential Problem
The landscape of custody is evolving. In late 2024–2025, a significant new factor was the rise of Bitcoin ETFs and institutional custodians. These products led to coins moving out of retail exchanges into custodial cold storage for ETFs. The exchange balance metric saw a drop (because those coins left exchanges), but this wasn’t due to individual hodlers—it was a shift in where coins are held.
According to Glassnode's analysis, when you combine exchange holdings with ETF custodial wallets, the total has remained relatively stable around ~3 million BTC, meaning the apparent outflows were largely a transfer from one type of custodian to another rather than a true supply squeeze.
Declining Exchange Balances Are Enhancing the Accuracy of MVRV Z-Score
One of the most frequently cited limitations of the MVRV Z-Score lies in its exclusive reliance on on-chain data. As a metric that compares Bitcoin’s market capitalization to its realized capitalization (where realized cap tracks the aggregated cost basis of all coins based on their last on-chain movement), the MVRV Z-Score fails to capture any activity that occurs off-chain.
In such a context, if large volumes of Bitcoin are bought and held within exchange wallets without being withdrawn to self-custody, those transactions remain invisible to the realized cap component. The result is a potential distortion: the metric may suggest under- or overvaluation based on incomplete data about actual cost basis and market sentiment.
However, this core limitation may be becoming less severe in the current market environment. A significant structural shift has occurred in Bitcoin custody patterns since 2020, as evidenced by the sharp and sustained decline in the total BTC balance held on centralized exchanges.
This mass withdrawal behavior has important implications for the MVRV Z-Score. As more BTC leaves exchanges, those movements typically generate on-chain activity. These withdrawals register new timestamps and prices for the UTXOs involved, thereby updating the realized cap. As a result, a growing portion of market activity that was previously invisible to MVRV is now being incorporated into its dataset. The consequence is that the MVRV Z-Score may now more accurately reflect market sentiment and aggregated cost basis than it did during earlier periods of heavy exchange dominance.
However, the rise of ETFs and institutional custodianship introduces new layers of abstraction: while coins may leave retail exchanges, they often move into large custodial aggregators whose on-chain patterns may be difficult to interpret, limiting the granularity of insight available from realized cap updates.
Most U.S.-based spot Bitcoin ETFs were launched in early 2024, during the early phase of a bull market. Since their inception, these ETFs have primarily been in an accumulation phase, buying large quantities of BTC from exchanges and transferring them into institutional-grade custodial wallets. These are first-time acquisitions, meaning they involve on-chain settlement: coins are purchased (often OTC or via prime brokers), then withdrawn from exchange wallets and deposited into ETF custodians’ wallets—triggering UTXO updates in the process.
Because these transactions involve actual on-chain movements—either withdrawals from exchange hot wallets or direct transfers into segregated custody—they are captured in the realized cap calculation. Thus, the MVRV Z-Score does reflect the cost basis of these ETF-acquired coins, even though those coins now sit in wallets that may appear relatively static afterward.
1+ Year HODL Wave (Long-Term Holder Supply)
Bitcoin “1+ Year HODL Wave” – percentage of supply untouched for at least one year. In prior cycle peaks (2017, 2021), this percentage dropped significantly as long-term holders sold off, whereas currently it remains elevated, indicating many are still holding their coins.
Source: https://www.bitcoinmagazinepro.com/charts/1-year-hodl-wave/
What is the 1+ Year HODL Wave?
The term HODL waves refers to a visualization of Bitcoin’s supply divided by the last time each coin moved (its “age”). The 1+ year HODL wave specifically measures the proportion of Bitcoin that hasn’t been moved from one address to another in at least one year. In plain language, it’s the share of BTC being held by long-term holders (LTHs) – people who haven’t touched their coins for a year or more.
Why is it important?
The HODL wave is a window into holder behavior and market cycles. Generally, long-term holders set the floor and ceiling of cycles: they accumulate during bear markets (increasing the 1y+ wave as coins age without moving), and they distribute during bull markets (spending some of those old coins, which shrinks the 1y+ percentage).
A rising 1+ year HODL wave indicates coins aging and staying put – a sign of accumulation and strong conviction. This often happens in bear phases when prices are low and patient investors or “smart money” keep buying or holding. Conversely, when the 1+ year band starts to decline, it means previously dormant coins are on the move – typically indicating profit-taking by long-term holders as the market heats up.
In bull markets, long-term holders gradually sell or redistribute coins to newer buyers, which shows up as a drop in the percentage of 1y+ old coins. Thus, this metric provides insight into where we are in the cycle: if the long-term HODLer cohort is at all-time highs, it suggests we’re still in a strong-hands, accumulation-heavy phase; if that cohort rapidly shrinks, it can signal a distribution phase associated with market tops.
Potential Problem
On its own, the HODL wave doesn’t tell you if those long-term holders will continue to hold or are about to sell en masse. It’s a bit like looking at a reservoir of water without knowing when the dam will open. You know a lot of water (supply) is stored up, but timing the release requires other data. The metric is most powerful when combined with others – for example, pairing a decline in HODL wave with a spike in exchange inflows and a high MVRV would strongly indicate a top forming. But the HODL wave by itself is more informative about the past and present state of holdings than the immediate future.
Combining Metrics for Deeper Insights
No single metric can capture the full complexity of Bitcoin’s market. Each of the three indicators above – MVRV, exchange balances, and the HODL wave – shines light on one dimension of market behavior. MVRV is about investors’ profitability (and thus greed/fear), exchange balance is about traders’ positioning (liquid vs. cold storage), and HODL wave is about long-term holder conviction. Taken together, they give a holistic view of the market’s state.
At major cycle tops, you tend to see confluence in these metrics: MVRV will be very high (signaling overvaluation and big unrealized profits), HODL wave will start dropping (long-term holders finally spending coins), and exchange balances may tick up (coins flowing to exchanges to be sold). No single metric is a perfect sell signal, but together these paint a powerful warning.
Current data (mid-2025) from these metrics collectively points to a robust market: valuations aren’t at extreme danger levels, supply on exchanges is constrained, and hodlers remain historically resolute.