Bitcoin appears to be walking a well-worn path, one that gold traced out not long ago. According to an analysis shared by crypto analyst Ted Pillows on the social media platform X, the current price structure of the leading cryptocurrency is closely imitating gold’s trajectory from its accumulation phase through distribution and a breakout rally.
The observation, backed by a side-by-side comparative chart, suggests that Bitcoin’s correction after hitting its new all-time high earlier this year is not only healthy but also part of a large alignment with gold’s recent bull run.
Distribution, Reaccumulation, And Setup For Next Breakout
Technical analysis of Bitcoin’s price chart shows that the leading cryptocurrency is tracing out a path laid out by fold, albeit across different timeframes. Although Bitcoin’s formation is developing on the mid-range 2W timeframe, gold’s similar structure played out on the larger monthly candlestick chart. Despite the difference in scale, the resemblance in structure is significant for what lies ahead.
As shown in the chart comparison below, gold’s historical pattern begins with an initial distribution zone that spanned from 2011 to 2013, followed by a long accumulation period up until mid-2019. Once that base was built, gold transitioned into a re-accumulation phase that lasted until 2023. This accumulation phase was the stage for gold’s price explosion, which culminated in recent highs above $3,300.
Pillows illustrates how Bitcoin is now going through a similar progression. After its euphoric rally to $69,000 in late 2021, Bitcoin entered a distribution phase that lasted throughout 2022. What followed was a textbook accumulation structure in 2023. Bitcoin then broke above $45,000 and entered a reaccumulation phase in late 2024, almost a mirror image of gold’s price development just before its breakout.
In the case of Bitcoin, its vertical rally began in late 2024 and continued until the recent price action. The chart below clearly marks this current BTC phase, with the analyst projecting a continued move to new all-time highs.
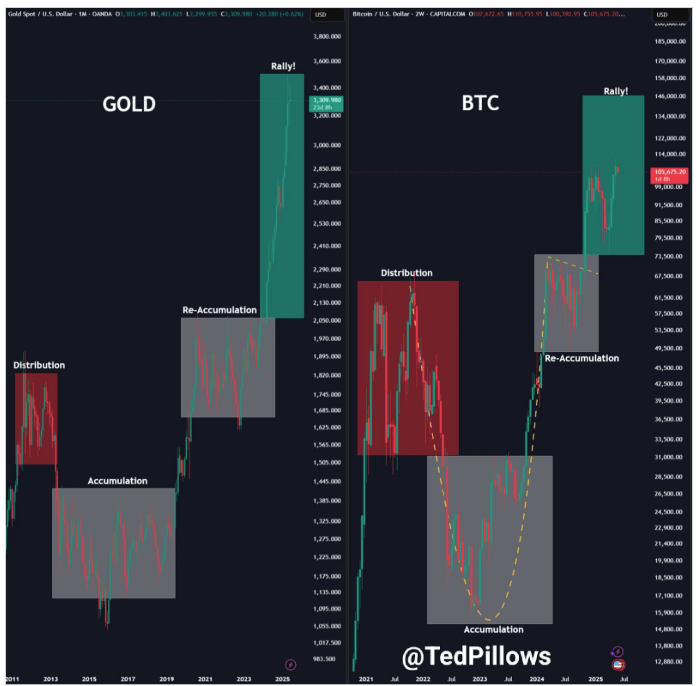
Chart Image From X: TedPillows
Bitcoin Will Break Out By Q3 2025
Interestingly, gold also underwent a similar pullback in its rally phase shortly after initially reaching a new peak just above $2,750. This correction occurred over the space of two monthly candlesticks before it resumed its powerful rally. “Gold also had a correction after hitting the new ATH, and the same happened with BTC,” Pillows remarked.
The implication here is that Bitcoin’s current price behavior isn’t a sign of weakness but rather part of a consolidation phase before the next leg up. Just as gold surged vertically after exiting its final reaccumulation box, Bitcoin may follow suit very soon.
Based on this fractal similarity and the broader trend behavior, Pillows projects that Bitcoin will reach a cycle peak somewhere between $125,000 and $130,000 in the third quarter of 2025. At the time of writing, Bitcoin is trading at approximately $105,600,
Featured image from Unsplash, chart from TradingView

Related Posts