VIRTUAL entered a consolidation phase following a sharp decline.
Most investors (over 66%) were out of the money at press time.
Virtual Protocol’s [VIRTUAL] market movements have remained highly dynamic, characterized by rapid price swings and shifting volume trends.
The cryptocurrency experienced significant volatility over recent months, with notable fluctuations in its 30-day high and low levels.
Investor sentiment appeared to be shifting, with an increase in trading activity suggesting a potential breakout or further consolidation.
VIRTUAL volatility and volume correlation
VIRTUAL entered a consolidation phase following a sharp decline.
A closer analysis of its volatility trends revealed significant fluctuations, with a 30-day high of 186.20% recorded on the 3rd of March, and a low of 146.76% on the 19th of February.
This 39.44% range suggested erratic price behavior, indicating active trading participation.
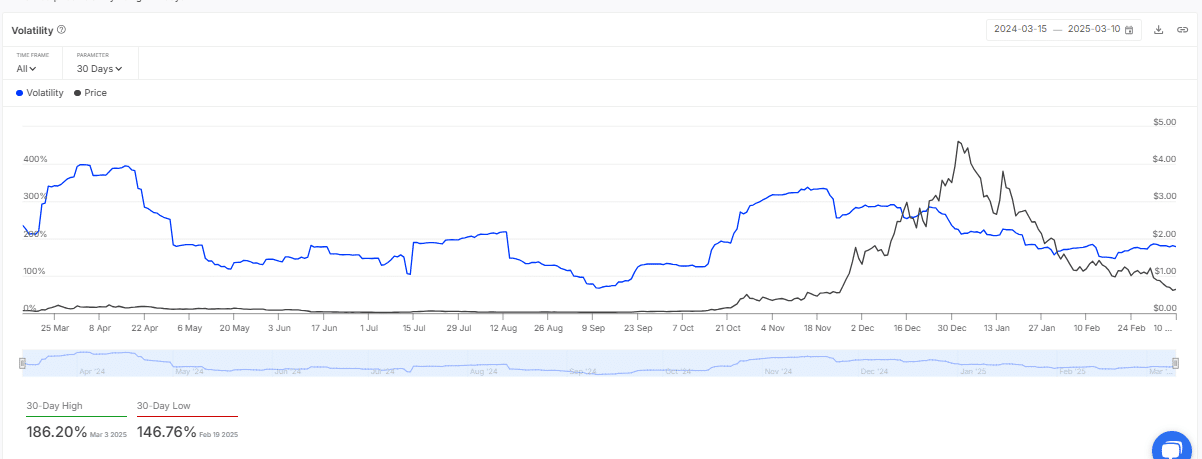
Trading volume surged by 53.18%, reflecting renewed investor interest. Historically, VIRTUAL’s volatility peaked at 400% in late March 2024 before dropping to 100% by mid-2024, stabilizing near 200% in early 2025.
The latest surge in volatility, paired with a volume increase, hinted at speculative trading. The spike to 186.20% aligned with a rise in volume, suggesting strong buying pressure.
Conversely, the dip to 146.76% coincided with reduced volume, indicating waning momentum.
If the current volume increase sustains above 20.83M, it could drive a renewed volatility spike, potentially pushing Virtual’s price to $0.6367.
A decline in volume below 20M, however, could lead to decreased volatility, trapping prices in a range.
Long-term stability may depend on continued volume growth, which could help VIRTUAL consolidate at higher price levels.
Assessing Virtual’s potential rebound
VIRTUAL’s price action displayed signs of consolidation following a downtrend. Analyzing the 1-hour price chart, it was trading at $0.64458.
The Moving Average Convergence Divergence (MACD) indicator suggested an impending bullish crossover, with the signal line at 0.0135 nearing the MACD line at 0.023.
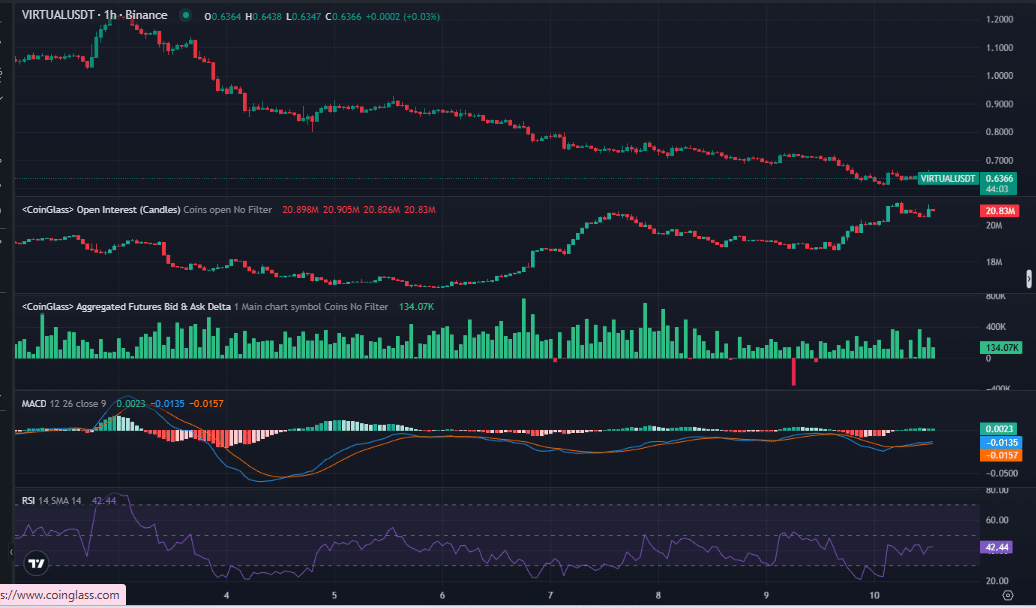
The Relative Strength Index (RSI) stood at 42.44, approaching oversold territory below 30. Additionally, Open Interest remained steady at 20.83M, indicating traders were positioning for a breakout.
The candlestick pattern revealed a recent low of $0.6366 and a high of $0.6438. The MACD’s alignment at 0.0135 and 0.023 suggested a potential price reversal.
The RSI nearing oversold levels reinforced the likelihood of an upward move. Open Interest stability at 20.83M mirrored past recoveries, further supporting the bullish case.
A successful MACD crossover above 0.023 could trigger a price increase toward $0.6438 and beyond. If resistance at $0.6366 fails to hold, Virtual’s price could decline toward $0.6000, prompting further sell-offs.
Looking ahead, a sustained MACD crossover and RSI drop below 30 could support a push toward $1.00.
Gauging profitability and market sentiment
Data revealed that in-the-money positions totaled 160.78M VIRTUAL (32.61%), while out-of-the-money positions accounted for 329.36M VIRTUAL (66.79%).
Meanwhile, at-the-money positions stood at 2.96M VIRTUAL (0.60%).
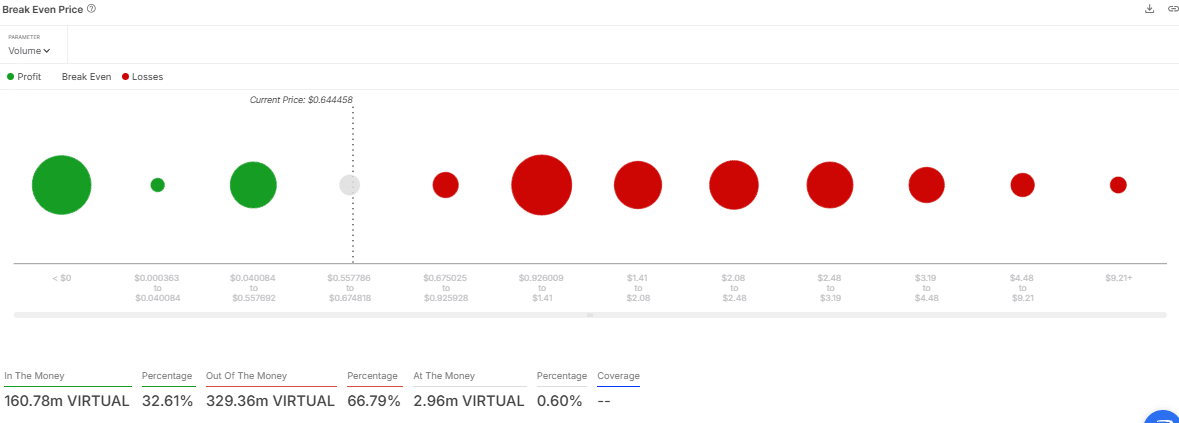
Break-even price levels ranged between $0.000383 and $9.21+, with notable clusters at $1.41 for profitable positions and $2.48 for loss-making positions.
The 32.61% share of in-the-money holdings suggested that many traders had acquired VIRTUAL at lower prices and were currently seeing gains.
However, the 66.79% share of out-of-the-money holdings indicated that a significant number of traders were facing losses, which could lead to selling pressure if the price dropped further.
A breakout above $1.41 could reduce out-of-the-money positions, potentially pushing prices toward $2.48. Conversely, if VIRTUAL’s price fell below $0.64458, losses could increase, driving a decline to $0.6000.
Over the long term, shifting more out-of-the-money positions into profitability could help stabilize Virtual above $2.48.