Data shows Bitcoin has been stuck in a historically tight range recently, something that could be a precursor for extreme volatility.
Bitcoin 30-Day Price Range Has Compressed To Tight Values
In a new tweet, the analytics firm Glassnode has looked into how volatile the asset has been recently. One way to quantify the volatility of Bitcoin is by taking the highest and lowest price points over a specific time period and calculating their percentage difference.
The timespan of interest in the context of the current discussion is the 30-day period, meaning that the volatility here is calculated by checking for the difference between the top and bottom registered during the last 30 days.
Naturally, whenever the value of this metric is high, it means that the cryptocurrency’s price has observed large fluctuations in the past month. On the other hand, low values imply that the asset has traded inside a narrow range.
Now, here is a chart that shows the trend in the 30-day high and low, as well as the difference between the two (that is, the 30-day range), for Bitcoin over the entire history of the coin:
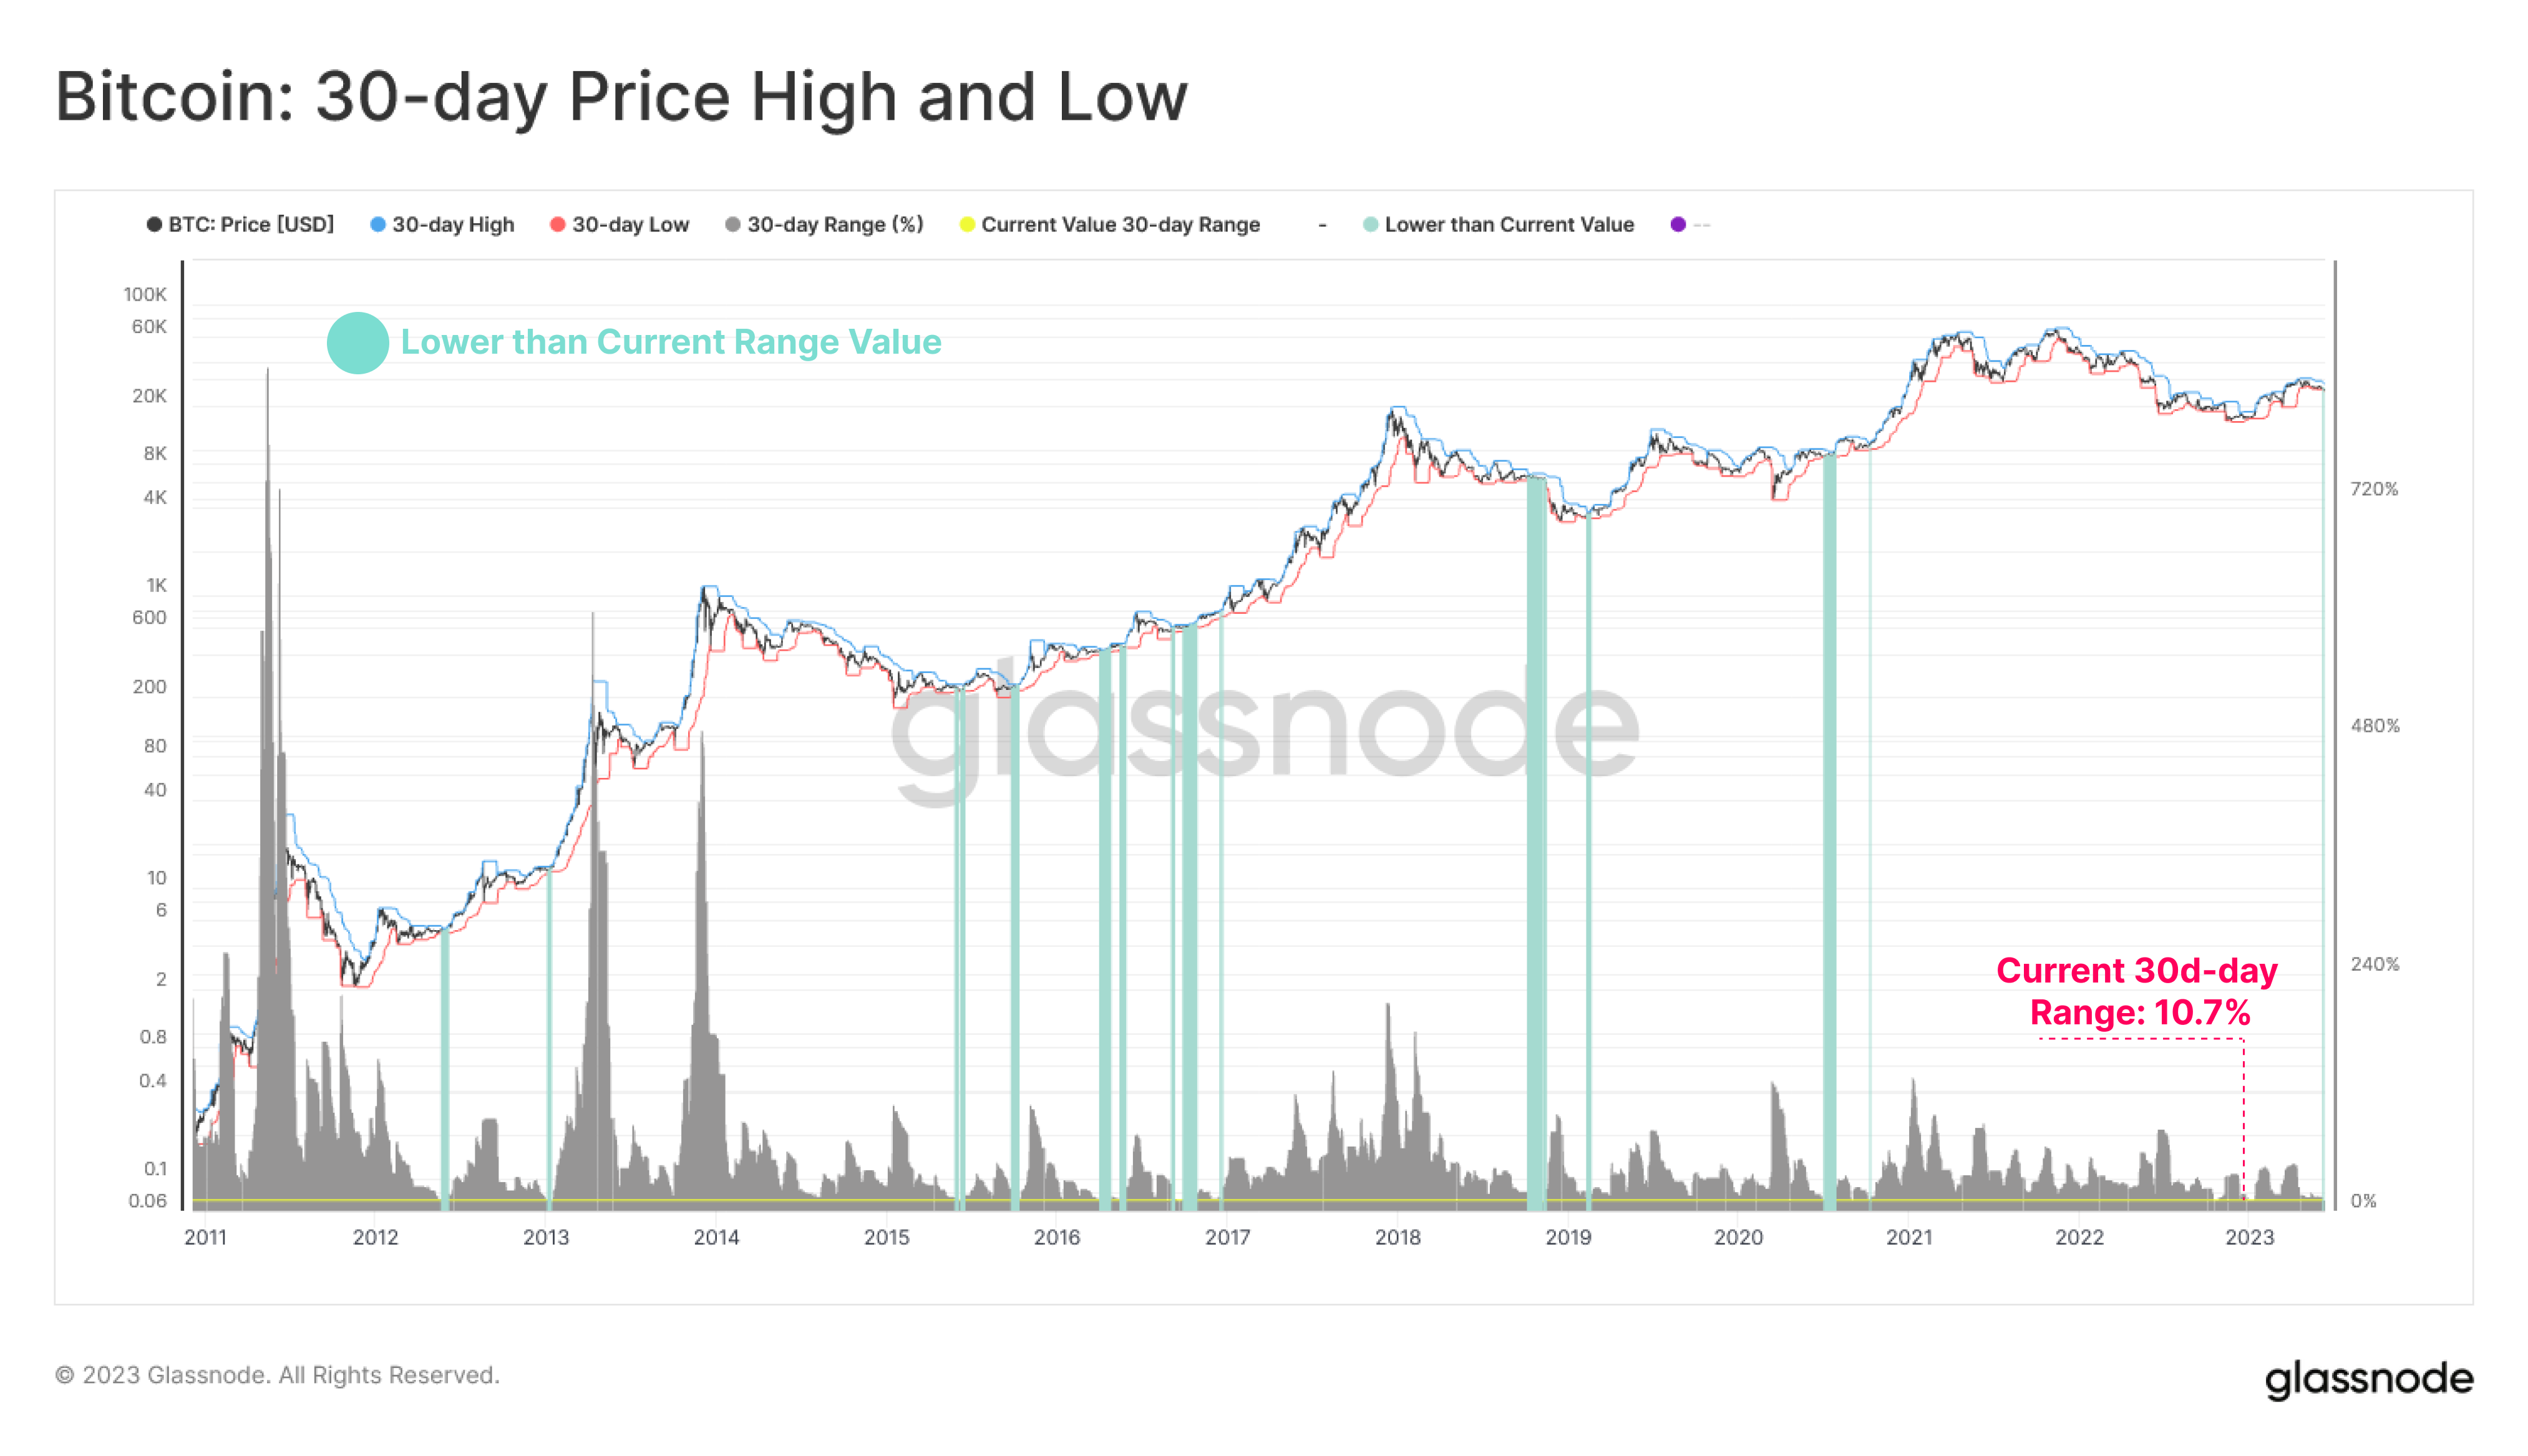
The value of the metric seems to have been quite low in recent days | Source: Glassnode on Twitter
As displayed in the above graph, the Bitcoin 30-day range has had a value of 10.7% recently, meaning that the cryptocurrency’s price has fluctuated 10.7% between its top and bottom during the past month.
From the graph, it’s clearly visible that the current value of the indicator is very low when compared to the norm during the asset’s history. Interestingly, this is despite the fact that the BTC price has registered some fresh volatility recently due to FUD around Binance and Coinbase coming under regulatory pressure.
While the asset may have seen some short-term volatile price action following the emergence of this uncertainty in the market, Bitcoin has still overall only traded in a narrow range when looking at the grand scheme of things.
In the chart, the analytics firm has also highlighted the trading days that saw an even tighter 30-day range than the one being observed currently. As expected, it looks like there haven’t been that many instances where such a trend has taken place.
Curiously, following most of these occurrences, the Bitcoin price observed a burst of volatility as the narrow 30-day range decompressed. One prominent example of this would be the November 2018 crash, which was preceded by a period of the asset moving endlessly sideways inside a tight range. This crash occurred during the bear market of the previous cycle and lead to the formation of the cyclical bottom for it.
If the pattern followed by all these instances is anything to go by, Bitcoin may currently be approaching a narrow range that would only result in some extreme volatility for the asset in the near term.
At the time of writing, Bitcoin is trading around $25,900, down 3% in the last week.
Looks like BTC has been moving sideways since the plunge | Source: BTCUSD on TradingView
Featured image from iStock.com, charts from TradingView.com, Glassnode.com