Rising Inflows Into Bitcoin Structured Products
Kaiko Research: March 28, 2022
Subscribe to Kaiko’s weekly research newsletter here.
Price Movements: The stablecoin Tether has enabled artificial FX markets for the Ukrainian currency.
Trade Volume: Korean exchange volume is down 140% since November following stricter regulations.
Order Book Liquidity: BTC-USD spreads have recovered after a volatile month.
Derivatives: Options volumes remained stable despite billion dollar expiries.
Macro Trends: The BITO ETF’s AUM is up 11% year-to-date.
Price Movements
Bitcoin closes the week up 13%.
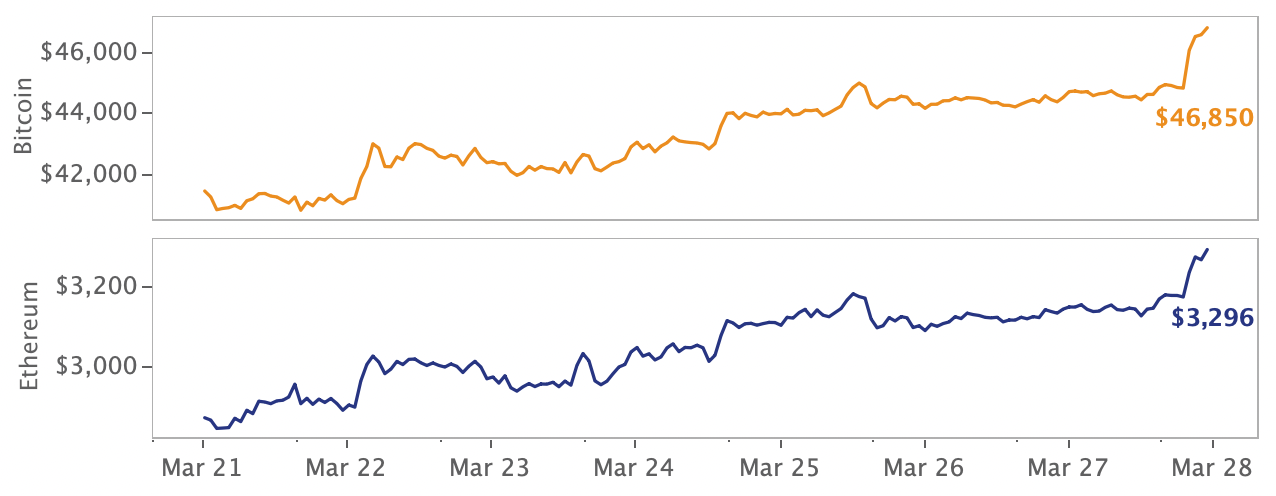
Crypto markets ended the week on a high note despite money markets, once again, ramping up monetary tightening expectations following hawkish comments by the Fed chair. Bitcoin and Ethereum closed Sunday up 13% and 14.7 %, respectively, and altcoins earned their fair share of gains. Layer 1 tokens in particular performed well, with Cardano’s ADA up 33% and Solana’s SOL up 21%.
In other industry news, Goldman Sachs completed its first over-the-counter crypto transaction, Bridgewater Associates — the world’s largest hedge fund — reportedly is planning to invest in a crypto fund, and micro-investing app Acorns added Bitcoin exposure as an option for long-term investment.
Fiat and crypto Ukrainian currency markets diverge.
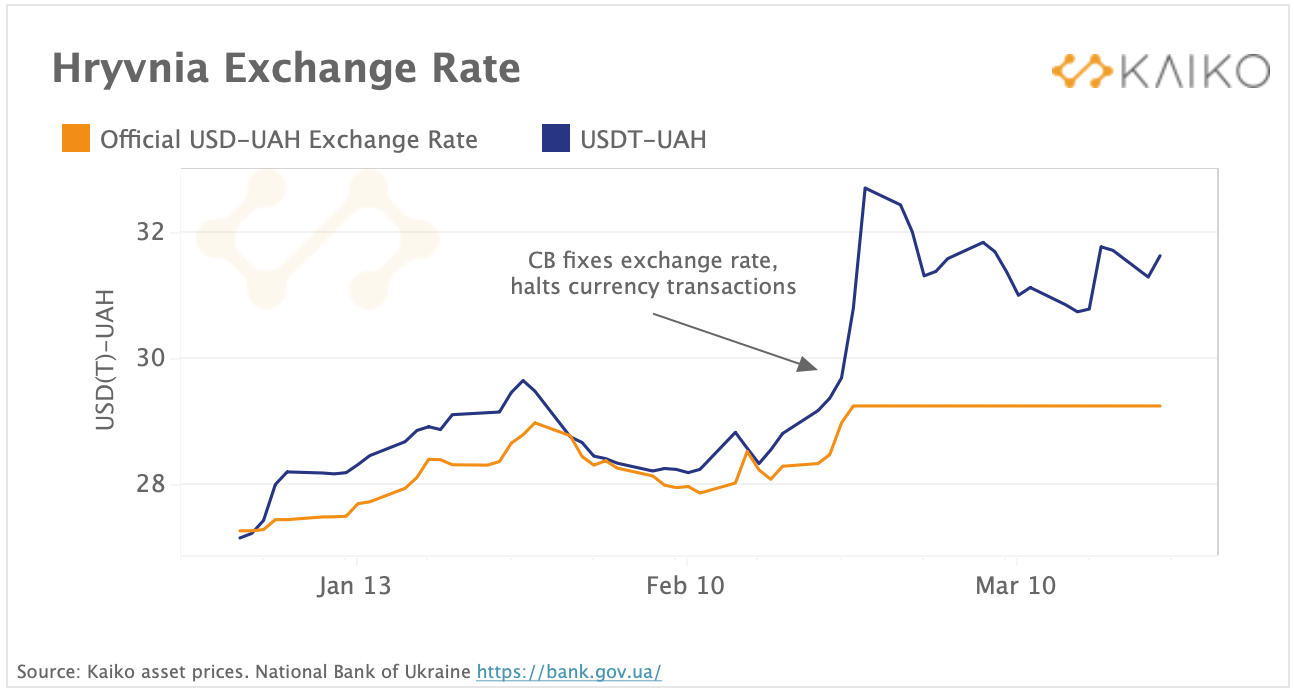
Ukrainian currency markets have experienced strong disruptions since the start of the war, with UAH plummeting to all time lows versus the USD. The Ukrainian central bank has since halted currency transactions, limited cross-border transfers and fixed the exchange rate at around 29 UAH for one USD in an attempt to defend its currency and limit bank runs. By contrast, crypto markets continue to operate 24/7 and have emerged as a source of liquidity, enabling a form of artificial market for USD through the stablecoin Tether. Since the onset of the central bank’s currency restrictions, we have observed a strong divergence between the exchange rate for UAH to USDT and actual UAH-USD forex markets, which remain fixed. Today, 1 USDT is trading around 32UAH on Binance.
On March 19th, the largest commercial bank in Ukraine suspended UAH deposits to cryptocurrency exchanges in an attempt to reduce currency outflows. The divergence in exchange rates on Binance suggests that free forex markets would cause the currency to depreciate even further, and is an interesting example of crypto’s ability to foster parallel markets.
Bitcoin discount emerges on Korean markets.
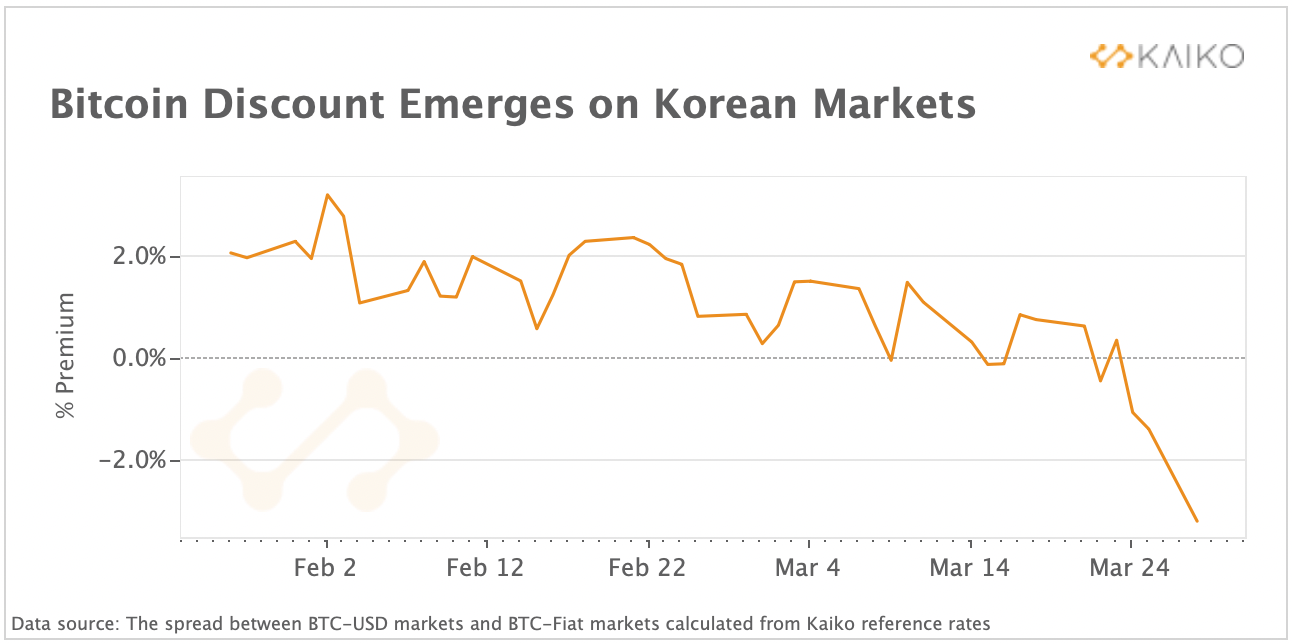
Bitcoin traded at a discount of 3.2 % relative to the U.S. Dollar on Korean markets last week after the entry into force of new crypto regulation on March 25th. South Korea’s unique regulatory framework, restricting cross-border capital transfers for foreigners, resulted in the so-called “Kimchi Premium’’ since 2016 — a gap between Bitcoin prices on Korean markets and on other global exchanges. At times, Bitcoin has traded at a premium of as much as 20% on Korean markets relative to U.S. markets.
However, for the first time in years, this premium has turned into a discount as traders anticipated the adoption of the Financial Action Task Force (FATF) travel rule, which requires virtual assets service providers to collect and disclose customer information for all transactions above a threshold, in this case about ~$820.
Trade Volume
Korean exchange volume plummets amid stricter regulatory environment.
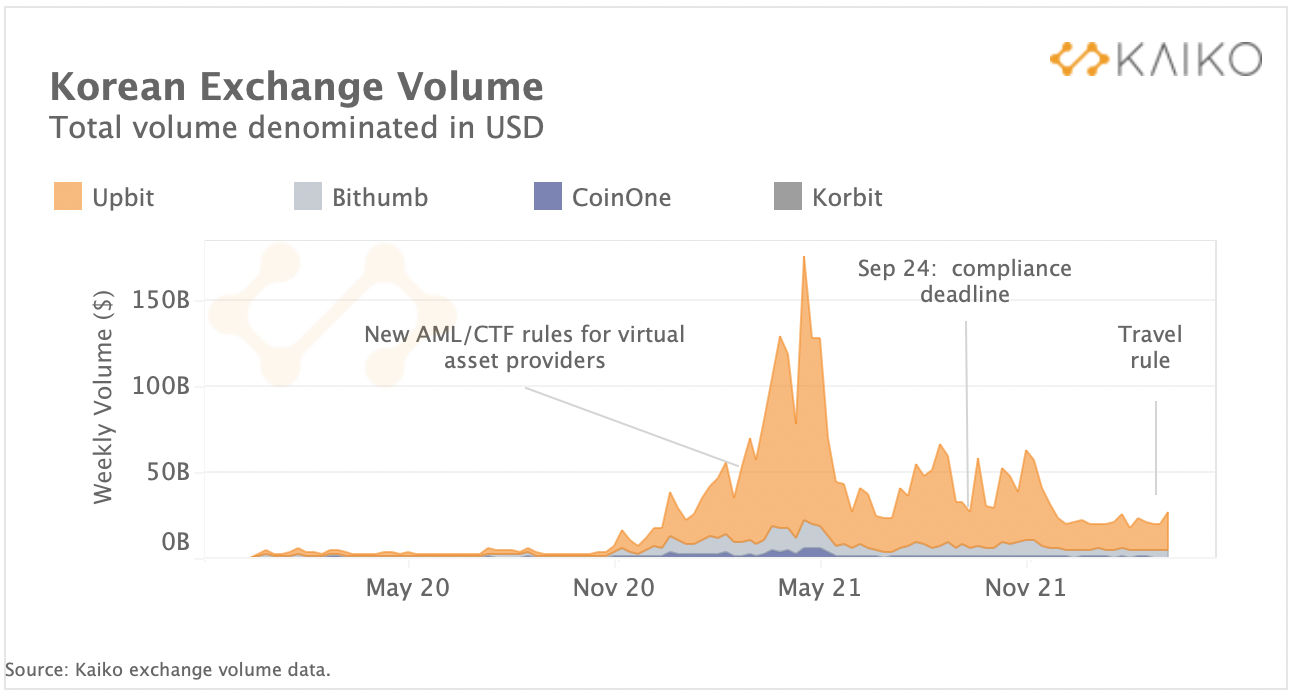
The growing cost of compliance with crypto regulations and stringent reporting requirements has led to a consolidation of the Korean crypto market and the withdrawal of major exchanges such as Binance and Okex from the region. Stricter regulations could also be impacting trade volume over the past few months. We can observe that weekly trade volume on the “Big four” exchanges dominating the Korean market — Upbit, Bithumb, Coinone and Korbit — are down more than 140% relative to the November average. For context, BTC-USD trade volumes aggregated across the ten largest global exchanges, have dropped just 25% over the same period. Upbit, which remains the market leader with around 80% of total trade volume, has seen the strongest drop in volumes.
ETH market structure has evolved since 2021.
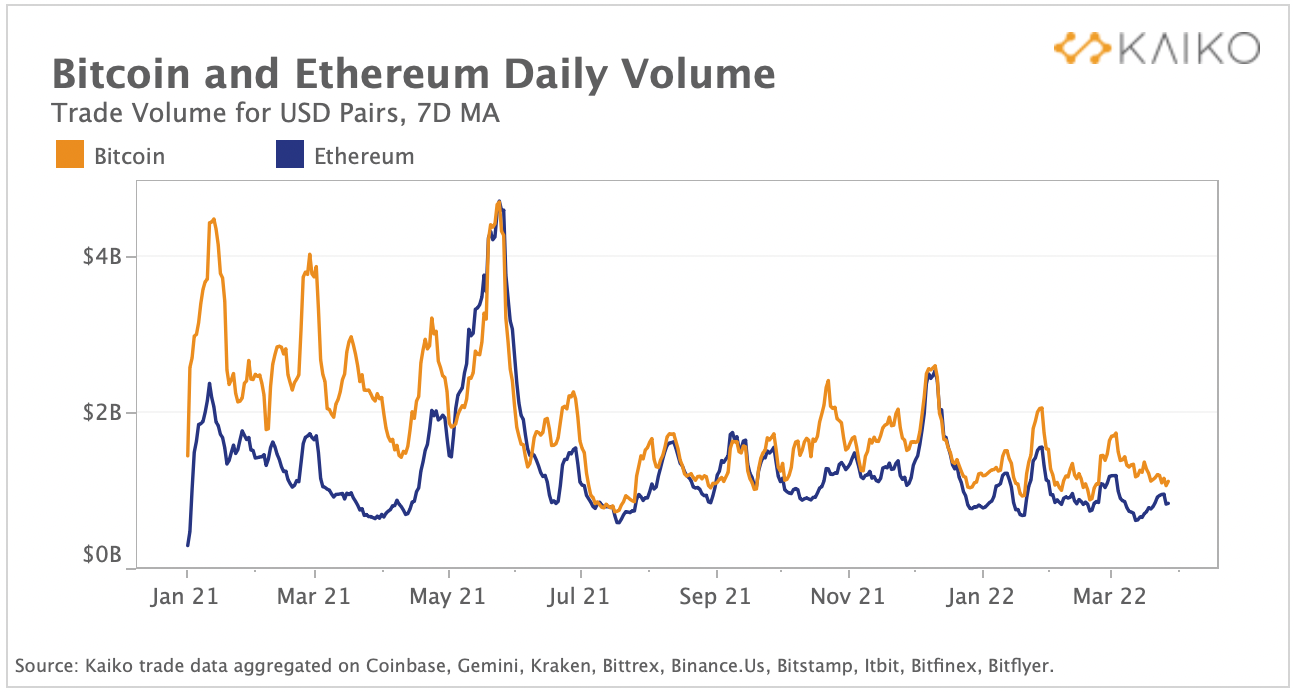
Crypto market structure has evolved significantly over the past year with Ethereum gaining interest as an investment asset. We can understand this shift in market structure by looking at daily average volume for BTC and ETH. While daily volumes diverged strongly during the 2021 crypto bull market, with Bitcoin trade volumes on average 50% higher than Ethereum’s, the gap between the two has declined ever since May 2021 and currently hovers around 30%. The gap widens and falls as markets enter periods of bearishness — when traders rotate funds out of altcoins — and bullishness — when traders invest more into Ethereum.
We further chart Bitcoin and Ethereum average trade size, and can observe a slightly different trend.
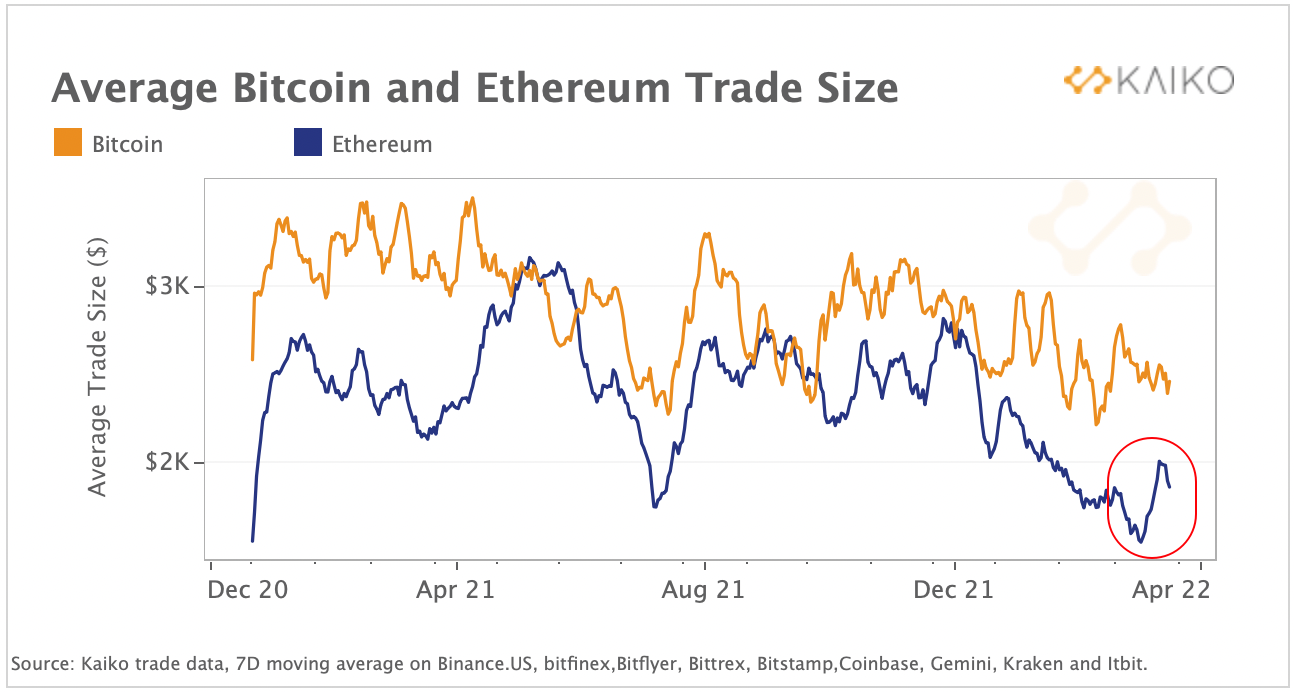
Bitcoin’s average trade size has mostly exceeded Ethereum’s over the past year even as total trade volumes converge. The divergence in trends is possible due to an increase in Ethereum’s overall trade count. Ethereum’s average trade size recently spiked in March, boosted by a bullish turn ahead of the network’s upcoming upgrade, but still remains about $500 lower than Bitcoin’s. Overall, both Bitcoin and Ethereum average trade sizes have fallen since 2021.
Order Book Liquidity
BTC and ETH market depth also converge.
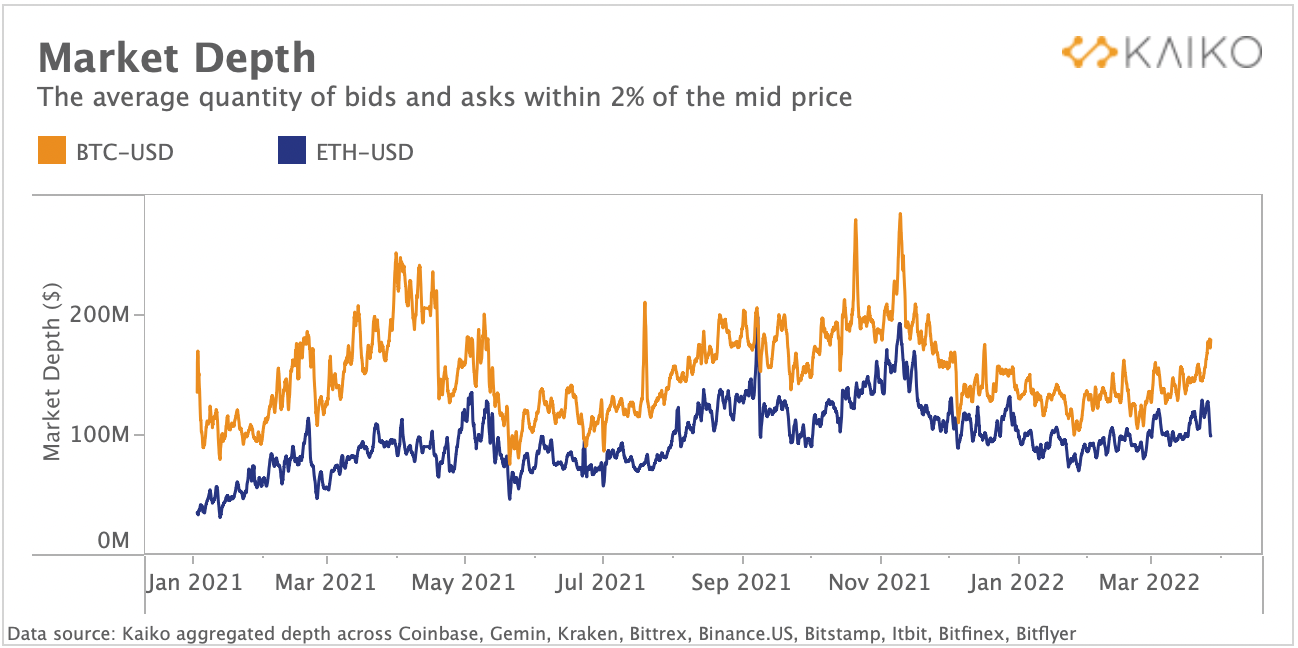
Much like trade volume, market depth for BTC and ETH has also converged since early 2021. Kaiko’s measure for market depth takes the quantity of bids and asks within 2% of the mid price, derived directly from our order book snapshots. Market depth is typically measured using the crypto asset’s native units, but in order to compare different assets we multiply depth by the mid price to get an approximate USD value for the total quantity of assets live on a pair’s order book. Today, there is about $150 million worth of BTC and $100 million worth of ETH within 2% of the mid price aggregated across the most liquid USD pairs.
Overall, BTC-USD order books are still more liquid than ETH-USD order books, but less so than early 2021, when we first observed a shift in market structure towards Ethereum. Today, ETH has about 40% less depth than BTC, while the gap in volume on the same exchanges is about 30%. This suggests market making activity is still catching up.
Spreads recover after volatile February.
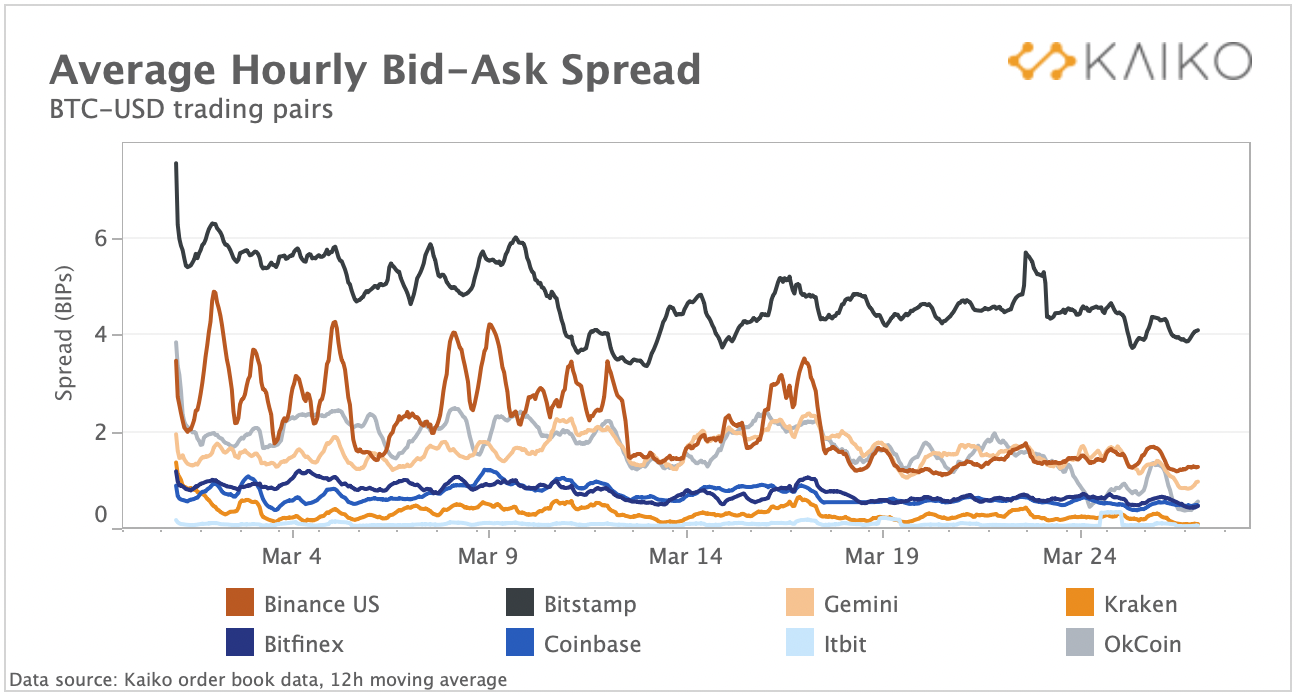
The bid-ask spread for BTC-USD pairs has recovered after a volatile February and early March. For nearly all exchanges, average hourly spreads have dropped. Bitstamp and Binance.US have seen the most improvement, with spreads falling from 6 basis points to 4 and 4 to 2, respectively. Other exchanges are experiencing more stable liquidity as markets recover and continue making gains.
Derivatives
Weekly options volume remain subdued despite big expiry.
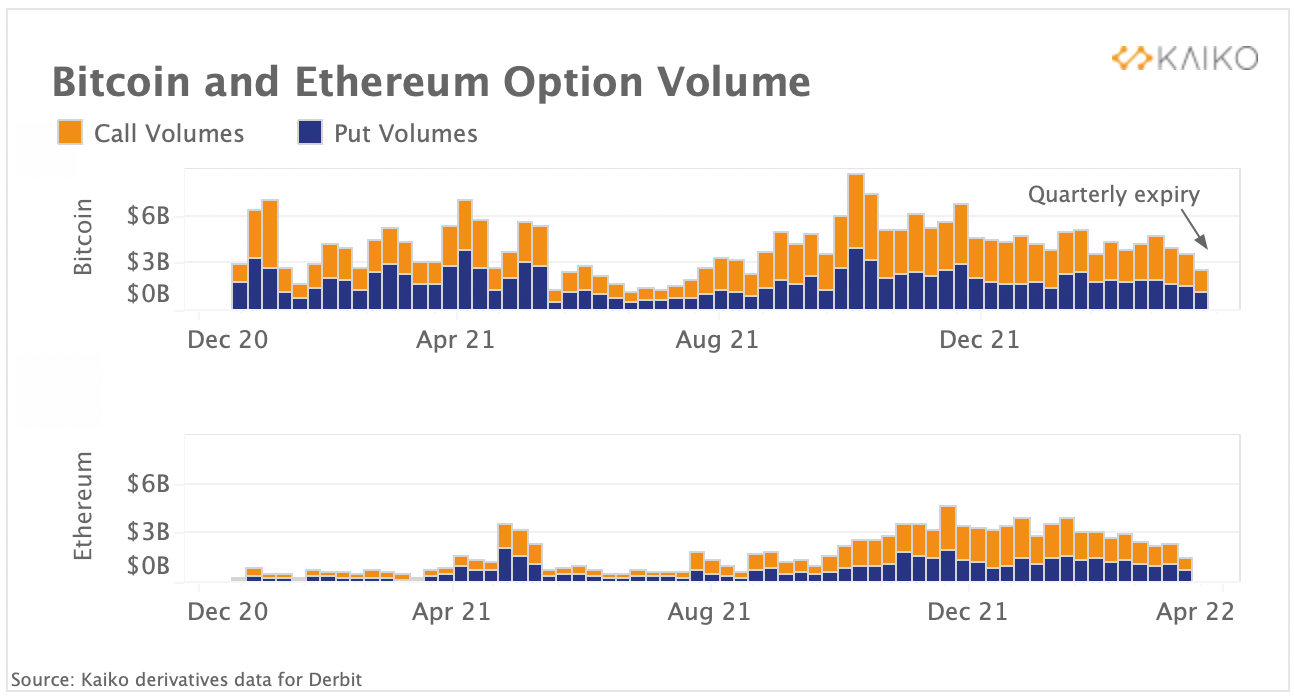
Last week marked one of the biggest quarterly options expiry for Bitcoin and Ethereum, with $5B of options contracts expiring on March 25. Despite traders rolling their positions post- expiration, overall option volumes remained subdued. We can observe that Ethereum and Bitcoin weekly trade volumes totalled around $3B and $1B respectively which is below February’s weekly average. Bitcoin spot prices spiked 13% last week despite a large chunk of BTC call options expiring at a strike price between $45–50K. Typically, this is expected to provide upside resistance to spot prices. However, despite options markets gaining traction over the past year, the market is still small and its impact on spot prices remains limited.
Macro Trends
BTC-ETH correlation at highest level since July 2021.
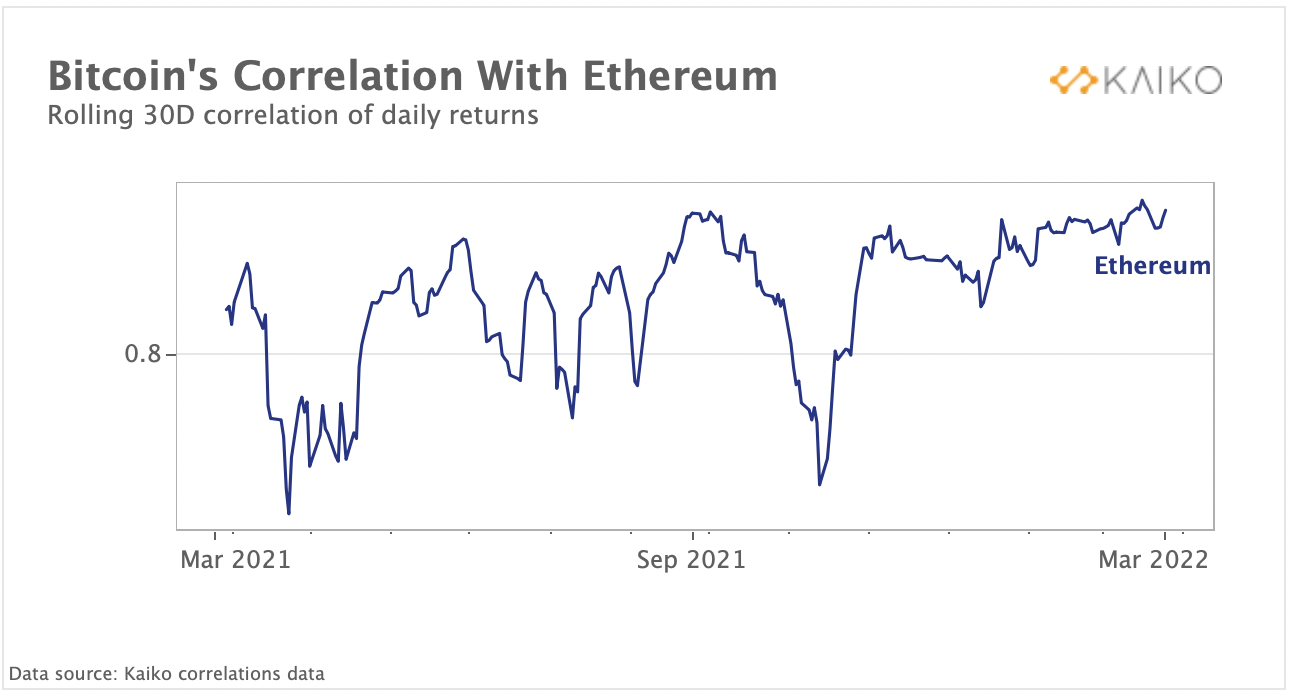
Correlations between assets notoriously converge in times of market volatility. We observe a similar trend in crypto with the 30 day correlation between Ethereum and Bitcoin hitting its highest level since July 2020. The two assets typically tend to move closely together and their correlation has been mostly rising over the past year despite briefly plummeting in April and November.
BITO AUM climbs 11% since start of 2021.
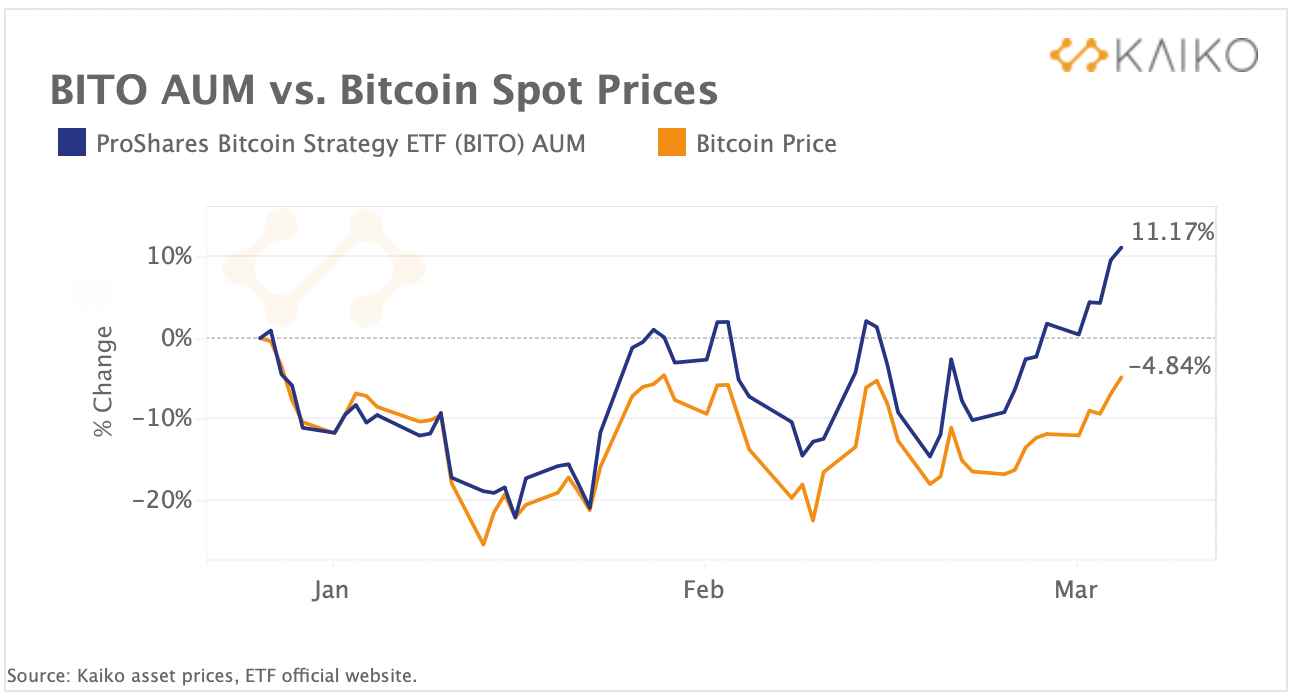
Inflows into Bitcoin-linked investment vehicles have gained traction in March alongside a more moderate crypto market uptick. Above, we chart the percentage change in futures ETF BITO’s assets under management (AUM) alongside the BTC spot price since the start of the year. Although Bitcoin’s price is still down 5% YTD, BITO’s AUM is up 11%. Inflows accelerated in March suggesting improving investment appetite for this type of instrument after investors de-risked their portfolio aggressively in early 2022. Overall, risk assets are off to one of the best rallies on record at the start of a monetary policy tightening cycle. However, stagflation fears are still rampant with the U.S. yield curve — a leading indicator of recession — still close to inversion and the Fed signaling last week that it will deliberately push growth below trend to fight inflation.