Ethereum (ETH) price has outperformed Bitcoin (BTC) for the past four weeks, although ETH/USD price has dropped.
Wave counts and technical indicators from the daily timeframe suggest that it will continue to outperform BTC, reaching highs not seen since 2018.
Technical analysis from the weekly timeframe in the ETH/ BTC pair is mixed. The price has been trading in a range of ₿0.055 to ₿0.078 since May 2021.
A trading range is a neutral sign as price often fluctuates between support and resistance lines before making a final move out of its bounds.
It is possible that the price is trading inside a descending parallel channel. Even so, the support line of the pattern has not been fully validated.
However, unlike the support line, the midline has been validated multiple times (green icon). Therefore, if the price continues to sustain in the upper part of the channel, the possibility of a breakout is very high.
Furthermore, the weekly RSI has mixed results. By using the RSI as a momentum indicator, traders can XEM the market is overbought or oversold to decide whether to accumulate or sell an asset.
If the RSI is above 50 and it is trending up, the bulls have the advantage, but if the indicator is below 50, the opposite is true. The indicator is bullish but still below 50, providing no clue as to the direction of the trend.

Weekly ETH/ BTC Chart | Source: TradingView
The daily timeframe outlook provides a bullish outlook for several reasons.
First, the number of waves shows that the price has bottomed out. Using Elliott Wave theory, technical analysts examine long-term price patterns and investor sentiment to determine the direction of a trend.
According to the number of waves, the price completed the ABC correction structure (white), where wave B has the shape of a triangle.
The fact that the correction ended right at the 0.618 Fib retracement level further supports this possibility.
Next, the daily RSI created a bullish divergence and stayed above the 50 level, another bullish sign.
Therefore, the pair is likely to have bottomed out and a strong rally is imminent.
Since ETH is the largest Altcoin in the crypto market, its rise will cause Bitcoin Dominance Rate (BTC.D) to drop. This could trigger a wave of FOMO into Altcoin in the near term.
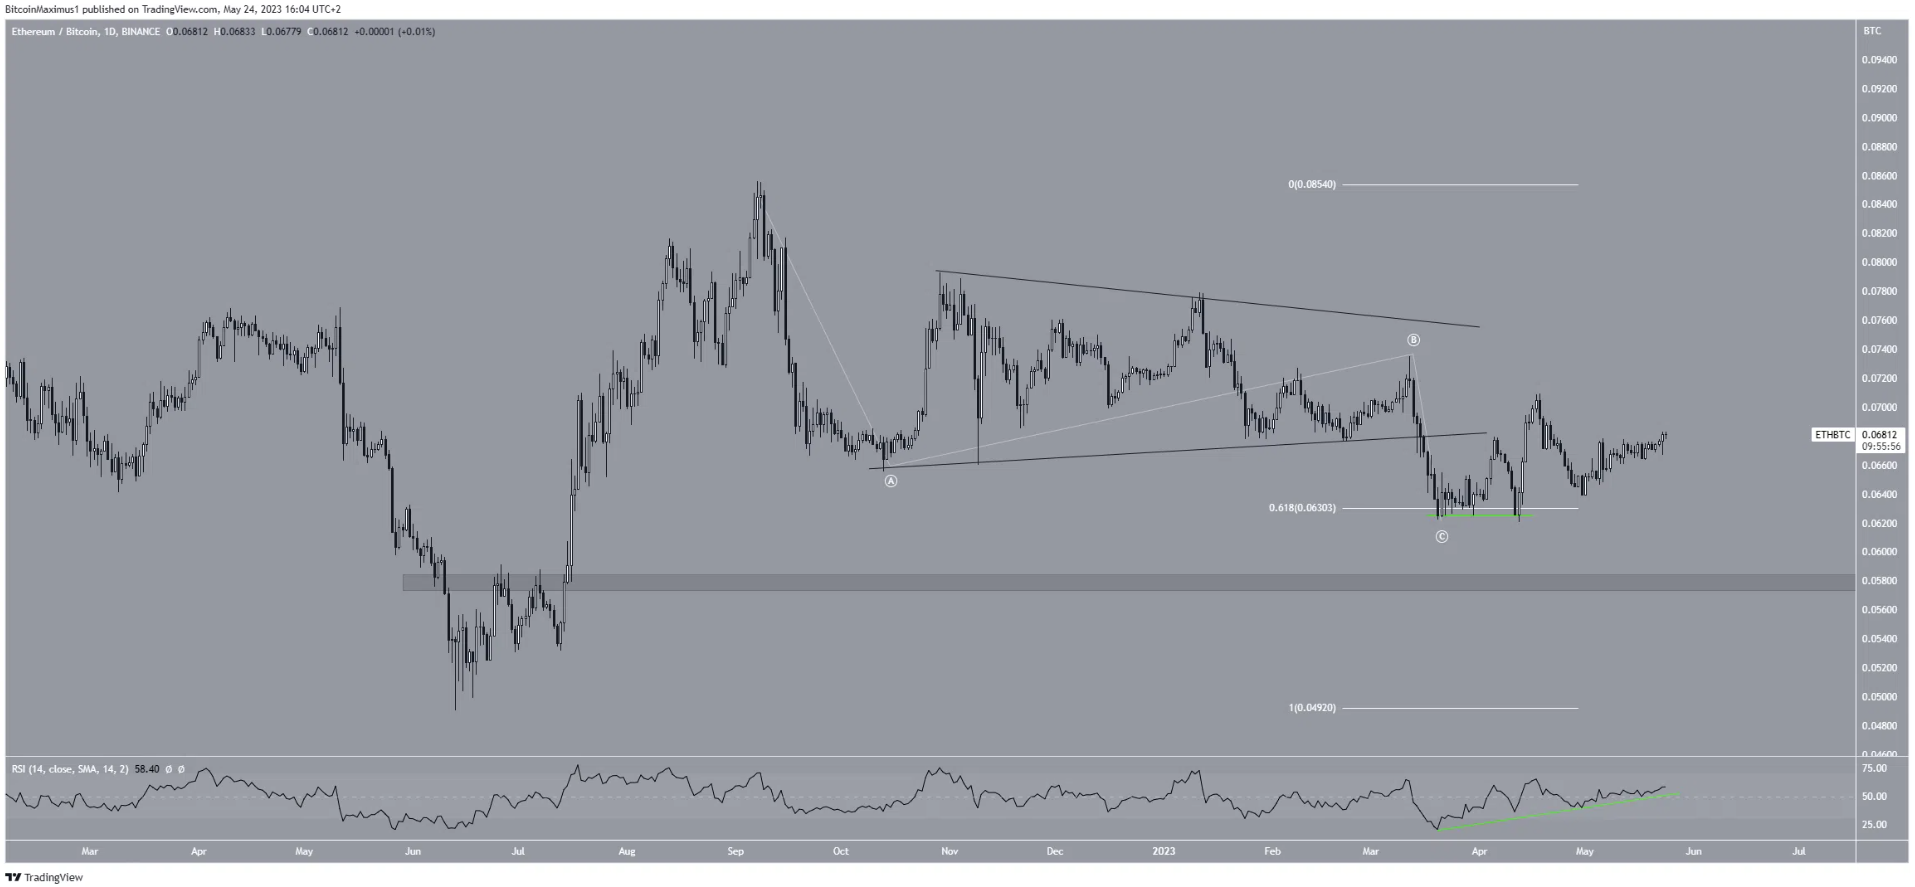
ETH/ BTC Daily Chart | Source: TradingView
Despite this bullish prediction, a drop below the low of wave C at ₿0.062 will mean the trend remains bearish.
In that case, a drop to the ₿0.058 support area would be the most likely scenario.