Bitcoin price is currently pulling back alongside the broader crypto market following a strong move from $20,000 to $29,000 in a matter of two weeks. The sharp rally has the market speculating that a bottom might be in.
If the bottom is indeed in, based on past historical performance, BTCUSD could be back retesting all-time highs within 120 days or less. Find out why below.
Why BTCUSD Could Reach Former Highs In 120 Days Or Less
All markets are cyclical, and crypto is no different. For example, Bitcoin shows cyclical behavior based on its halving event, where the block reward miners receive in BTC is slashed by 50%.
In technical analysis, all kinds of timing-related behavior exists. Another example includes the January Effect, or the concept of selling in May and going away, both representing seasonality in cryptocurrencies and other markets.
Serial correlation, or autocorrelation, is yet another time-based observation where price action correlates with price action from a previous data set in the same asset. An example of this is the phenomenon is that Bitcoin has peaked between November and December three times in a row: in 2013, 2017, and again in 2021.
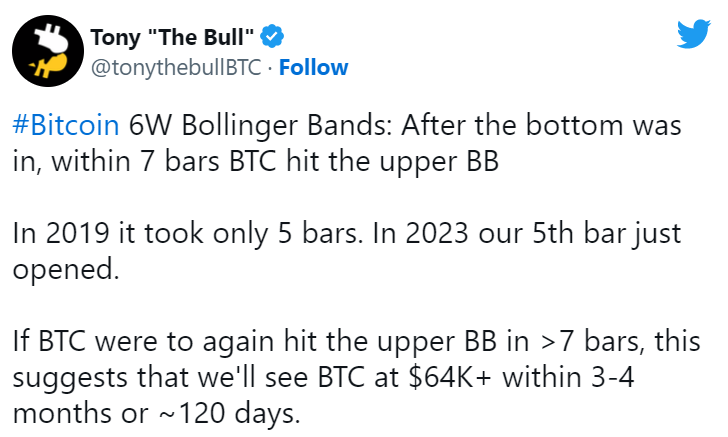
Using the six-week Bollinger Bands and the idea behind serial correlation, it may be possible to predict that Bitcoin price revisits $65,000 per coin in less than 120 days, as past data suggests.
Could Bitcoin Be Back At Former All-Time Highs In A Few Months?
Past price history is not a guarantee of future performance, but from historical data technical analysts can improve the probability of success using such information.
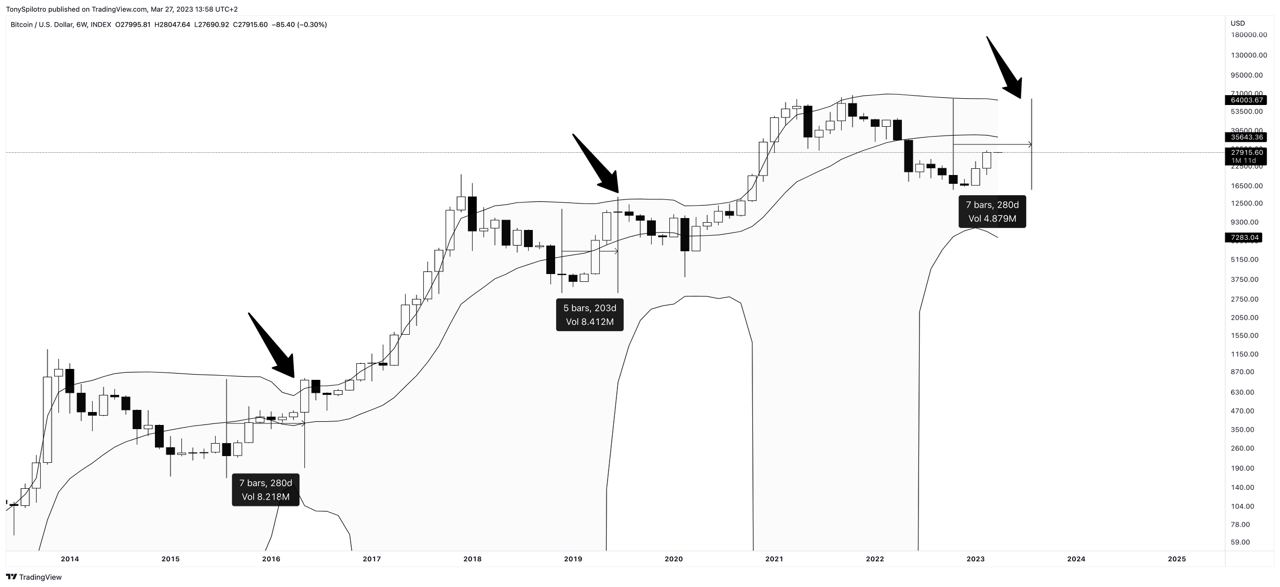
Looking at past bottoms in Bitcoin price on the six-week timeframe, two large white candles always signaled a bottom was in. This represents more than 12-weeks of positive performance, just shy of a full quarter.
Once the bottom was in, Bitcoin made push above the middle-SMA on the Bollinger Bands, and then within the next several candles immediately made a run for the upper Bollinger Band.
In 2015, after the bottom was in, it took seven 6W candles before touching the upper BB. Four years later in 2019, BTCUSD did it in only five 6W candles. Even on the longer end of the two instances, it would suggest that Bitcoin could touch the upper Bollinger Band within 120 days.
What makes this impressive and very different than the past, is the fact that the upper Bollinger Bands on the timeframe is located at $64,000 per coin, or right around former all-time highs set in 2021. Could BTCUSD really be back at former ATHs in less than 120 days?