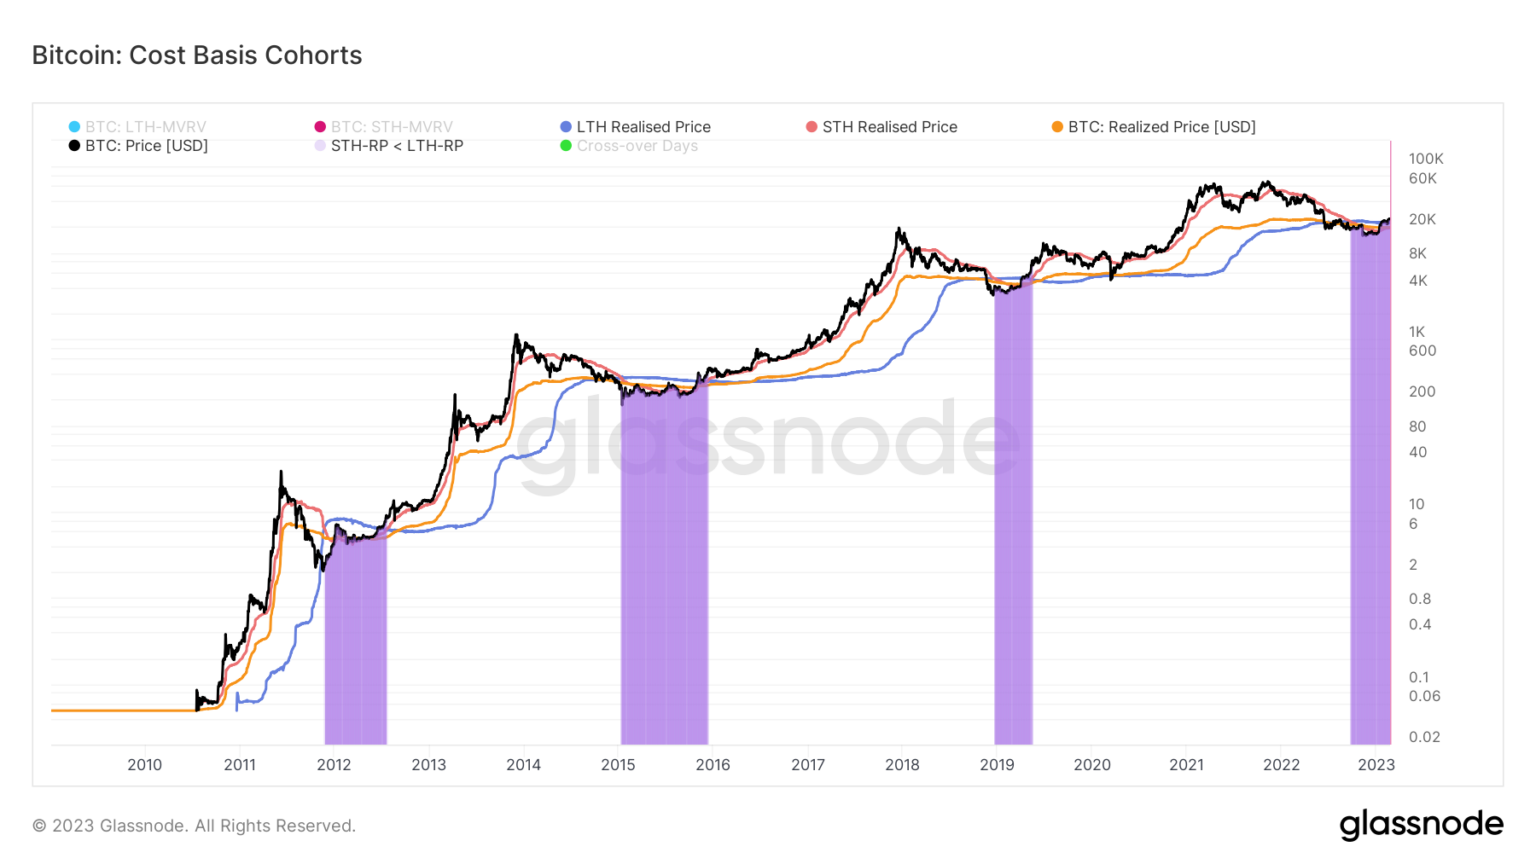
Realized price is a metric often used to determine market movements in bear and bull markets. Defined as the value of all Bitcoins at the price they were bought divided by the number of circulating coins, realized price effectively shows the cost-basis of the network.
⠀
Dividing the network into cohorts can help us reflect the aggregate cost basis for each major group owning Bitcoin. Long-term holders (LTHs) and short-term holders (STHs) are the two primary cohorts driving the market — LTHs are all addresses that held BTC for longer than 155 days, while STHs are addresses that held onto BTC for less than 155 days.
⠀
The LTH-STH cost basis ratio is the ratio between the realized price for long-term and short-term holders. Given the historically different behaviors LTHs and STHs exhibit, the ratio between their realized prices can illustrate how the market dynamic is shifting.
⠀
For example, an uptrend in the LTH-STH cost basis ratio is seen when STHs realize more losses than LTHs. This shows that short-term holders are selling their BTC to LTHs, indicating a bear market accumulation phase led by LTHs.
⠀
A downtrend in the ratio shows that LTHs are spending their coins faster than STHs. This indicates a bull market distribution phase, where LTHs sell their BTC for profit, which STHs buy up.
⠀
An LTH-STH cost basis ratio higher than 1 indicates that the cost basis for LTHs is higher than the cost basis for STHs. This has historically correlated with late-stage bear market capitulations that turned into bull runs.
⠀
⠀
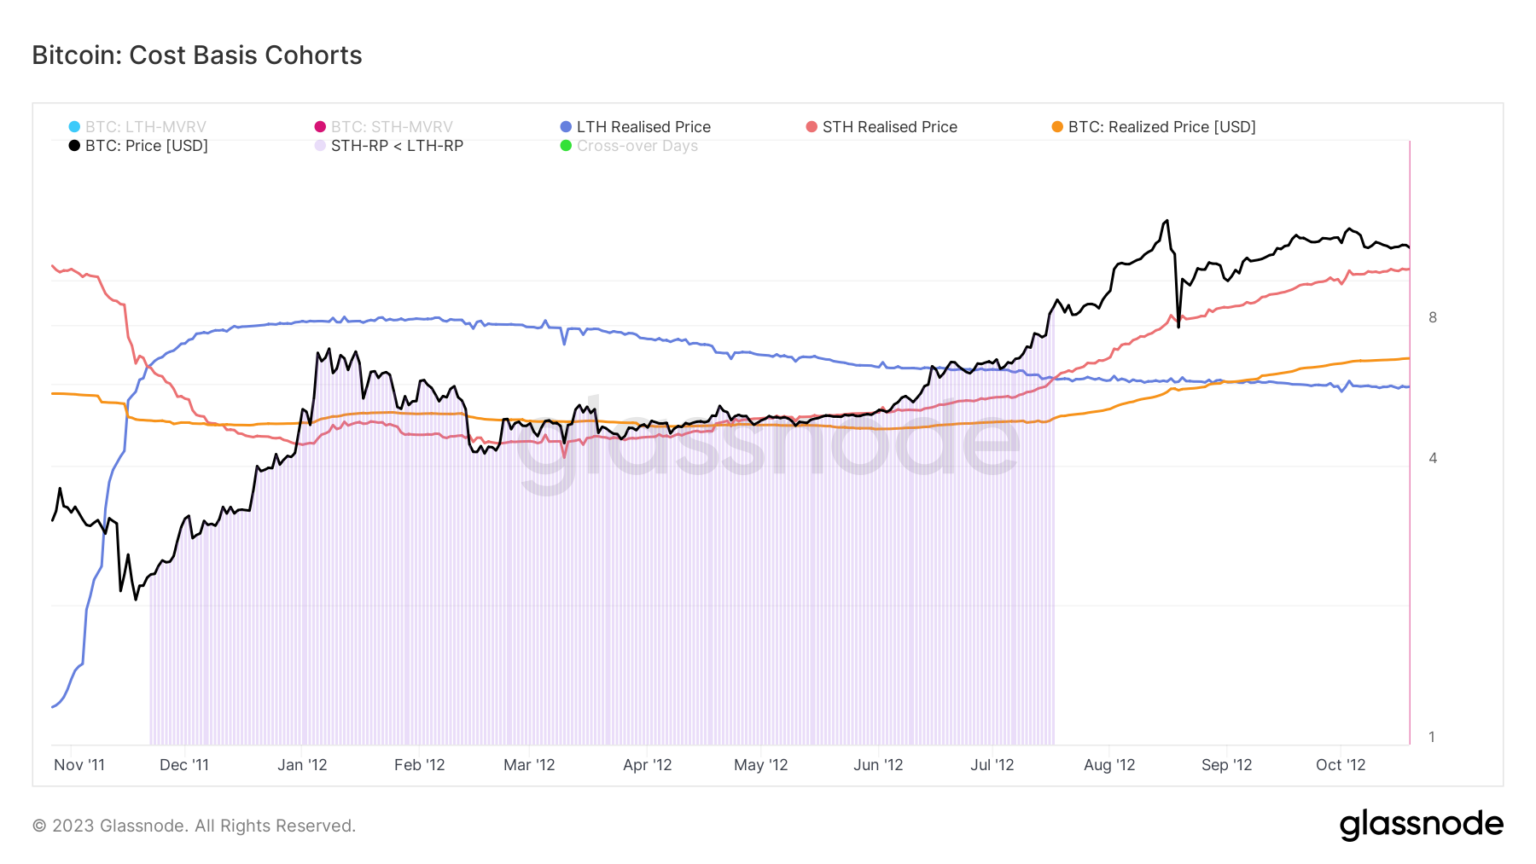
2011
⠀
During Bitcoin’s first bear market in 2011, the STH realized price went below the LTH realized price. This trend reversal marked the beginning of a bear market which started on Nov. 22, 2011 and lasted until Jul. 17, 2012.
⠀
Long-term holders accumulated BTC throughout the bear market, dollar-cost averaging (DCA) and bringing their cost-basis down. Buying during suppressed prices created a new influx of short-term holders that pushed Bitcoin’s price up. This increase in STH accumulation caused the STH realized price to rise, increasing the overall cost-basis of the network with it.
⠀
⠀
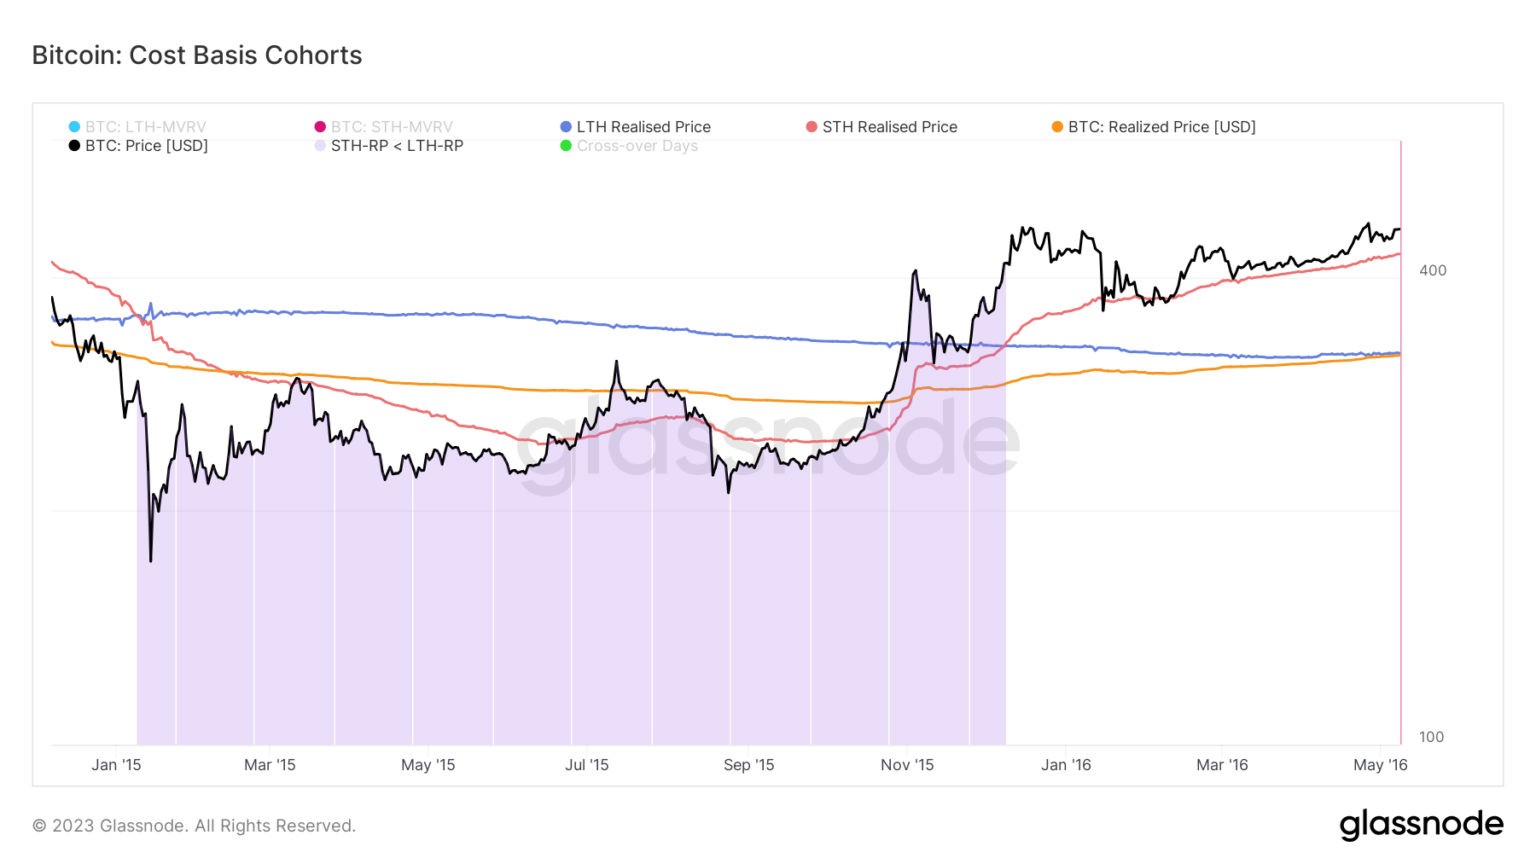
2015
⠀
The 2015 bear market followed a similar pattern. On Jan. 8, 2015, the STH realized price dropped below the LTH realized price, triggering a bear market that lasted until Dec. 08, 2015.
⠀
While Bitcoin’s price began recovering in early November 2015, it wasn’t until the beginning of December that the STH realized price broke above the LTH realized price. At the time, the overall cost basis of the network increased slightly, triggering a bear market reversal that saw Bitcoin’s price go past $400.
⠀
⠀
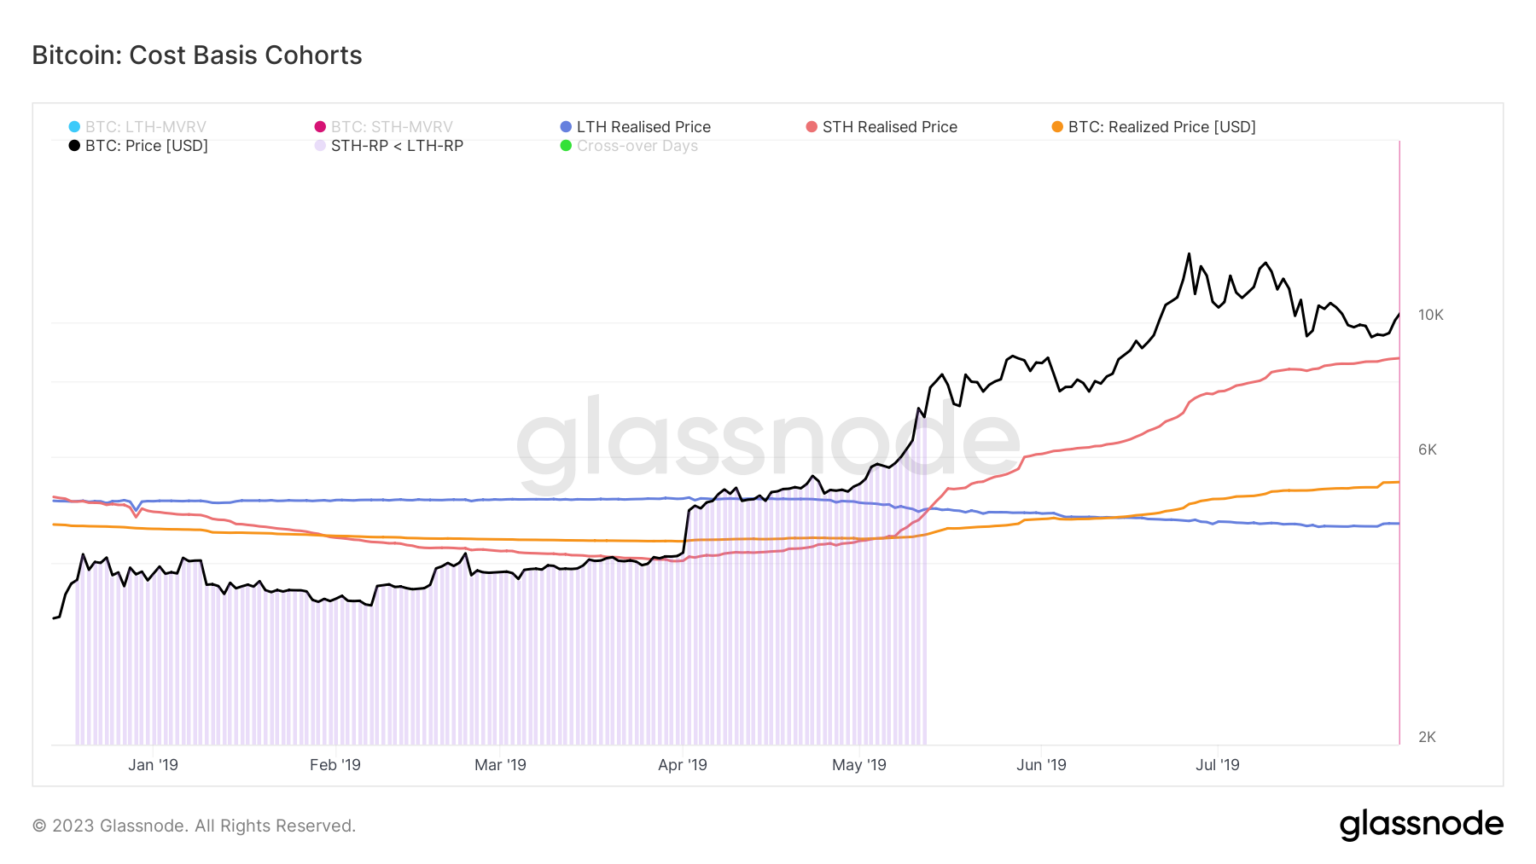
2018
⠀
Bitcoin’s coveted rally to $20,000 in late 2018 ended when the STH realized price declined. It dropped below the LTH realized price on Dec. 20, 2018, pushing Bitcoin’s spot price way below its realized price.
⠀
The bear market ended on May 13, 2019, when the STH realized price bounced back above the LTH realized price.
⠀
⠀
2022
⠀
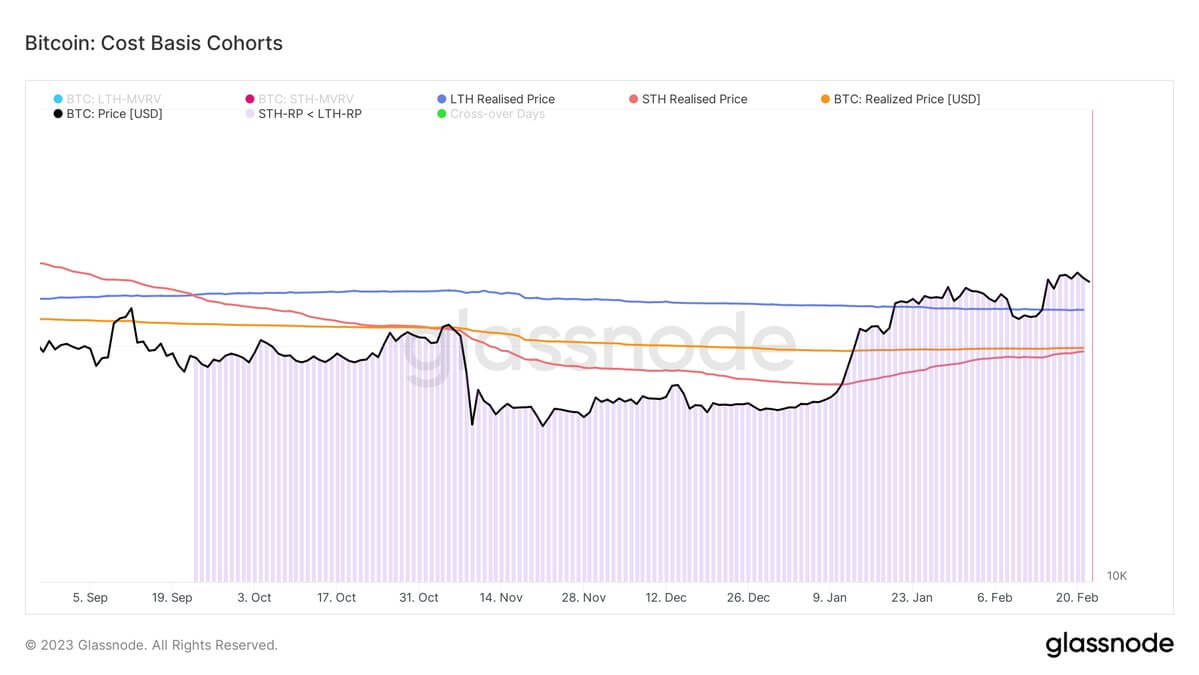
The STH realized price began descending at the beginning of September 2022, dripping below the LTH realized price on Sept. 22, 2022. It continued downward until Jan. 10, 2023, when it began a slow and steady rebound that almost brought it on par with Bitcoin’s realized price.
⠀
The STH realized price currently stands at $19,671, while the LTH realized price is $22,228. Bitcoin’s realized price is $19,876.
⠀
⠀
Data analyzed by CryptoSlate showed that 4-year cycles in the Bitcoin market end when the STH realized price flips both Bitcoin’s realized price and the LTH realized price. This creates a measurable market FOMO that triggers a parabolic run.
⠀
This flippening happened in 2011 after 9 months in a bear market, in 2015 after 11 months, and in 2019 after 6 months. It’s been 5 months since the STH realized price dropped below the LTH realized price in 2022.