Bitcoin price is experiencing a slight pullback to retest former resistance potentially flipped as support. If the top cryptocurrency by market cap holds the level and moves up from here, it will continue to follow a fractal pattern that has appeared each time BTCUSD 3D price action passed through the Ichimoku cloud.
Let’s take a look at the technical tool, the fractal, and past instances of the same setup.
“Time” For Yet Another Bitcoin Price Fractal
The Ichimoku is one of the few technical tools that factors in time and not just price in its calculations and indicators. For example, the Chikou span is back-plotted by 26 periods to show where key levels took place. The cloud itself is made up of two spans – Senkou span A and B – which are forward-plotted ahead by 26 periods to provide potential areas of future support and resistance.
The result is a historical and future, graphical view of potential areas of interest. The Ichimoku features more individual indicators still. The Tenkan-sen and Kijun-sen focus on the current price action, and signal when Bitcoin price is bearish or bullish. The Tenkan-sen in blue is crossed above the Kijun-sen in red, and price is above both and has penetrated out of the cloud.
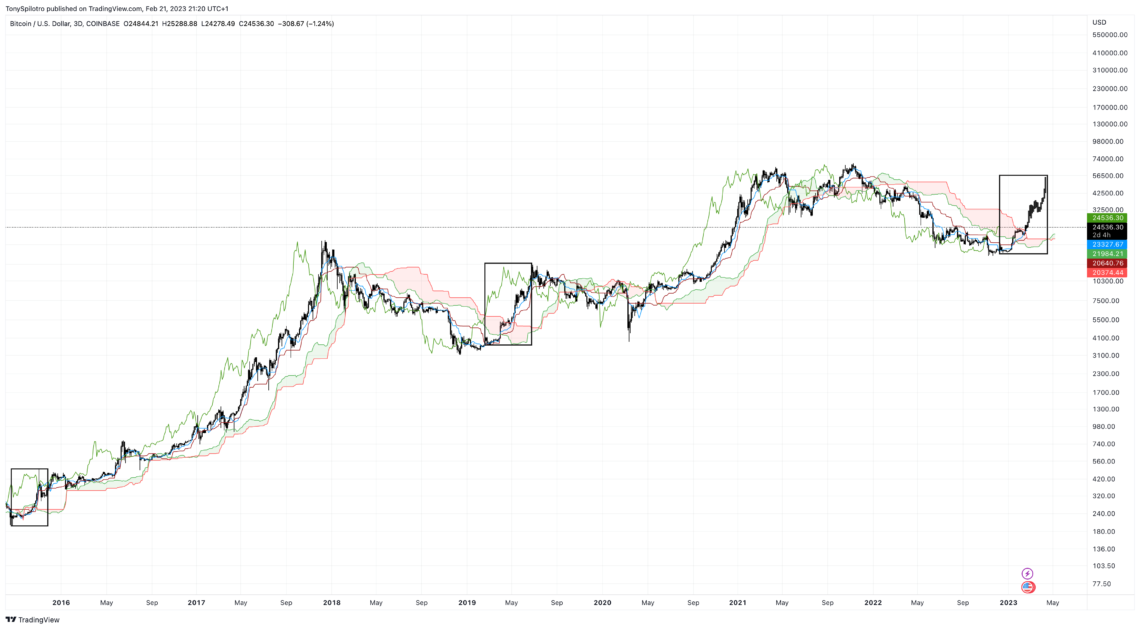
Each time these conditions have been met, the Bitcoin bear market bottom was in and the crypto market kept on climbing. It also resulted in a repeating fractal, that thus far BTCUSD 3D charts are following eerily well. In addition to the price action matching closely, several technical tools suggest the same level of strength by bulls.
Lightning Strikes Twice With Several Technicals
If the fractal continues to be followed from here, Bitcoin price could nearly double in less than 30 days. Making it out of the 3D Ichimoku cloud in 2015 resulted in a 2x rally before a pullback. In 2018, the same thing happened. Will it happen again now?
Zoomed in and with the fractal layered over the chart, we can get a closer view of the similarities. After an initial rally, Bitcoin price consolidated at the top of the 3D Ichimoku cloud, only to eventually push through it. But it isn’t just the Ichimoku pointing to a similar setup, either.
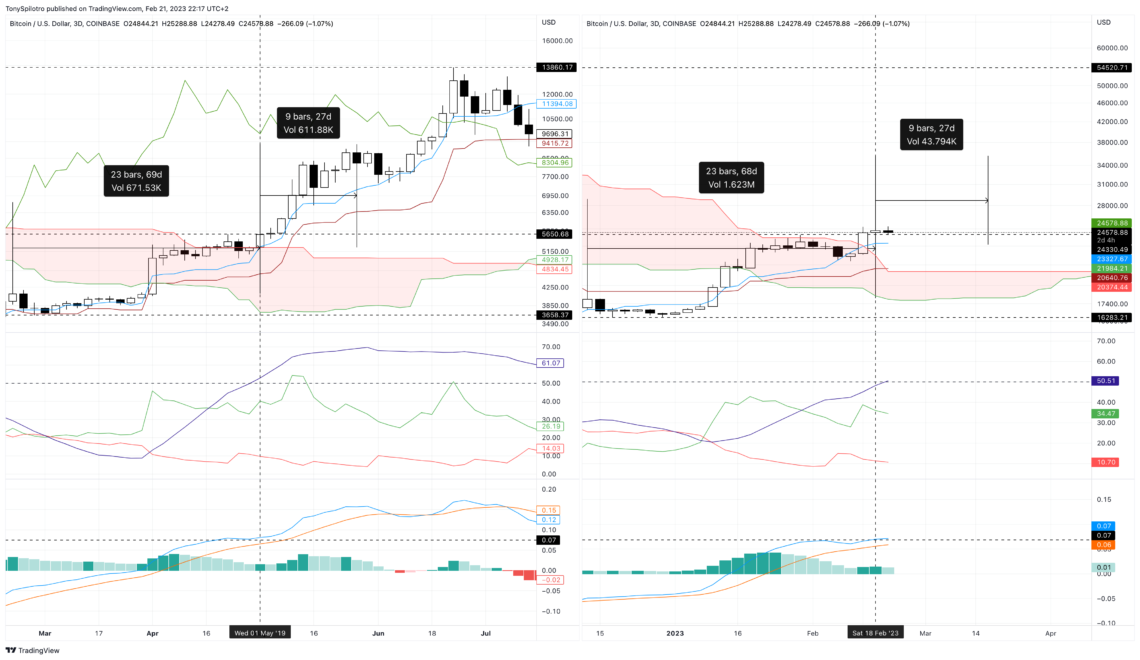
The Average Directional Index is at the same exact level as 2019. The ADX provides a gauge on underlying trend strength, suggesting bulls are gaining steam. Shockingly, the LMACD below it is also at the same exact 0.07 reading from 2019.