As the cryptocurrency market records modest gains compared to the previous week, certain historical chart patterns indicate that the next three years could be not only bullish for its largest asset by market capitalization – Bitcoin (BTC) – but also reaching new highs.
⠀
Specifically, Bitcoin has finished the bear market in 14 months and the bull market in 33-35 months, in a chart pattern that has occurred since 2013, as observed by the pseudonymous cryptocurrency analyst known on Twitter as Trader Tardigrade in a post from February 20.
⠀
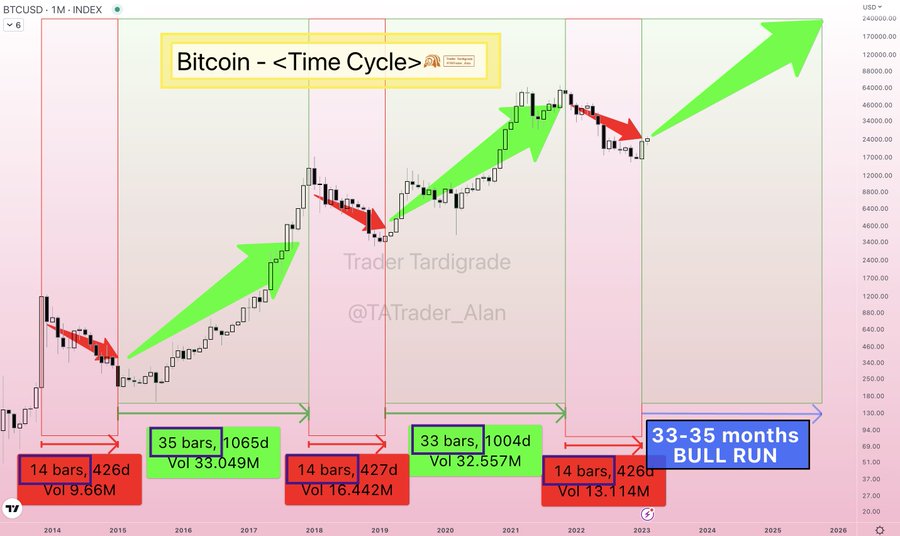
Bitcoin historical cycles analysis. Source: Trader Tardigrade
⠀
Historical patterns
⠀
Indeed, Bitcoin’s bear market of 2014 lasted for 426 days or 14 months, followed by 1,065 days or 35 months of bullishness that started in early 2015 and hadn’t ended until 2018. Then a bearish period ensued that lasted for 427 days or 14 months, upon the end of which a bull market of 1,004 days or 33 months began.
⠀
In mid-2021, another bear market started, which ended at the beginning of 2023, thanks to the renewed optimism in the industry. Should the crypto expert’s analysis prove correct, and history repeats itself this time around as well, it means that the crypto sector is in for another 33-35 months of the bullish rally, potentially aiming for $220,000 by mid-2026.
⠀
Meanwhile, the flagship decentralized finance (DeFi) asset was at press time changing hands at the price of $24,872, recording increases on all of its charts, including gains of 0.77% on the day, 14.2% across the previous week and 9.54% over the past month.
⠀
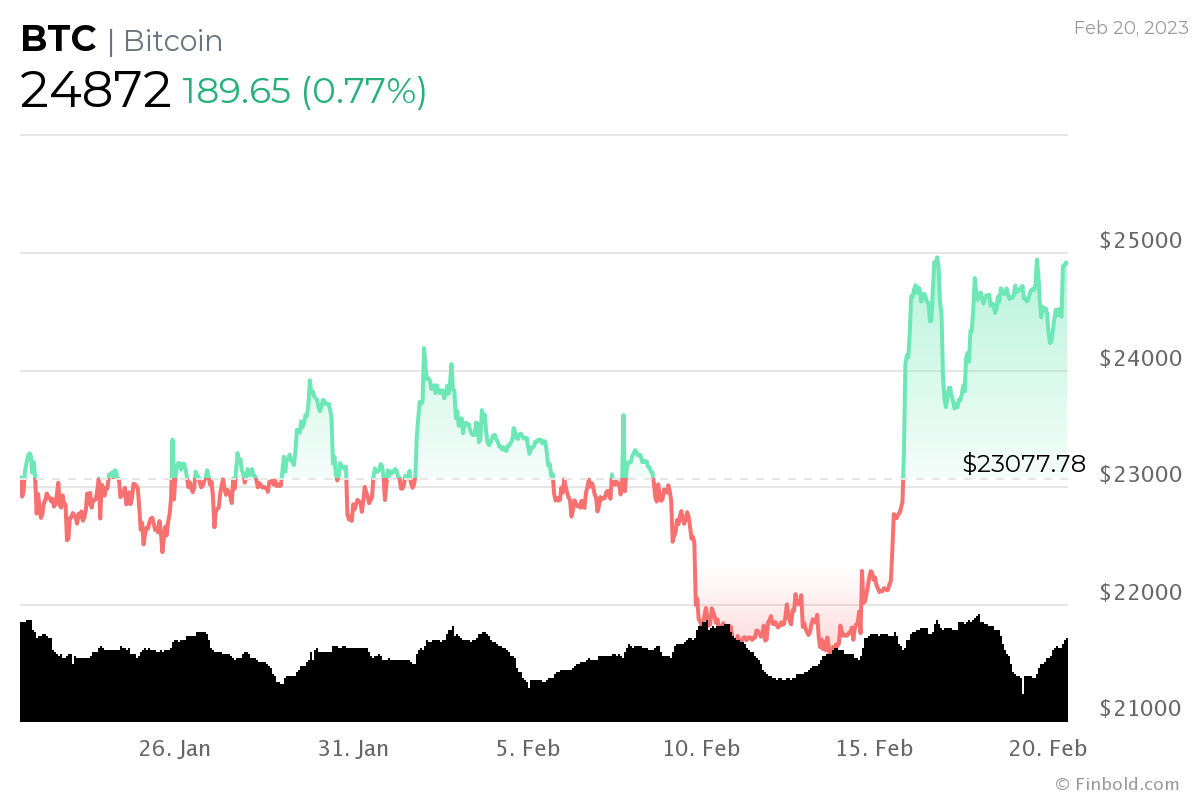
Bitcoin 30-day price chart. Source: Finbold
⠀
In terms of its nearer future, Bitcoin seems set upon a bullish rally this week as well, as it targets the $25,000 goal upon capitulating and then forming a foundation for the next leg up, the pattern which has often repeated itself before.
⠀
At the same time, PricePredictions’ machine learning algorithms indicate only a slight increase in the price of the maiden digital asset by March 1, as the sentiment on the 1-week gauges remains positive, Finbold reported earlier.
⠀
Disclaimer: The content on this site should not be considered investment advice. Investing is speculative. When investing, your capital is at risk.