Author: Insightful Commentary
Citi Global Research released a commodities tail risks report this month, with the core thesis being: the traditional supply-demand analysis framework has broken down. Geopolitical, climate, and technological shocks are shifting from being "once-in-a-decade" events to becoming normalized. Investors must focus on low-probability, high-damage extreme scenarios.
Core summary:
1) US-Iran conflict evolves from a short shock into multi-year damage to Gulf region oil production capacity, pushing crude prices above $150, wholesale refined product prices above $200, and US retail gasoline prices persistently at $6+/gallon.
2) Escalation of Russia-Ukraine war leads to renewed restrictions on oil & gas exports: The positive impact on the global gas market could be more significant than for oil.
3) Stockpiling of critical minerals intensifies: Pushing copper prices to $20,000/tonne or higher.
4) Gold price falls another 15-20% short-term, before potentially doubling.
5) Extreme El Niño and other adverse weather: Driving agricultural price surges, e.g., cocoa back above $10,000/tonne.
6) AI Boom & Bust: Bullish for power, gas, uranium, and electricity infrastructure metals (Cu, Al) on one hand; also bullish for gold.
7) Trade War Hits US Farmers Again: US-China trade war restarts, affecting US ag exports, potentially pushing corn below $4.2/bu and soybeans below $10/bu.
8) With Russian 'Power of Siberia 2' pipeline gas flowing to China, the 2030 LNG glut becomes more severe, pushing global LNG prices (JKM, etc.) to $5-6/mmbtu.
9) Monroe Doctrine Goes Extreme: US blocks all oil exports from American countries, pushing global oil above $100/bbl while US benchmarks potentially discount >$30/bbl.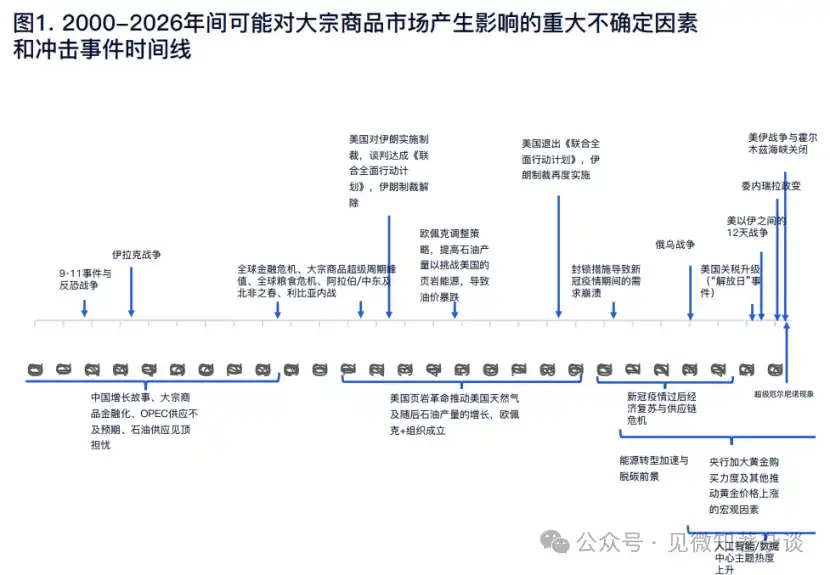
H2 2026 Potential Risks – A 1970s-style Oil Crisis Redux and Other Risk Factors
Commodity pricing has entered an era where geopolitical, climate, and technological shocks frequently overwhelm traditional S&D analysis, compressing "once-in-a-decade" events to every 1-2 years; highly concentrated supply chains (Middle East oil, Russian gas, Chinese critical minerals, Black Sea grain) make regional disruptions easily escalate into global price shocks, and government intervention has expanded from embargoes to sanctions, export controls, strategic stockpiling, and industrial policy, with Trump administration policies adding an extra layer of uncertainty.
Geopolitics re-emerged as dominant post-2010s, with two new layers of disturbance added in the 2020s – Super El Niño/La Niña shocks from the climate side impacting agriculture, water, power, transport; and AI & decarbonization from the tech side boosting long-term demand for Cu, U, gas, power while embedding bidirectional risks from an AI bubble burst. War, sanctions, climate, pandemics, tech shifts are now core analytical items alongside S&D and inventory. Examples like WTI negative price, Ni >$100k, European gas 10x surge in recent decades were driven by abnormal events rather than S&D imbalances.
Therefore, forecasting cannot just focus on base cases; it must supplement with a set of "low-probability, high-impact, under-priced by the market" wildcards. This Citi report lists nine extreme scenarios for H2 2026 and beyond (US-Iran prolonged supply cut, Russia-Ukraine gas tightening, mineral hoarding, gold price crash then double, super El Niño, AI boom/bust, US-China ag trade war, Power of Siberia 2 crushing LNG, Monroe Doctrine blocking Americas oil), intended to supplement the existing base/bull/bear framework, reminding investors to stress-test the least prepared-for directions.
The above is the author's note. Let's look at the specific scenarios now.
1: US-Iran conflict evolves from short shock to sustained multi-year disruption of Gulf oil capacity
(Probability: Low | Impact: Very High)
How it gets there: If the conflict focuses on and escalates to striking Iranian public infrastructure (including its power plants and grid) or involves ground troop operations, one plausible scenario is that Iran would retaliate by damaging oil production infrastructure in various Gulf producer countries.
This could lead to Gulf production declining for many months or longer, not to mention export flows via the Strait of Hormuz. Alternatively, if the Strait of Hormuz remains closed through H1 2027 due to persistent threats, the resulting loss of oil and gas supplies would be equivalent to a long-term 6-12 month or longer shutdown of energy infrastructure.
The US-Iran conflict has already led to high volatility in crude and product prices, also spilling over to gas, metals, fertilizers, and other commodities affected by the region's production and Hormuz export flows.
From the '12-Day War' in June 2025 (US-Israel strikes on Iranian nuclear facilities) to the conflict onset in late Feb 2026, to a fragile ceasefire and MoU signed in June 2026, and renewed military escalation in July 2026, we've seen oil & product prices first spike, then retreat, then spike again.
However, so far, there has been no sustained damage to energy production infrastructure, so supplies should recover, depleted inventories refilled, and the market normalize once conflict ends.
Our base case is that both the US and Iran wish to avoid crossing the red line of causing long-term damage to energy infrastructure – whether located in Iran or surrounding Gulf countries.
In contrast, this scenario constitutes a more extreme bull case that could only materialize if that red line is crossed, resulting in a large drop in Gulf producer output for many months or years, or a similarly sized supply disruption from a prolonged Hormuz blockade.
Additionally, other related variables could add on top or overlap, including not just Hormuz disruption but also Bab el-Mandeb disruption, plus a potential US oil/products export ban.
This could involve Red Sea route disruption via the Bab el-Mandeb as Iran-aligned Houthis in Yemen regroup, following the end of a fragile ceasefire with Saudi Arabia.
And a concerned US White House may impose restrictions on US crude and/or product exports to lower domestic prices, but this would drive global prices higher.
Market impact: If this indeed occurs due to miscalculation or other reasons, then oil supply could be out for months or years, the resulting gap cannot be filled by increased output elsewhere, and inventory drawdowns can only last so long, after which prices would rise parabolically, significantly suppressing demand.
As we've shown before, the all-in real crude price has reached as high as $180-200/bbl as global oil inventories became very low, e.g., measured in days of demand cover.
Thus far, while Hormuz closures sometimes led to ~12-13 mb/d loss (and other market responses offsetting that, including ~5-6 mb/d increased flow via alternative routes, ~4-5 mb/d drop in China crude imports, ~1-2 mb/d coordinated IEA SPR releases, and ~2-5 mb/d demand destruction), the market previously anticipated this to be a V-shaped supply shock, meaning the global market was in surplus before.
Post-conflict, the market would quickly return to surplus, allowing inventories to be rebuilt.
A sustained reduction of 5-10 mb/d in oil/liquids supply (5-10% of global total) would require demand rationing on the scale of the 2020-22 Covid lockdowns. A simple estimate using an oil demand price elasticity of -0.05 would require a price increase of 100-200%, i.e., a composite oil price above $200/bbl.
Even with US-Iran tensions escalating in mid-July 2026, Brent has recovered to ~$88/bbl, while Nymex diesel >$170/bbl (over $4/gal, not counting ~$1.4/gal retail margin, so retail diesel >$5.4/gal), and Nymex gasoline >$140/bbl (~$3.3/gal, not counting $1/gal retail margin, so retail gasoline ~$4.3/gal).
If wholesale gasoline and/or diesel reaches >$200/bbl, retail price would be ~$4.75/gal, and with retail margins, national avg diesel & gasoline prices could exceed $6/gal.
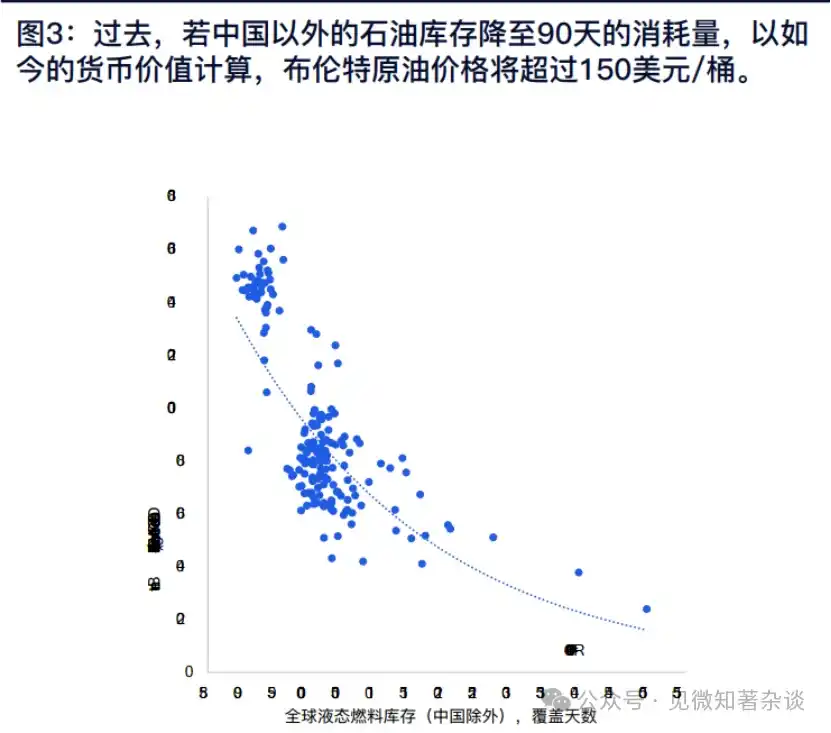
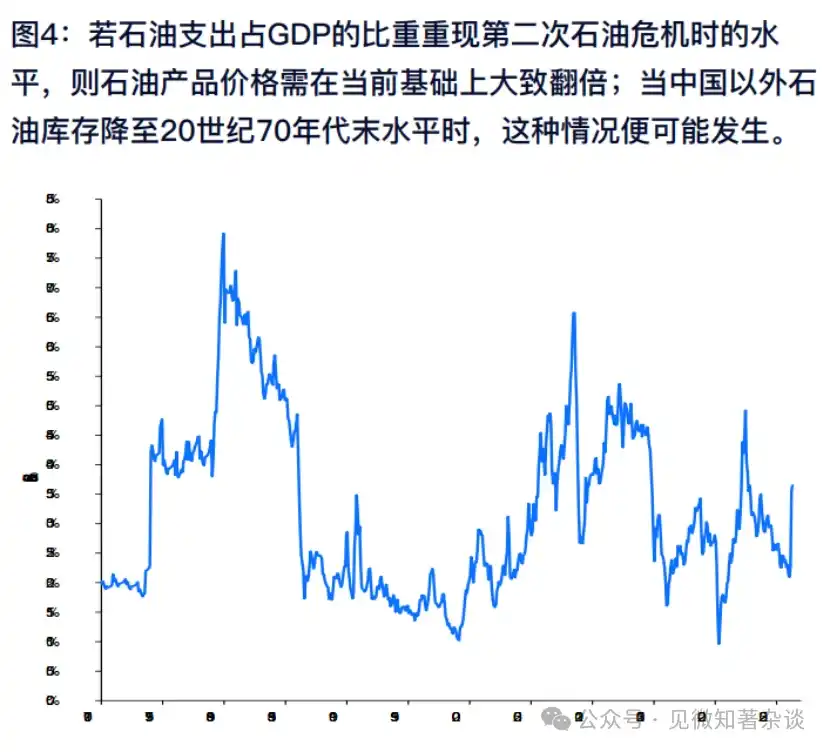
During the 2nd oil crisis of the 70s/80s, ex-China oil inventories fell to $200/bbl.
We previously projected that a sustained Hormuz closure causing a 7-8 mb/d global supply gap, with 80-90% of inventory draw occurring ex-China, could push ex-China oil & product inventories below 70 days of consumption by early 2027 – levels last seen during the 2nd oil crisis of late 70s/early 80s.
If oil spending as % of GDP again reaches 8%, it would imply the composite oil price needs to double from current levels, i.e., >$200/bbl. As of July 2026, total oil inventories ex-China still cover ~94 days of consumption.
However, several differences vs the 1970s experience are notable: strategic reserves were limited then, and reportedly, despite the supply gap, strategic reserves were being added, reducing available commercial stocks and exacerbating tightness.
That's less likely this time as OECD & China could tap existing strategic reserves to cushion the shock.
Also, oil intensity of GDP growth is much lower now. On the other hand, while total oil stocks remain fairly ample, product inventories are extremely low.
Despite high crude stocks, this could cause product prices to rise much more than crude vs past periods.

Demand restraint measures could help reduce oil use, while long-term energy transition could also accelerate, though the short-term economic damage could be severe.
Refer to various national energy-saving and structural policies listed in IEA's 2026 Energy Crisis Response Tracker. As energy transition and (fossil fuel) energy security goals increasingly align, this may signal long-term structural decline in oil demand.
However, it offers little relief from short-term sustained high oil spending, which would burden the global economy heavily.
2: Russian oil & gas export restrictions amid escalating Russia-Ukraine war
(Probability: Medium | Impact: Differentiated – higher for gas & refined products than oil)
The Russia-Ukraine war has lasted over four years and likely will continue for months more. Hopes for a negotiated settlement increased with President Trump's inauguration, as the US seeks to be a key mediator between the sides.
While a negotiated solution remains possible, hostilities continue, and there's still potential for further restrictions on Russian energy exports.
As a next possible step in economic confrontation with Russia, we consider a wildcard scenario: existing Russian oil & gas exports face further restrictions, tightening global energy supply and putting energy prices under upward pressure again.
The impact would be greater on gas markets and refined products than on crude oil.
Overall, stringent restrictions could tighten the global crude market by ~2 mb/d, less than 2% of global total, but could cause a near 70 bcm/year shortage in gas, ~8% of global LNG and European gas market.
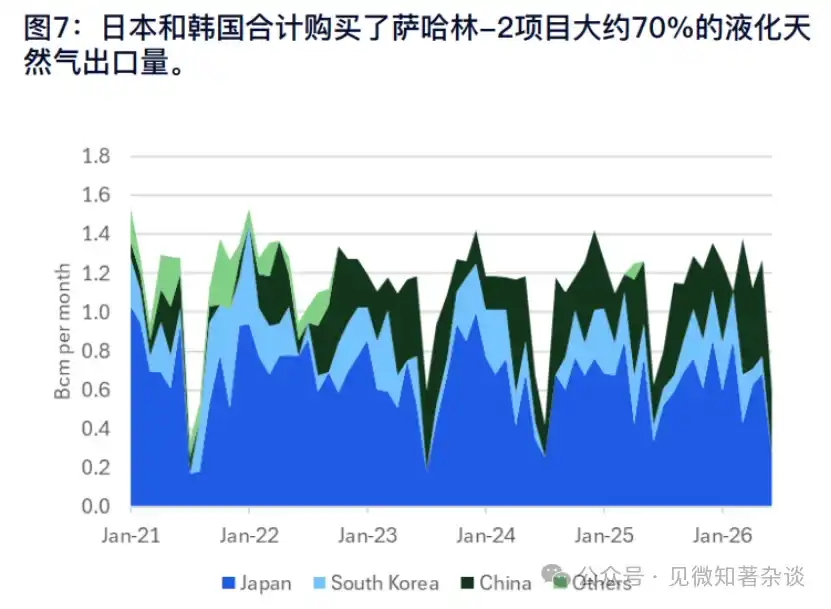
For oil products, Ukrainian strikes on Russian refineries have already caused fuel shortages, forcing Russia to import gasoline and announce a diesel export ban. These resemble consequences of a ban on purchasing Russian products.
Russia's diesel exports were ~800 kb/d in 2025, but recently diesel crack spreads rose due to inability to export. The impact of escalation on products is to further tighten an already tight global market, rather than cutting exports again – as exports are already collapsing – plus winter is a few months away in the Northern Hemisphere.
With low European gas inventories for heating and similarly low global diesel stocks (another name for heating oil), utilities and governments will need to compete differently to ensure sufficient supplies.
Some buyers, fearing longer-lasting diesel and gas shortages, might step up purchases or even hoard.
For crude, the US non-renewal of the Russian crude buying waiver in mid-June essentially leaves China as the only effective buyer, perhaps India. Even with past US restrictions tightened, certain Chinese entities kept buying. India reduced imports post-Feb 2022 war from >2 mb/d but not to zero, per vessel tracking.
For pipeline gas and LNG, a ban on Russian exports would likely cause severe supply loss to the global market and sharply spike TTF and JKM prices.
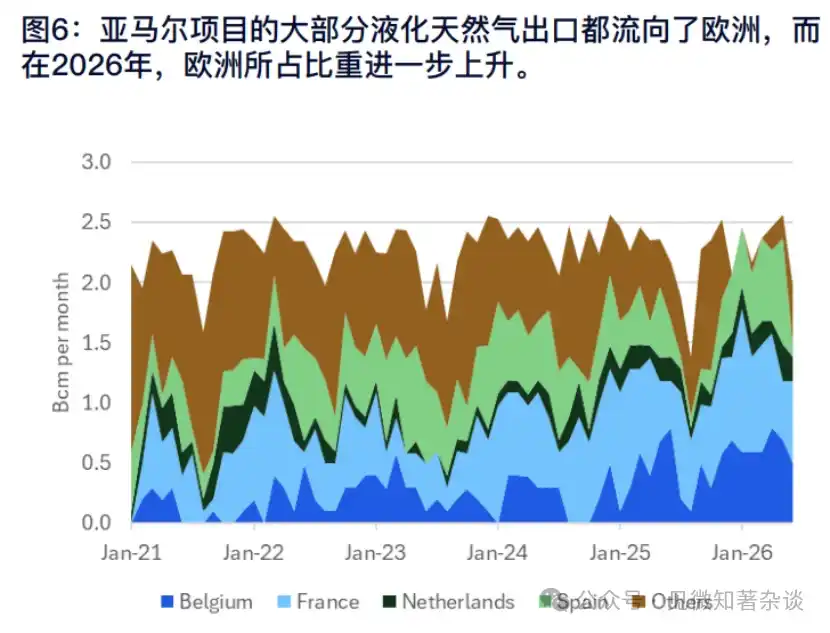
For LNG, Russia exported ~44 bcm in 2025, ~7% of global LNG supply, mainly from Yamal LNG and Sakhalin-2. Europe took ~75% of Yamal exports, with France, Belgium, Spain the largest buyers.
In 2026 so far, Europe's share rose to ~90% as more Russian cargoes stayed in Europe rather than being re-exported due to Middle East supply disruptions from Hormuz closure. In contrast, Sakhalin-2 mainly serves Asia due to proximity, with Japan and South Korea combined >70% of its annual exports.
Thus, a global ban on buying Russian LNG would require >30 bcm/year of Russian supply currently sold ex-China to be redirected or replaced. China is likely the only major market willing and able to continue taking Russian cargoes.
However, given shipping/logistical constraints and limited contractual flexibility for Chinese buyers under existing long-term LNG contracts, China is unlikely to absorb all displaced volumes. The result would likely be a notable loss of global LNG supply, tightening balances and putting upward pressure on TTF/JKM.
For pipeline gas, a purchase ban would be even more disruptive than for LNG, as physical pipeline limitations make affected supply nearly impossible to redirect elsewhere.
Russia exports >70 bcm/year of pipeline gas to markets outside China, including Europe, Turkey, and other FSU countries.
In 2025, Europe and Turkey imported ~17 bcm and ~20 bcm of pipeline gas respectively. Replacing this combined 37 bcm/year supply for these two markets would likely require substantially increased LNG imports, further tightening global LNG balances, intensifying competition between European and Asian buyers, and lifting spot prices.
3: Hoarding of critical minerals pushes prices higher, e.g., copper >$20,000/t
(Probability: High | Impact: Varies by commodity & hoarding scale)
If global nations race to build stocks and control the flow & access to critical strategic minerals, prices will need to rise enough to generate surplus, support inventory accumulation, and incentivize capacity reshoring possibly at higher costs.
How it gets there: Governments could massively push to accumulate stocks of critical minerals in response to a significant escalation of geopolitical tensions or strategic industry competition, pushing metal prices including copper higher.
In recent years, policymakers' concerns over resource security have risen markedly amid growing global geopolitical & trade tensions and recognition of critical roles of certain metals in defense and emerging strategic industries like energy transition and AI.
For copper, the large shift of global refined copper stocks to the US in 2025-early 2026 was driven by market fear of US S232 tariffs on copper – part of US government efforts to reduce import reliance on critical minerals and incentivize domestic production.
Import-dependent nations may wish to build stocks and reshore capacity, also tempting resource-rich commodity exporters to restrict supply (or threaten to) to maximize economic and political gains, further tightening global supply.
Expanding metal capacity takes years, while building domestic stocks offers short-term buffer and has precedent. China's SRB is believed to hold large strategic copper stocks, though size unknown.
In early 1960s, US strategic copper stocks were ~10 months of domestic consumption, over 900 kt. Investors and supply chain participants may also build stocks independently or seek physical asset exposure ahead of government action. If markets start anticipating large-scale strategic buying, that could amplify the scale and speed of inventory accumulation.
If governments begin accumulating critical materials, OEMs, producers, and financial investors may step in ahead or after, either to secure stable supply, hedge against industrial policy volatility, or allocate to physical assets in an increasingly uncertain macro environment.
We already see governments taking steps to accumulate strategic commodity stocks. This includes the US 'Project Vault' (proposing $12 bn for critical industrial commodities stockpiling); EU announcing €3 bn for securing critical minerals; and a Chinese industry association calling for increased copper reserves via the state reserve system.
For now, the funds committed by US and EU might move smaller markets like rare earths but unlikely significantly for a market like copper.
Market impact: This wildcard envisions more funds directed toward global stockpiling programs and raw material inventory accumulation as policymakers' focus on resource security deepens. Using copper as an example, this illustrates how prices for such minerals could be significantly pushed higher.
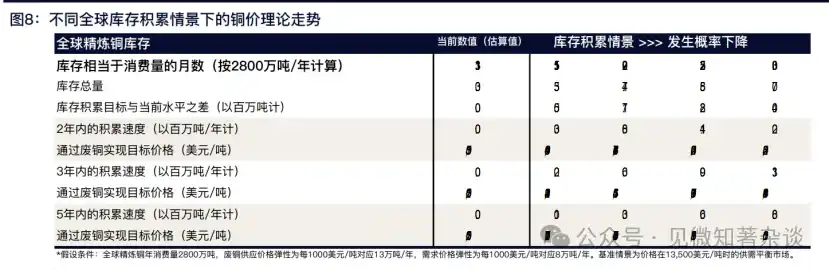
We assume current global refined copper stocks ~3 mln tonnes (with large margin of error, including China SRB stocks), equivalent to ~1.3 months of global consumption. To raise global copper stocks to a 3-month cover level, the world would need to accumulate an additional ~4 mln tonnes of copper; if done over two years, that's ~2 mln tonnes/year.
Short-term copper spot market elasticity comes mainly from scrap supply, then demand substitution and thrifting. Historical elasticity suggests copper price might need to rise to as high as ~$23,000/t to generate the incremental supply needed for new inventory.
4: Gold price could fall another 15-20% short-term before potentially doubling
(Probability: Low | Impact: Low)
Gold rallied strongly from $2,500/oz in Jan 2025 to $5,500/oz in Feb 2026, then corrected to ~$4,000/oz currently.
Given that the value of gold reserves accumulated over millennia grew 60% in the past year, investor positioning is underwater, and physical demand ex-China is weak, gold has potential for further near-term downside.
However, the longer-term outlook remains constructive due to China's massive trade surplus (over $1.3 tn ex-gold), PBoC buying, worsening global fiscal sustainability concerns and associated currency debasement fears, and high global geopolitical tensions. Gold market outlook remains very positive.
We think, considering the large sum of money that could be allocated to gold for these reasons, and the relatively small size of the gold market, its price could rise toward $6,000/oz over the coming years.
We think near-term downside risk is greatest. Seasonality improves in Sep and Oct, so the window for a large decline is over the next 4-6 weeks.
Various factors could drive a significant gold price decline: China stops buying over the next month, holders (central banks or UHNWIs for liquidity) sell during an equity and/or bond market pullback, a sharp deterioration in Hormuz/Middle East situation pushing real rates and the dollar higher, exacerbating some or all of the above.
Once price breaks below ~$3,800, ETFs and other leveraged positions could bring significant selling pressure. Ex-China, there's little physical demand support even at current price levels.
Thereafter, gold could rise toward $6,000, nearly doubling, aided by significant disinflation and another wave of investor buying, with various catalysts along the way.
5: Extreme weather could worsen, with potential for record-strength El Niño, impacting ag commodities
(Probability: Medium | Impact: High)
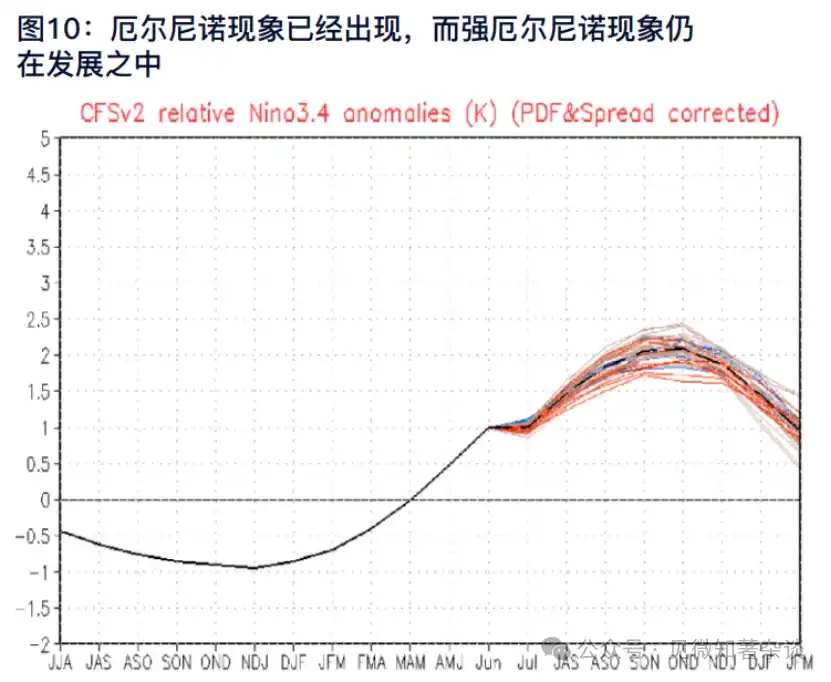
Moderate-to-strong El Niño itself is not a wildcard and is already in our base price outlook.
However, a potentially record-strength El Niño, with severity and duration of adverse weather conditions, could still cause severe supply disruptions and significant price increases for key agricultural commodities, constituting a key upside risk scenario.
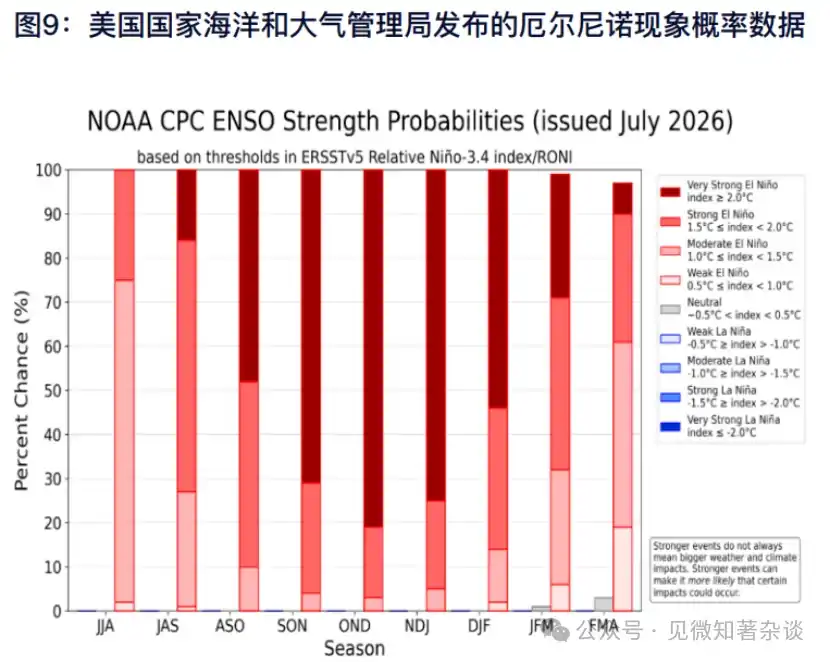
In the July update, NOAA raised the probability of a very strong El Niño event to 81%, with a 97% chance conditions persist into Spring 2027.
Historically, major El Niño events occurred in 1982-83, 1997-98, 2015-16, while weaker events are more frequent and usually less damaging. The phenomenon typically peaks in Northern Hemisphere winter months.
While any commodity price outlook based on weather patterns beyond a 14-day forecast window is inherently uncertain, the overall geographic distribution pattern of weather anomalies accompanying a typical El Niño is relatively well-defined. Forecasters can usually identify areas likely to see above/below normal precipitation.
However, the severity, persistence, and ultimate impact of these anomalies on crop production is far harder to predict. Additionally, in a very strong El Niño event, the probability and intensity of such weather disturbances increase significantly, raising the risk of significant crop losses and heightened price volatility.
El Niño affects various ag commodities differently, giving us a bullish bias to price outlooks for these. Cocoa, sugar, and coffee (Robusta more than Arabica) see significant production impact from such weather.
From a CBOT perspective, soybeans could be more affected, while corn and wheat relatively less.
El Niño typically benefits US crop yields but reduces yields in Australia, Russia, Ukraine, Kazakhstan. During El Niño, warming Pacific waters transfer substantial heat to the atmosphere. This disrupts normal atmospheric circulation patterns, triggering cascading weather changes globally.
Most common manifestations include: drought (in usually stable rainfall regions like SE Asia, Australia, and parts of Africa & India); increased rainfall & flooding (in the Americas, especially W coasts of S & Central America and Southern US); warmer winter temps (in Northern US and Canada).
Such temperature and precipitation changes can severely affect many ag commodities, especially softs, but also grains. Recent European heatwaves sparked serious market concerns about local corn yields, while a weaker Indian monsoon could cut sugar, soybean, and corn production.
If Harmattan winds similar to the 2023-24 season hit West Africa again this El Niño cycle, cocoa supplies could be severely disrupted, with prices potentially returning to $10,000/t or higher.
Also, strong El Niño often correlates with above-normal rainfall in Ecuador, increasing flood risk.
If flooding recurs or intensifies due to potentially record El Niño strength, Ecuador cocoa production could drop 100-200 kt, a heavy blow to an already fragile global cocoa market.
Meanwhile, below-normal June rains in India, coupled with potential precipitation deficits in India and Thailand over the next 3-6 months, add significant upside risk to sugar prices. If excessive rains and flooding in Brazil disrupt harvesting and force mills to temporarily halt, supplies could tighten further.
As El Niño conditions strengthen, the likelihood of such weather-related disruptions increases, potentially driving global sugar prices toward ~25 c/lb.
We also expect higher global average temperatures, but by how much and for how long are key variables, crucial not just for gas prices but also ag yields.
In El Niño years, above-average temps and below-normal rainfall can significantly lower crop yields due to intensified heat and moisture stress. Excessive heat during critical growth stages like flowering and grain filling can damage crops, leading to poor pollination, impaired pod/seed development, reducing overall productivity.
Combined with drought, heat can also cause leaf scorching, wilting, and accelerated crop maturation, limiting accumulation of grains, sugars, or biomass.
Crops particularly vulnerable include rice, corn, sugarcane, soybeans, cotton, cocoa, and in severe cases coffee, though extent varies by region and timing of heat stress.
6: AI inflection: boom or bust? A two-way risk for commodities
(Probability: Low-to-Medium | Impact: High, but varied across commodities)
Currently, the trajectory of AI development presents a highly asymmetric two-way risk for commodity markets. If the 'AI bubble' bursts, it would likely trigger global risk-off and a deflationary demand shock, bearish for commodity demand prices.
If AI delivers a productivity boom early, continued growth in AI-related commodity demand (e.g., power, industrial metals) would be a bullish tailwind. Deflationary effects from global productivity gains could be bearish for non-AI commodity demand, but offset by resulting easier monetary policy.
Boom path: AI-driven productivity gains manifest in corporate results, real GDP growth, and positive macro data surprises, supporting further acceleration of AI infrastructure expansion. In late 1990s, US nonfarm business productivity jumped from ~1.5% annual growth to over 3% within a few years as IT applications crossed a critical threshold.
A similar AI-driven acceleration today would constitute a major positive supply-side shock to the global economy.
Bust path: Investor disappointment with AI monetization timelines triggers a sharp tech valuation correction. A high-profile earnings miss cycle, evidence of plateauing model capability gains, or a disruptive open-source model commoditizing frontier AI could catalyze rapid sentiment reversal (similarities to 2000-02 dot-com bust).
Market impact: Both scenarios entail deflationary risks but via different mechanisms, with opposite commodity implications.
We think the bust scenario leads to demand-destructive deflation (wealth destruction, credit tightening, reduced capex), initially bearish for commodity pricing: lower volumes and prices, though eventually Fed would cut aggressively as fundamentals deteriorate.
In contrast, the boom scenario is inflationary initially, as building AI-related infrastructure is resource-intensive. However, realized AI optimism would likely drive deflation via improved global productivity.
In that context, central banks could maintain or even ease policy amid strong growth, a macro environment bullish for commodities overall via rates and dollar channels.
A key longer-term concern is if AI-driven productivity gains also lead to lower commodity intensity of use, e.g., via accelerated R&D of substitute materials, thus damping demand for global non-AI infrastructure and/or reducing overall labor demand & wage growth, which would be a drag on commodities.
The power channel is the most direct AI-commodities transmission and highly volatile both ways.
US data center power consumption is projected to roughly double by 2030, supporting demand for gas, uranium, and power infrastructure metals. A bust would see data center builds abruptly slow, simultaneously depressing actual and expected demand for Cu, gas, and U.
If visible and broad-based productivity gains confirm sustained or accelerating AI boom, power supply tightness could accelerate, adding pressure to gas markets and pulling forward grid investments.
This would further amplify the narrative of existing structural deficits for Cu and Al (one path to our bullish $17,000/t copper scenario).
The dollar channel offers a buffer in both recession and boom. Dollar strength partly stems from sustained capital inflows attracted by US tech premium.
A bust could trigger unwinding of overweight US equity positions, weakening the dollar, providing mechanical price support for USD-denominated commodities even as demand fundamentals deteriorate.
Similarly, further boom could prolong US exceptionalism, driving dollar strength. Gold may be the commodity with the most favorable asymmetry across both scenarios and closest to an AI-variable hedge within commodities, benefiting from safe-haven demand and rate cuts in a bust.
In an AI boom scenario, it's more nuanced: stronger productivity and growth, if pushing real yields higher, could be negative for gold, but continued uncertainty over inflation, fiscal dynamics, power infrastructure investment, and distribution of AI gains could still support demand for gold as a portfolio hedge.
7: Fragile balance could break, US-China trade war reignites, hitting soybean exports
(Probability: Medium | Impact: High)
If China stops fulfilling pledges to buy US ag products, it could lead to a large build in corn and soybean stocks, depressing prices.
China appeared set to be a large buyer of US ags for the next three years. In Nov 2025, the US and China reached a deal, heavily telegraphed by the White House earlier.
Per the deal, China pledged to buy 12 mln tonnes of soybeans in Nov-Dec 2025, which was fulfilled, plus 25 mln tonnes/year for the following three years. Also, after the Trump-Xi meeting in May 2026, China pledged to buy $17 bn of US ag products over the next three years.
These pledges provided strong support for corn and soybean markets. However, the situation could change quickly. Implementation of different tariff rates, and broader geopolitical dynamics and uncertainties from Middle East & Russia-Ukraine conflicts, could alter China's willingness to fulfill soybean and corn import pledges from the US.
If China suspends US corn/soybean purchases for an extended period, new crop soybeans could drop below $10/bu and corn below $4.2/bu, a heavy blow to US farmers and highly undesirable for the incumbent administration in a midterm election year.
While China's motivation to fulfill soybean commitments is likely far from commercial – US basis carries a significant premium vs other destinations – under our base case, we expect China to at least fully meet commitments through President Trump's term.
However, if tensions escalate for any reason (e.g., China/Taiwan escalation, US unilateral additional tariffs, other geopolitical risks directly/indirectly affecting China), China's soybean imports from the US could be heavily impacted, even going to zero for a period.
If China revokes current exemptions for US soybean imports and stops completely, we estimate US exports to China could drop by 13-15 mln tonnes (i.e., 475-500 mln bushels), pushing carryout to levels akin to 2017/18.
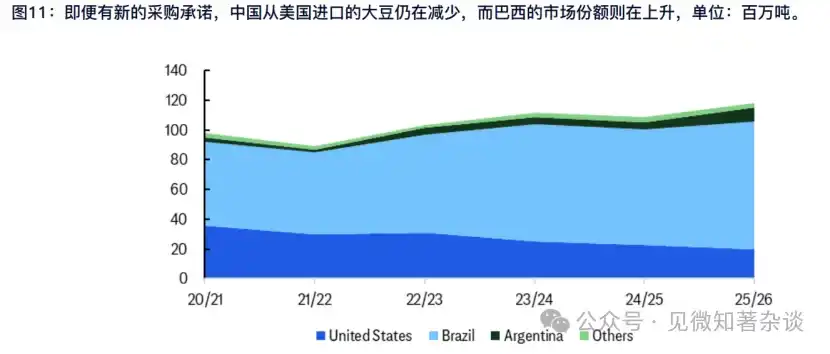
Technically, many tariffs China imposed on US ags during the 2018 trade war remain in place but have been exempted on an annually renewable basis.
China could simply reinstate those tariffs. US corn and soybean exports are ~55-60 mln tonnes per market year each. However, ~2/3 of US soybean exports go directly to China, worth ~$1.2-1.8 bn per month.
Meanwhile, China's soybean stockpile has more than doubled since 2019, but these stocks cover only ~3 months of forward consumption (including port and reserve stocks).
Facing potential tariffs, China would shift soybean imports primarily to Brazil, not the US. Non-US sources for China are only Brazil and Argentina.
Given ~85% of China's soybean imports come from Brazil and the US, we expect it's hard for China to reduce reliance on US soybeans near-term. Any potential tariffs would likely push Midwest farmers out of the China market, as in 2018. This would be especially acute with Brazil expecting a record soybean crop.
China has reduced reliance on US soybeans over the past five years. Longer-term demand could face structural shocks from aging demographics and population changes. Since Covid, China's soybean demand for crush or domestic consumption has seen slowing growth.
Historically, soybeans are more sensitive to growth headwinds than grains (corn, wheat). Finally, assuming normal weather and acreage ~22 mln hectares, China's 2025/26 soybean production is estimated at ~21 mln tonnes, up 31% vs 2018/19.
8: China-Russia finalize deal on 'Power of Siberia 2' pipeline
(Probability: Medium | Impact: High)
If the Power of Siberia 2 pipeline (50 bcm/year capacity) comes online, it would significantly reduce China's LNG import needs post-2030, adding further downside pressure to a global LNG market already projected to be in surplus from ~2028.
Under this scenario, JKM could fall to $5-6/mmbtu or lower – while current 2029-30 futures are >$8/mmbtu.
How it progresses: Despite widespread skepticism over the years, the global energy crisis from Middle East conflict revived expectations for progress. A final deal would pose a major risk to the economics of planned LNG supply projects, especially US ones, potentially stranding billions in investment.
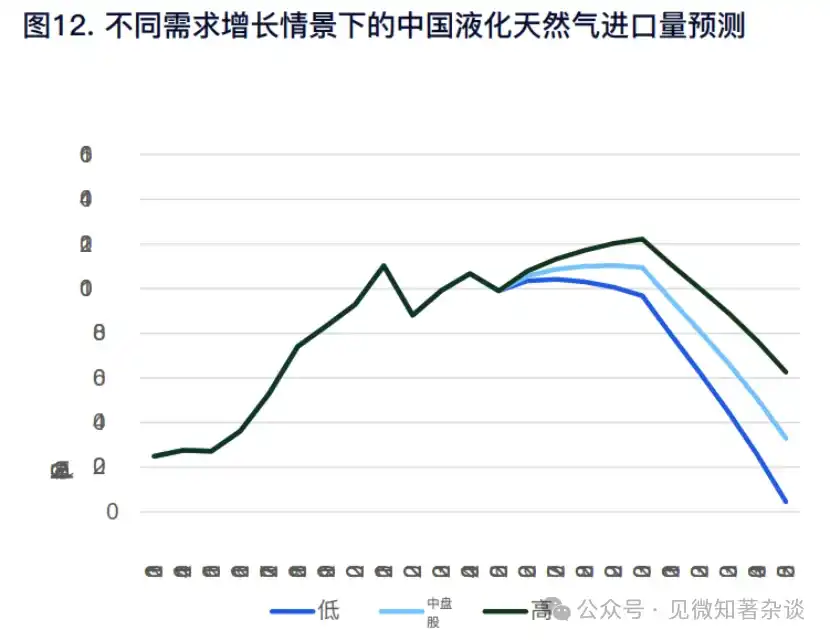
In an extreme scenario, China's LNG imports, long seen as a key driver of global demand growth, could dwindle to negligible levels by 2040.
The resulting supply substitution would also pressure global LNG, gas, and wholesale power prices, especially in markets where gas often sets the marginal power price.
China demand scenarios: The medium demand scenario assumes China domestic gas consumption CAGR of 3.8% from 2026-30, 3.2% from 2026-35. Demand could reach 535 bcm by 2030, 607 bcm by 2035.
Low/high demand scenarios assume China domestic gas consumption CAGR of 3.3%/4.3% from 2026-30, 2.7%/3.7% from 2026-35 respectively. China domestic production: Strong production growth could sustain ~4%/year.
If China production performs more strongly, then LNG imports would drop rapidly post-2030, especially given reported lower prices for Russian pipeline gas to China vs its European sales, while shipping arbitrage typically implies Asian LNG prices gravitate toward European levels.
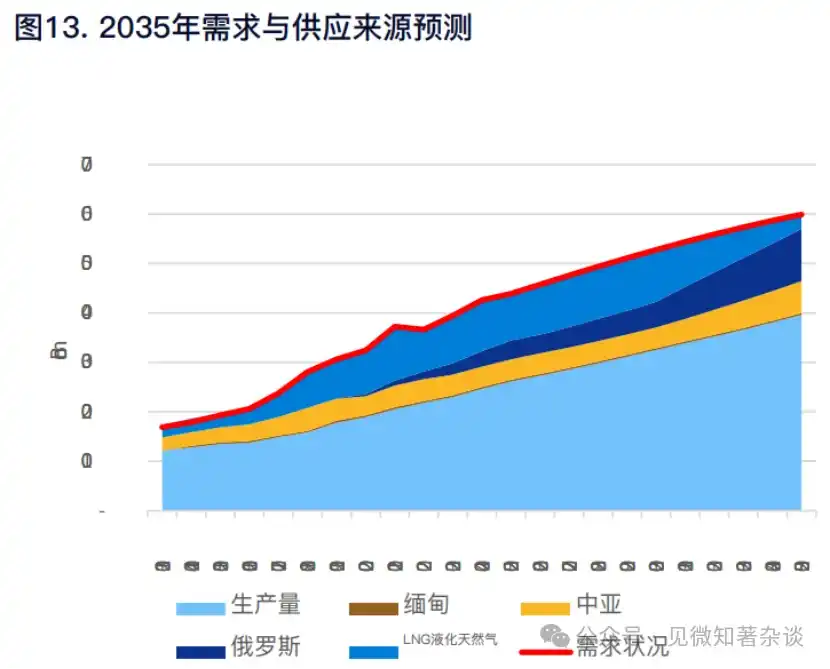
China's energy development overall increasingly emphasizes domestic supply amid energy security concerns. Given massive renewable capacity additions, strong coal production growth, and 29 of the 60+ nuclear plants under construction globally located in China, long-term it's unlikely China will boost domestic gas demand enough to increase both Russian pipeline gas and LNG imports simultaneously.
We expect increased Russian gas imports will displace LNG imports, keeping China's import dependency on foreign gas sources in the low-mid 40% range, roughly current levels.
Market impact: For global LNG, the clear message: while a surplus is expected in 2028-30, the market could remain loose post-2030 unless LNG prices fall below Russian pipeline gas and seaborne coal prices.
Potential additional ~50 bcm/year supply from POS2 represents a major structural shift bound to impact global LNG markets significantly. That volume alone is nearly equivalent to the ~53 bcm/year of gas Russia could still export to Europe via remaining pipeline routes.
Thus, the impact of these China-Russia deals on the expected global LNG glut likely far outweighs any concerns about Russian pipeline gas returning to Europe.
In the 2030s, Asian JKM LNG and European TTF gas prices would likely fall and stay below $6/mmbtu, even $5/mmbtu, well below the $7-10/mmbtu breakeven costs of most new LNG terminals.
Continued progress in renewables and storage in coming years likely means no need for additional LNG supply.
9: Extreme version of Monroe Doctrine: US blocks all oil from the Americas
(Probability: Low | Impact: High)
If the US blocks all oil exports from Latin America and American countries, it could cause severe dislocation between American and rest-of-world oil price benchmarks, with shock magnitude akin to the 1973 Arab oil embargo.
How it could happen: The Trump administration in early 2026 surprisingly toppled the Maduro regime, also mentioning Greenland, Cuba, Colombia, and Mexico as potential next targets.
The administration could continue and further its touted new 'Monroe Doctrine' concept, focusing on its Western Hemisphere sphere of influence, essentially the entire Americas.
Pushed to an extreme, the US might try to block or at least hinder all Latin American and indeed all Americas (North & South) crude exports to the rest of the world, as it previously did with tankers leaving Venezuela, and possibly redirect that crude to the US, reflecting the current administration's preference for blunt mercantilist measures to pressure trade and foreign policy goals.
However, resulting oil price moves and geopolitical tensions could trigger strong reactions, prompting the White House to reverse or cancel measures; and any political change in US midterms or presidential elections could see this extreme scenario abandoned quickly.
Market impact: Overall geopolitical risk premium could rise, lifting all crude prices; more importantly, major global crude benchmarks could see severe dislocation.
Given Latin America (including Mexico) crude production ~9.8 mb/d in 2026, ~10% of global total, such a situation would create disruption comparable to or greater than the 1973 Arab oil embargo, with global oil prices (Brent etc. outside Americas) likely surging, perhaps to $100+.
However, if US & Americas crude is trapped unable to freely export internationally, its price could discount heavily as storage fills, eventually possibly forcing production shutdowns.
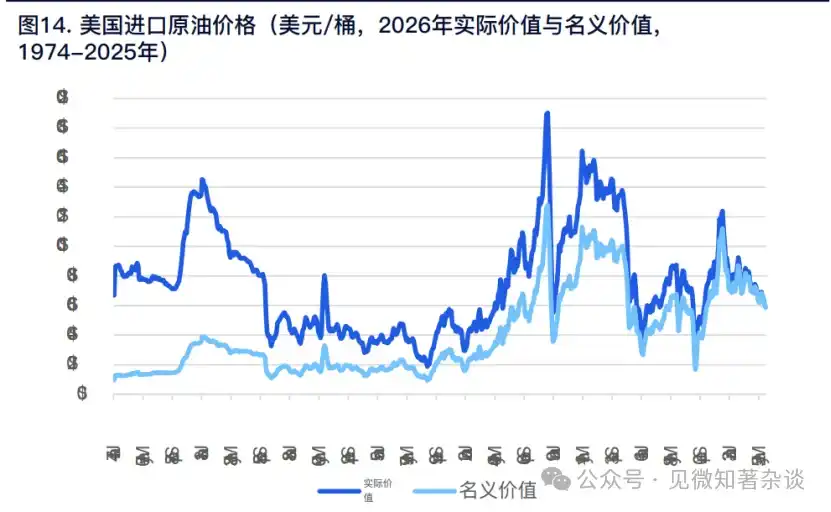
During the 1973-74 oil crisis, some OPEC producers announced a 25% production cut. Seven OPEC producers (Algeria, Iraq, Kuwait, Libya, Qatar, Saudi Arabia, UAE) saw oil output drop from 18.8 mb/d in Sep 1973 to 15.3 mb/d in Nov, a 3.6 mb/d reduction, nearly 20%.
Global oil output then was 55.5 mb/d, so OPEC cut was 6% of global, equivalent to ~6 mb/d today.
Oil price rose from ~$3/bbl in Sep 1973 (~$20 in 2026 terms) to ~$5-6/bbl by late Oct (~$35-40), and above $12/bbl by Jan 1974 (over $80 in 2026 terms), a 300% rise from Sep 1973. Although OPEC lifted the embargo in Mar 1974, that price level persisted through the 1970s until the 'second oil crisis' in 1979 pushed prices even higher.
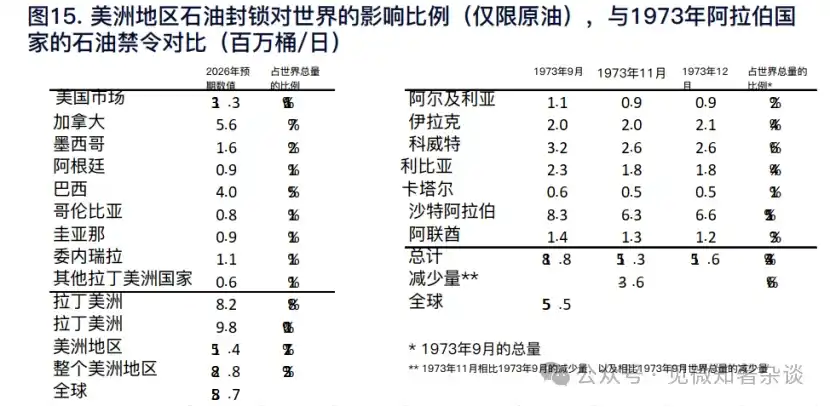
After accounting for crude runs at regional refineries, the Americas remain in a net long crude position, i.e., net exports to the rest of the world of ~5.8 mb/d.
In 2026, Latin America (ex-Mexico) crude production ~8.2 mb/d, refinery runs ~3.7 mb/d, net crude exports 4.6 mb/d.
Including Canada and Mexico, the Americas ex-US produce 15.4 mb/d, refinery runs 7.1 mb/d, thus net exports 8.3 mb/d. (US production ~13.3 mb/d, runs ~15.9 mb/d, thus net imports 2.5 mb/d. So even if all Americas crude exports went to the US, there would be 5.8 mb/d of crude available for export.)
Absolute and relative value impacts would be significant. Crudes of American origin (e.g., WTI, WCS, Mars, Maya) would discount, while ROW crudes (e.g., Brent, Dubai) could surge. If the US remains able and willing to export crude to ROW, the discount for US crudes would shrink, and US crude exporters/re-exporters would benefit from wide arbitrage.
Since 2022, Russian Urals crude has sometimes discounted up to $30/bbl due to US and European sanctions causing many buyers to shun Russian crude, forcing ~2 mb/d originally bound for Europe and OECD Asia to redirect, mostly to India, some to China.
Recent US/EU sanctions on Russia, Iran, Venezuela have at times limited these nations' ability to export crude to traditional partners, causing local crude to discount vs global benchmarks, before trade flows gradually re-route as new arbitrage opportunities emerge, even involving so-called 'shadow fleets'.
Estimated by ship trackers like Windward and Vortexa at times up to 1400-1600 vessels, with over 1000 possibly moving Russian crude.
As a fungible commodity, crude trade flows would gradually reallocate, but differences in crude slates received and processed by refineries could lead to suboptimal crude diets, reducing yields of key products (gasoline, diesel), pushing product prices higher ceteris paribus.
Second-order political impacts from this energy geopolitical shake-up remain uncertain, as China, Russia, Europe, and OPEC+ could respond in various ways, exacerbating two-way market volatility. Non-Americas consumers could accelerate search for oil substitutes.
Some long-term effects of the 1973 Arab oil embargo included: monetary tightening to curb inflation, increased upstream oil exploration and eventual production globally, and greater emphasis on energy saving and fossil fuel substitutes (notably biofuels/ethanol at the time). Oil-driven inflation could rise further and diverge, higher outside the Americas, lower or deflationary within.