Bitcoin slightly rose to around $25,500 as investors believe the Fed is about to end its interest rate hike.
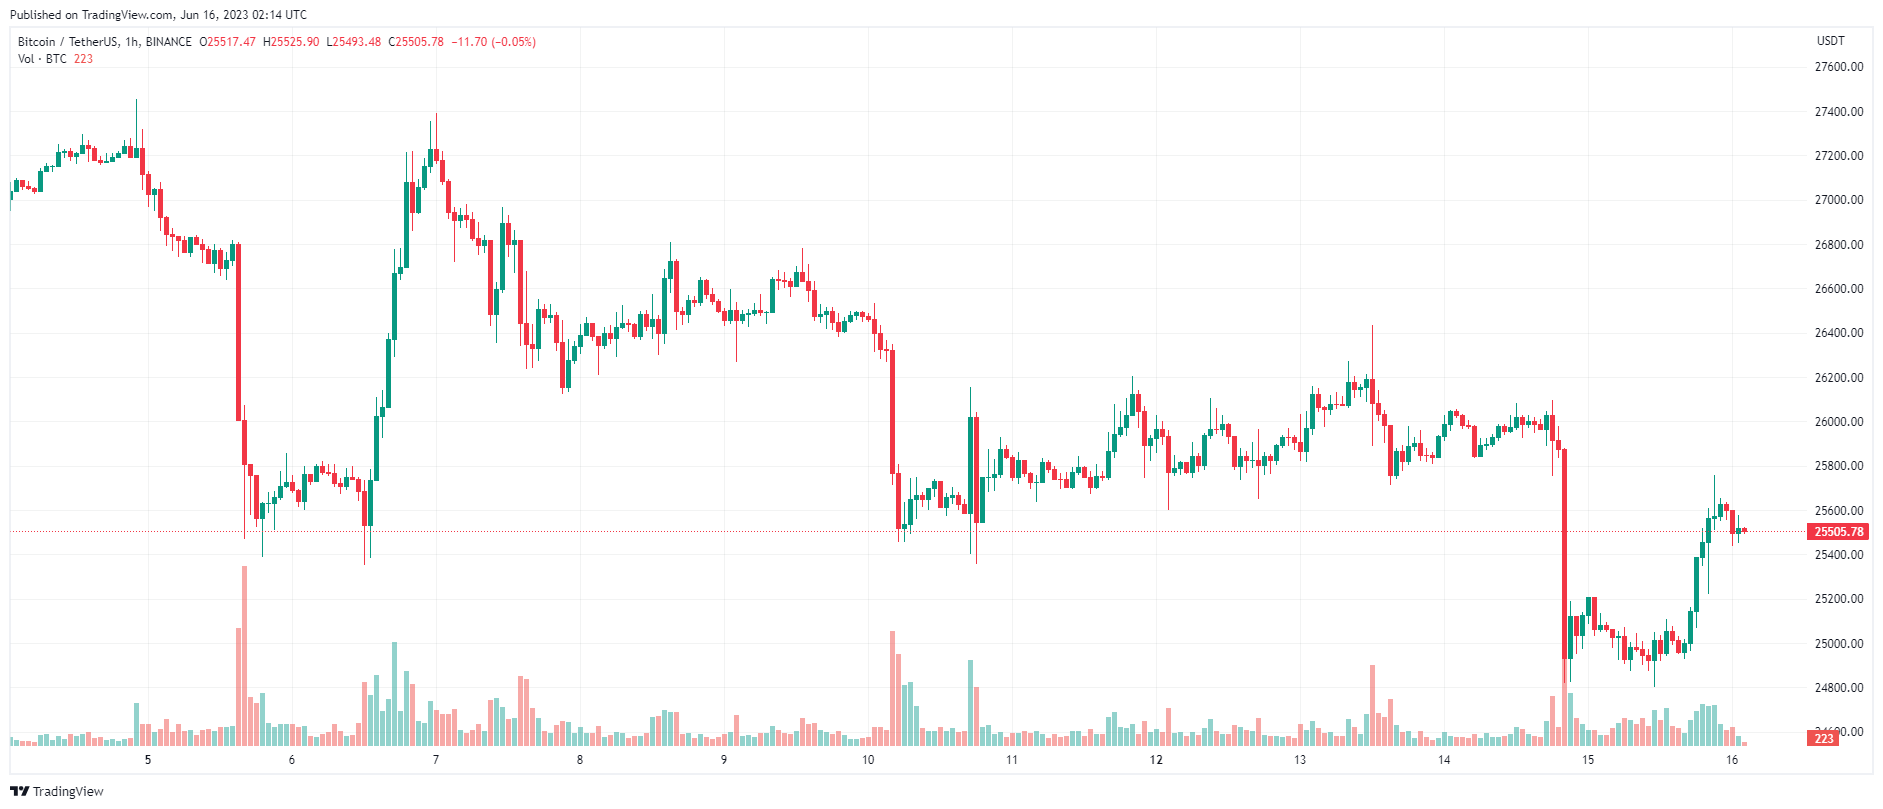
BTC Price Chart – 1 hour | Source: TradingView
Dow Jones recovered more than 400 points and S&P 500 hit a new 13-month high as investors bet that the US Federal Reserve (Fed) is about to stop raising interest rates.
At the end of the session, the Dow Jones index rose 428.73 points (equivalent to 1.26%) to 34,408.06 points; The S&P 500 climbed 1.22% and closed at 4,425.84 points; and Nasdaq Composite rose 1.15% to close at 13,782.82 points. Bond yields fell, while technology stocks continued to lead the market, in line with Wall Street trends in 2023.
Thursday's rally took the S&P 500 and Nasdaq to session highs since April 2022.
The S&P 500 is also recording its longest streak of gains since November 2021 and is about to record its biggest weekly gain since March. Compared to last October's Dip , the index is now up 23%. YTD, the S&P 500 is up 15%, while the Nasdaq technology index is also jumping more than 31% in 2023.
Regarding technology stocks, Microsoft and Oracle gained about 3.2% and 3.5% respectively, while Alibaba climbed nearly 3.2%.
On Wednesday, Fed Chairman Jerome Powell said at a news conference after the policy meeting that the Federal Open Market Committee (FOMC) would use the remaining six weeks before its next meeting to “ consider tightening monetary policy”. He added that the central bank has yet to make a decision on its July policy move.
Thursday's market rally suggests investors are still betting on potential uncertainty ahead of the FOMC's July meeting.
However, Chairman Powell confirmed that the Fed could continue to raise interest rates this year, and said that the agency will continue to assess the situation based on monthly economic data. It is known that US stocks rose and fell in Wednesday's trading session after this comment.
Economic data released on Thursday gave investors and policymakers a clearer view of the state of the labor market and consumer spending. The number of applications for unemployment benefits last week was 262,000, higher than the estimate of 245,000. Besides, retail sales increased by 0.3%.
Oil prices surged more than 3% to a weekly high on Thursday on the back of a weaker dollar and strong refining data in China, the world's top importer.
Ending Thursday's session, Brent crude oil futures rose $2.47/barrel, or 3.4%, to $75.67/bbl, while U.S. WTI crude oil futures contracts increased by 2.35 USD/barrel, or 3.4%, to 70.62 USD/barrel.
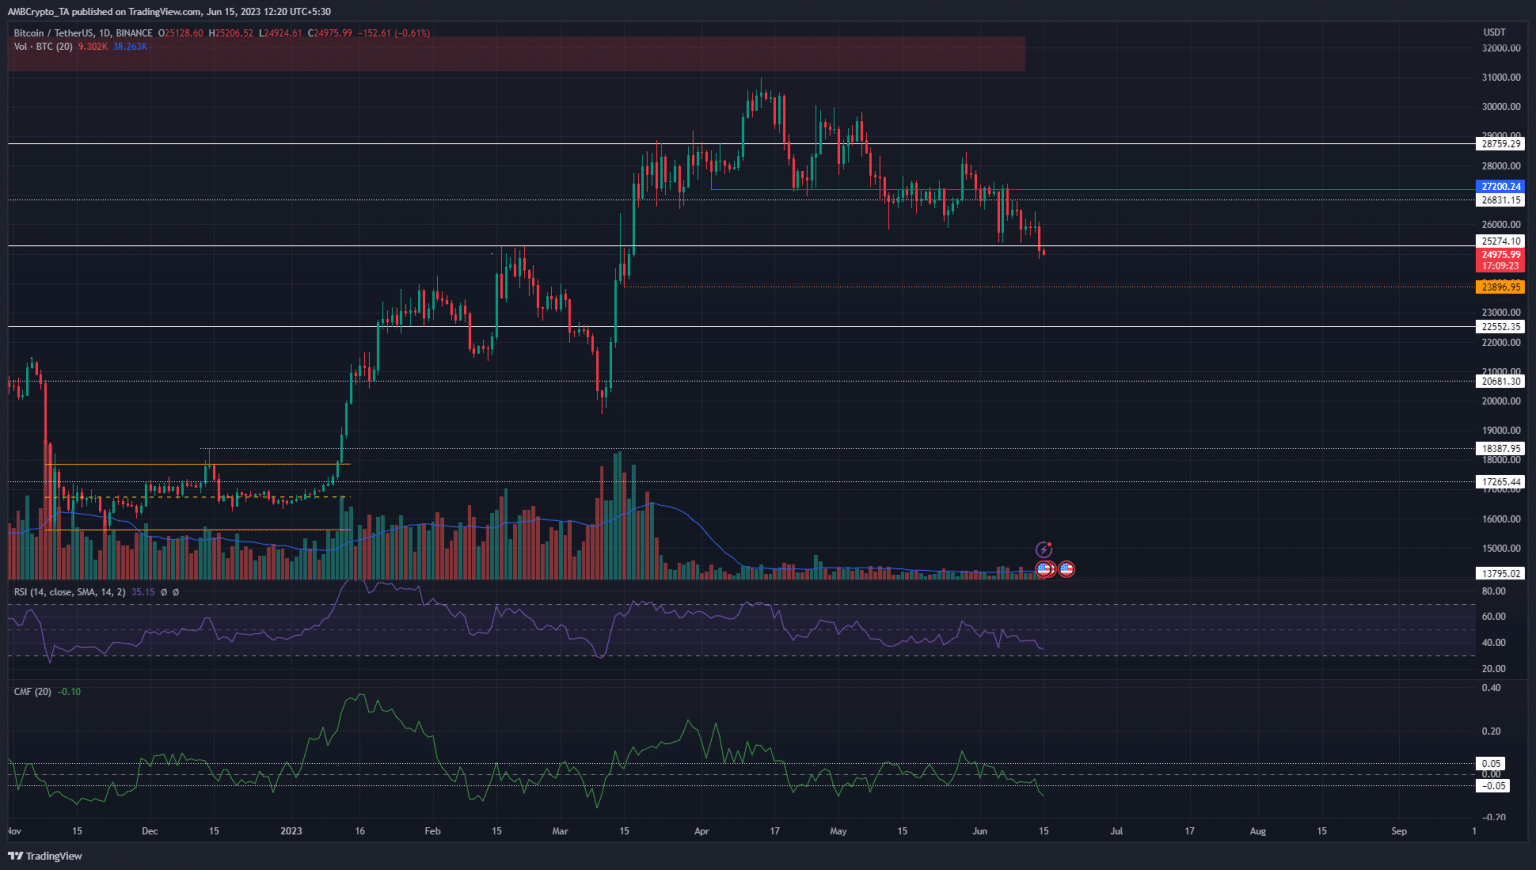
Bitcoin [BTC] has a strong bearish outlook on the higher timeframe price chart. In the short-term, however, BTC has regained key support at $25,200 and is currently trading around the $25,500 area.
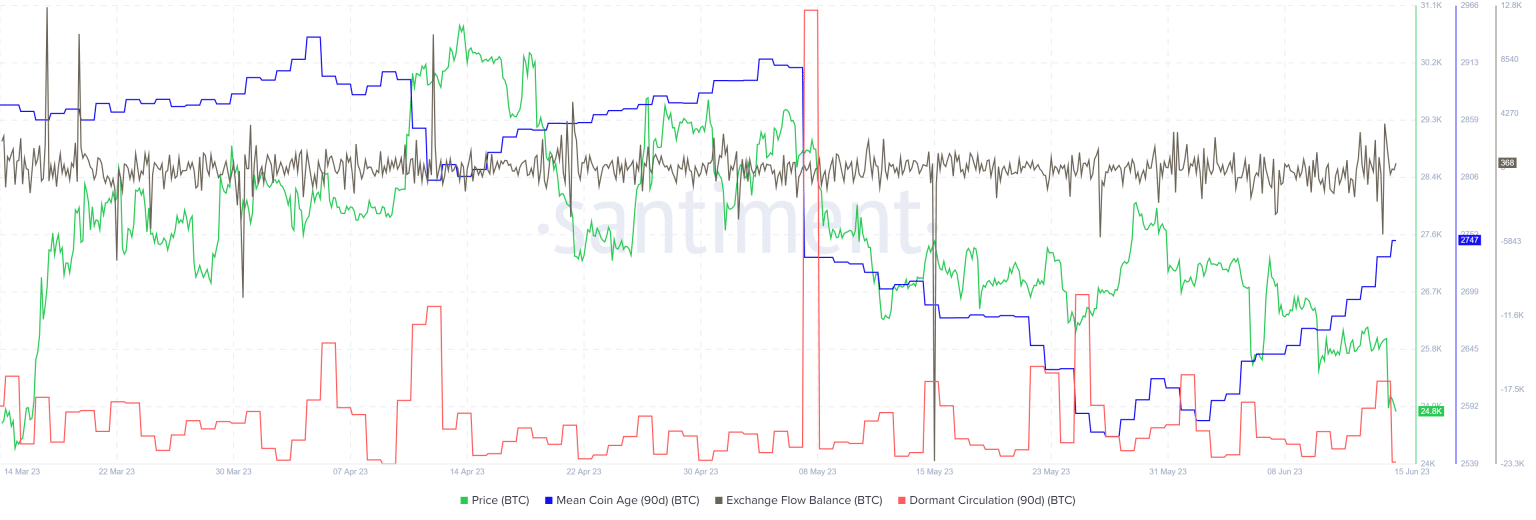
Investors have conducted massive withdrawals to their wallets, causing the supply on exchanges to decrease rapidly. This trend follows the uncertainty surrounding the SEC's lawsuit against Binance and Coinbase.
Source: TradingView
In the larger time frame, Bitcoin's bias is bearish as the market has made a series of lower highs and lower Dip after sliding below the higher Dip at $27,200 on April 24, breaking out previous bull market structure.
The majority of the RSI has been below the neutral 50 level since mid-April, showing bearish momentum. CMF dipping below -0.05 for the first time in a month shows significant Capital outflow from the Bitcoin market.
On the downside, the $23,900 – $24,000 area could offer some support. Meanwhile, $22,000 and $19,500 are the next levels to watch out for.
Source: Santiment
BTC net outflow figures on exchanges show a continuous inflow over the past 4 days. This indicates an increase in selling pressure. The Inactive Circulating Supply Index spiked on June 14. Overall, Bitcoin's price action and metrics have highlighted a bearish bias.
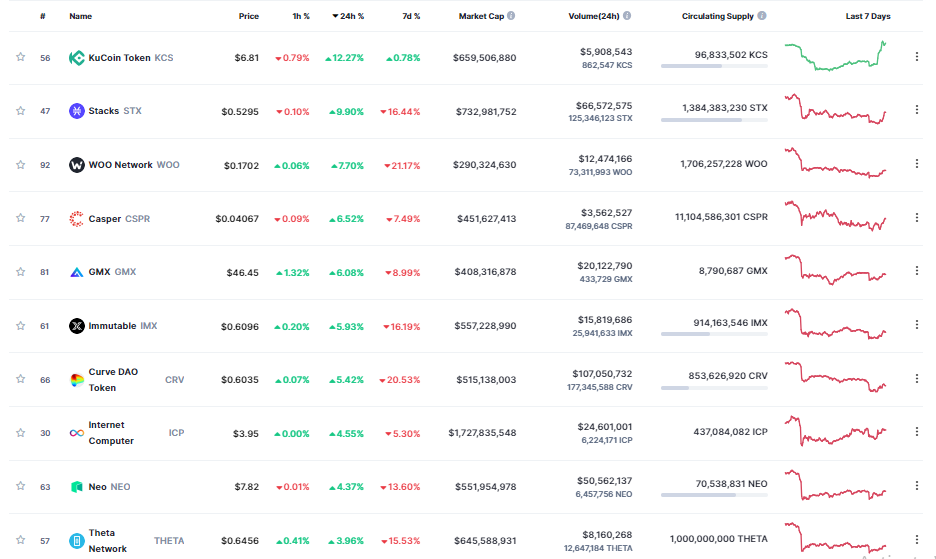
The altcoin market showed signs of a slight recovery in the short term, as BTC turned to rally after a sharp decline.
KuCoin Token (KCS) is the best performing project in the top 100, having bounced up more than 12% in the last 24 hours, erasing the week's losses completely.
Other projects such as Stacks (STX), WOO Network (WOO), Casper (CSPR), GMX (GMX), ImmutableX (IMX), Curve DAO Token (CRV), Internet Computer (ICP), Peg (Peg), Theta Network (THETA)… recovered from 3-9%.
Source: Coinmarketcap
Ethereum (ETH) has also successfully reclaimed the $1,650 level after breaking through this mark on June 14. Currently the largest smart contract Token in the market is trading around $1,660 with a slight gain of 0.5% on the day.
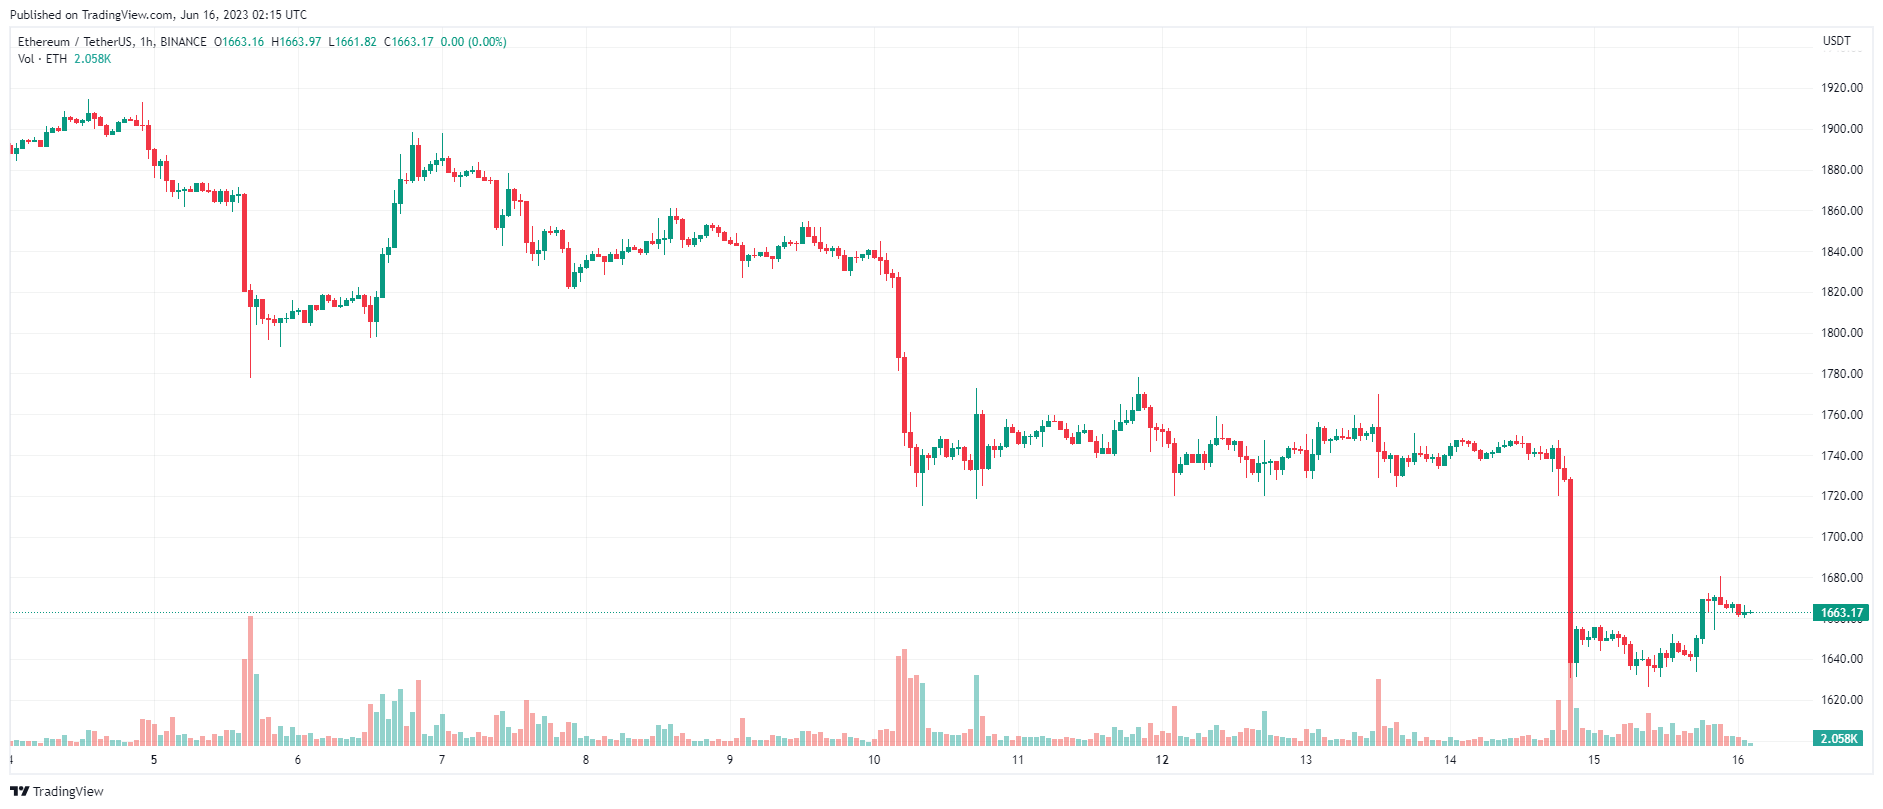
ETH price chart – 1 hour | Source: TradingView
The column “ Coin Price today” will be updated at 9:00 daily with general market news, readers are welcome to follow.
Ethereum has plunged below $1,700 during the past day. Here’s the on-chain indicator that may have signaled this dip in advance.
Ethereum Age Consumed Metric Saw A Spike Before The Price Decline
According to data from the on-chain analytics firm Santiment, institutional investors look to have been expecting the move to take place. The indicator of interest here is the “ETH age consumed,” which first finds the total number of coins moving on the Ethereum blockchain. Then it multiplies this value by the days these coins had been dormant before their movement.
So, in this way, the metric keeps track of how many coins are being sold/moved each day and uses their age as a weighting factor. This means that many old coins are moved to the network whenever this indicator’s value is high.
Naturally, low values of the metric, on the other hand, would imply that there aren’t many coins moving on the chain right now or some coins with a low average age are being transferred.
Related Reading: XRP And Ethereum Seeing Increased Social Media Talk As Bitcoin Loses Interest
Now, here is a chart that shows the trend in the Ethereum age consumed over the past month:
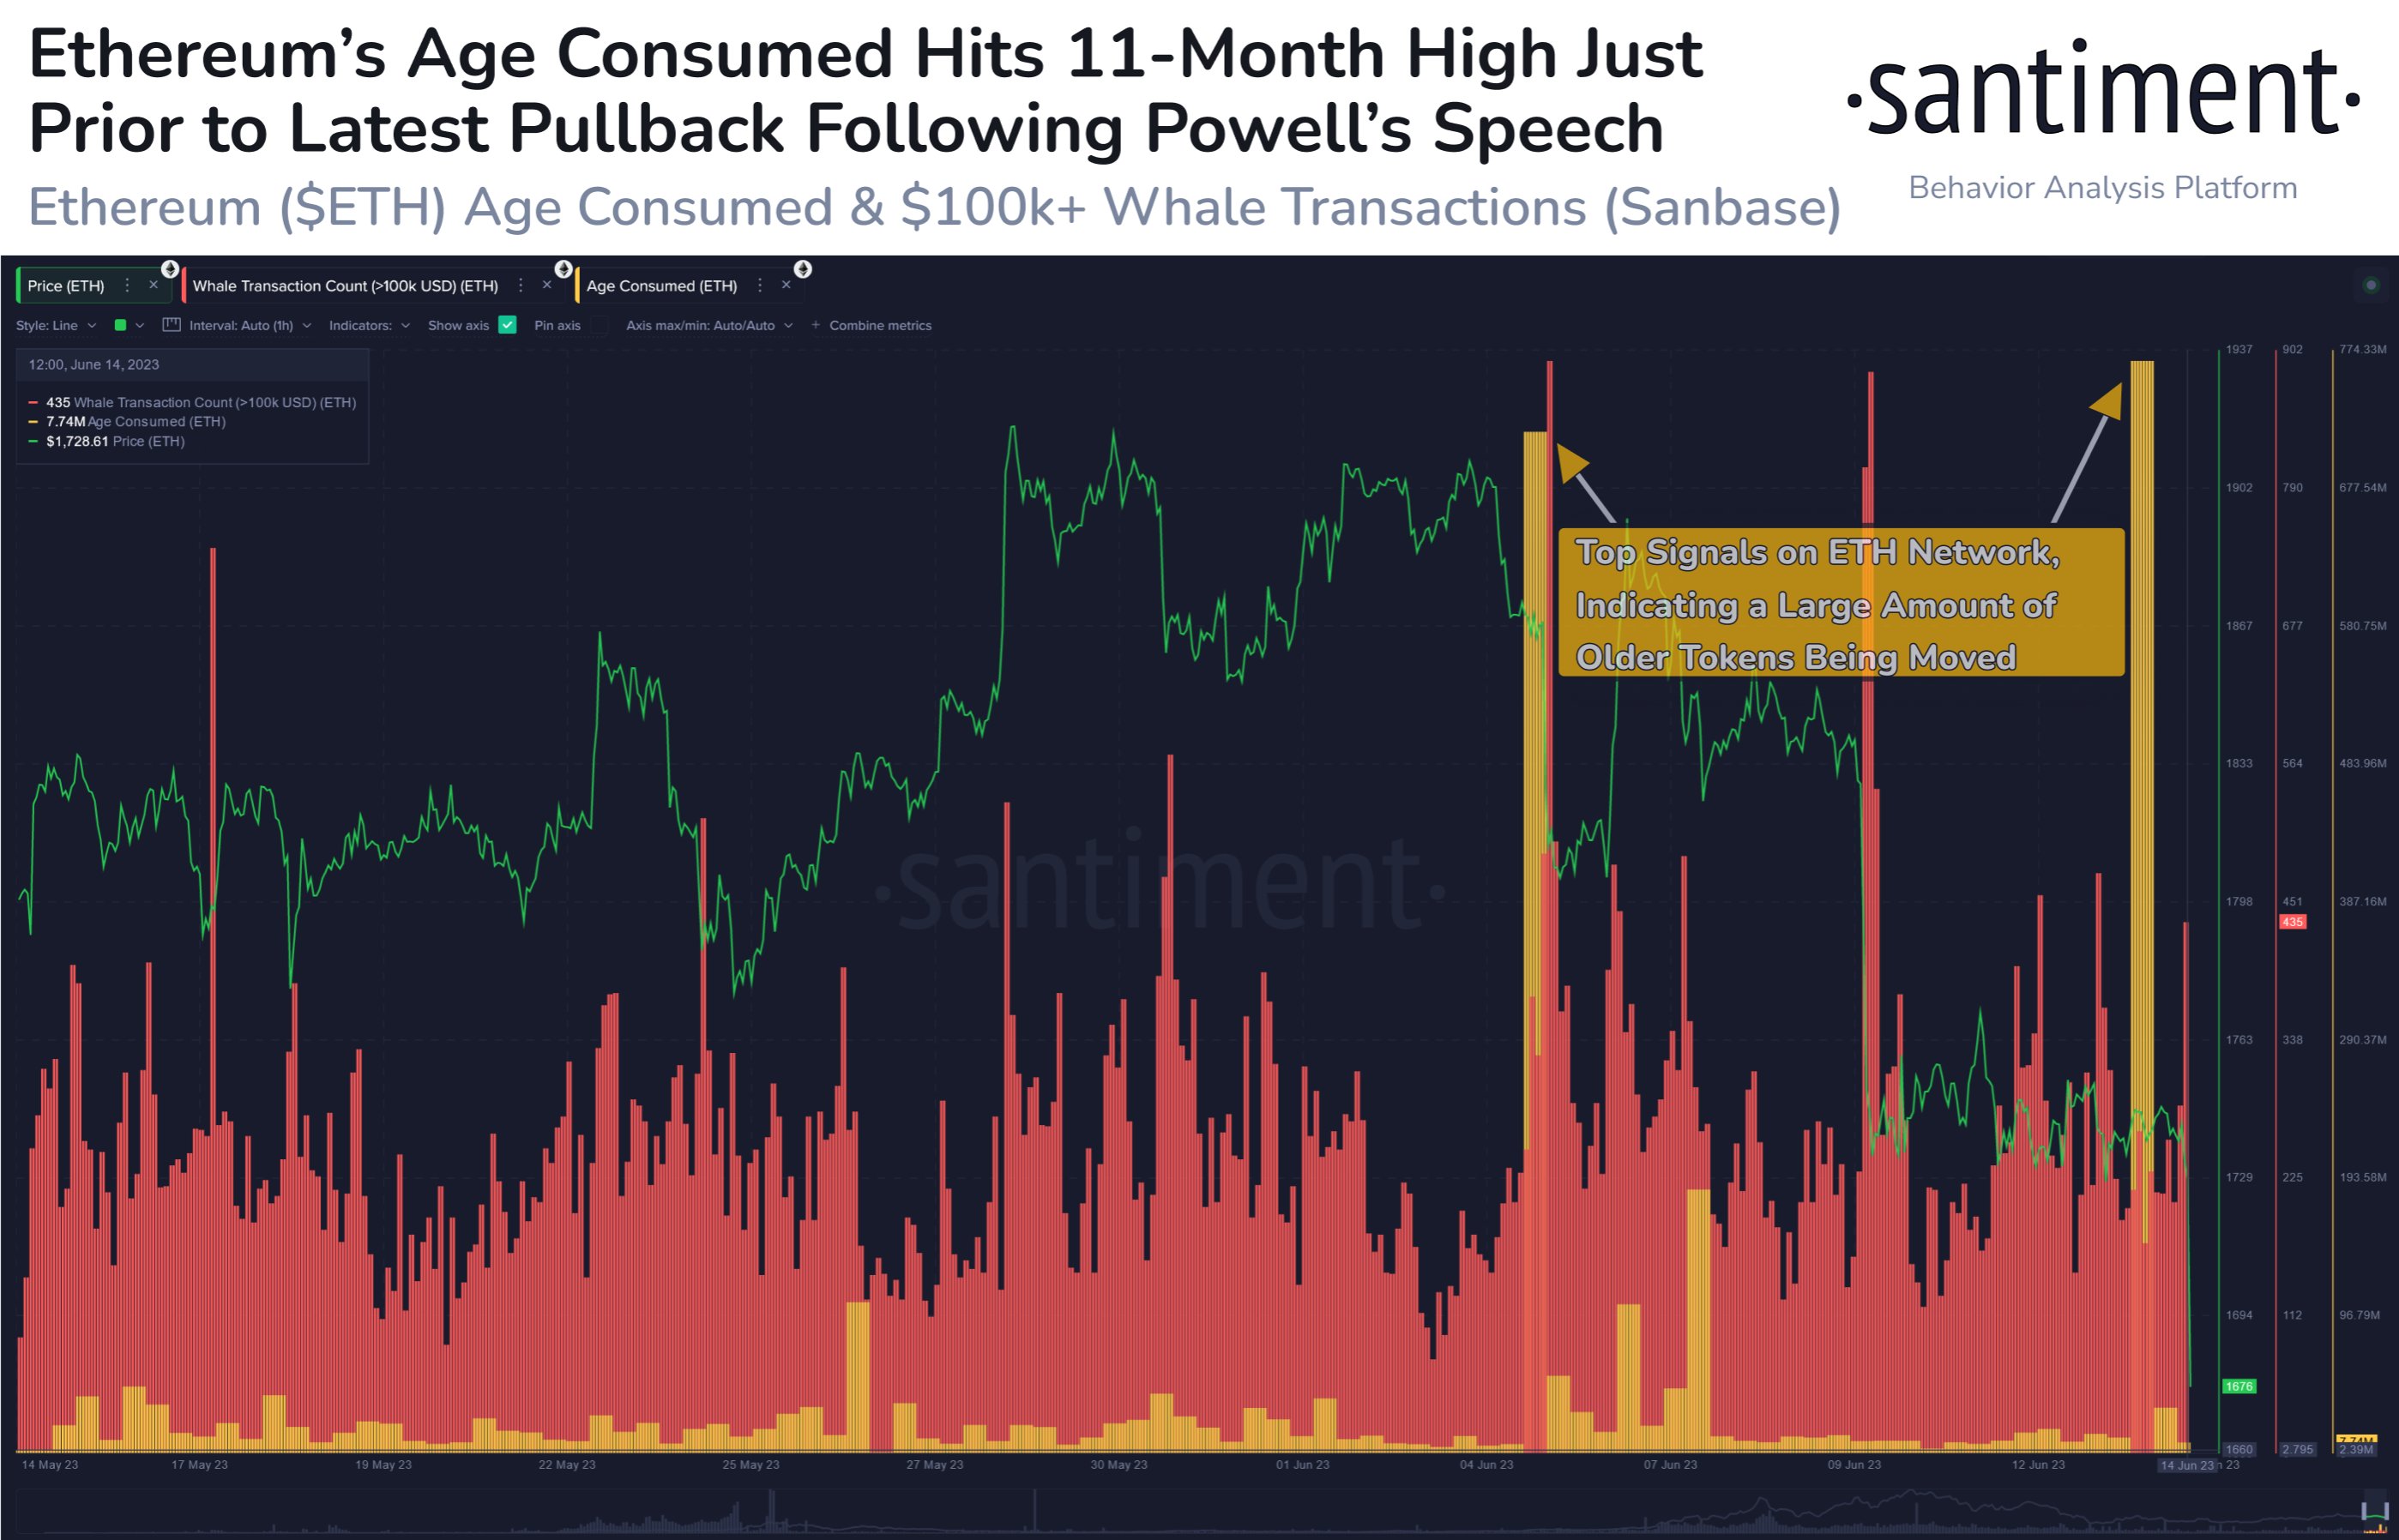
Looks like the value of the metric has been quite high in recent days | Source: Santiment on Twitter
As displayed in the above graph, the Ethereum age consumed metric had recently registered a very large spike. This would suggest the potential movement of many dormant coins on the chain during this surge.
Generally, when such large spikes in the indicator are observed, it’s a sign of selling from the long-term holders (LTHs). The LTH cohort includes all the investors holding onto their coins since more than 155 days ago.
These holders are the experienced hands in the market who don’t easily sell even when the market is distressed. Because of this reason, their movements can be something to watch out for, as when they do finally sell, it’s usually not a positive sign for the price.
The chart shows that the LTHs had also shown a large move earlier in the month. Shortly after these investors became active, the cryptocurrency price plunged.
This time, the spike in the Ethereum age consumed also seems to have preceded a price decline, as the cryptocurrency’s value has now dropped below the $1,700 level.
This latest price plunge has come after the news that the US Federal Reserve isn’t raising interest rates this time, but more hikes would be coming later in the year to fight inflation.
Santiment suggests that the spike in the age consumed metric before the price decline could imply that the institutions already expected the move, hence why they shifted their coins early.
ETH Price
At the time of writing, Ethereum is trading around $1,600, down 11% in the last week.
ETH has taken a plunge recently | Source: ETHUSD on TradingView
Featured image from iStock.com, charts from TradingView.com, Santiment.net