Editor's Note: As Hyperliquid's trading volume approaches that of traditional exchanges, what truly warrants attention is no longer just "how large the volume is," but rather which layer of the market structure it chooses to occupy. This article uses the division of labor between "brokers vs. exchanges" in traditional finance as a reference to analyze why Hyperliquid actively adopts a low-fee market layer positioning, and how Builder Codes and HIP-3 amplify the ecosystem while simultaneously creating long-term pressure on the platform's take rate.
Hyperliquid's path reflects a core issue facing the entire crypto trading infrastructure: after scaling up, how should profits ultimately be distributed?
The original text follows:
Hyperliquid is processing perpetual contract trading volumes nearing Nasdaq levels, but its profit structure similarly exhibits "Nasdaq-level" characteristics.
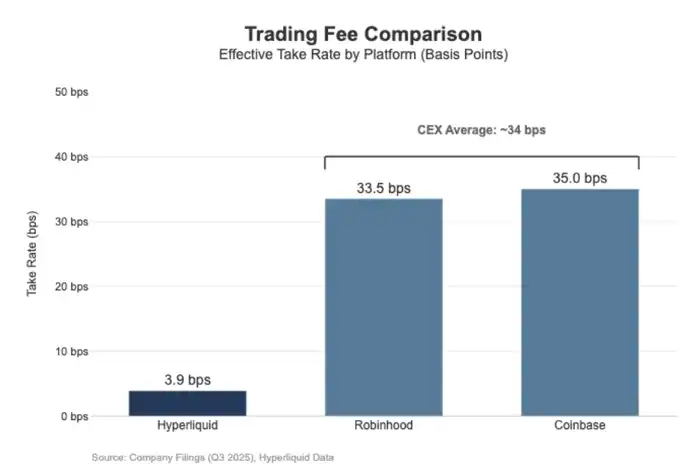
Over the past 30 days, Hyperliquid cleared $205.6 billion in perpetual contract notional trading volume (approximately $617 billion annualized quarterly) but generated only $80.3 million in fee revenue, translating to a fee rate of approximately 3.9 basis points (bps).
This means Hyperliquid's monetization approach is closer to a wholesale execution venue rather than a retail-facing, high-fee trading platform.
For comparison, Coinbase recorded $295 billion in trading volume in Q3 2025 but realized $1.046 billion in trading revenue, implying a take rate of approximately 35.5 basis points.
Robinhood's monetization logic for its crypto business is similar: its $80 billion in crypto asset notional trading volume brought in $268 million in trading revenue, an implied fee rate of about 33.5 bps; meanwhile, Robinhood's stock notional volume in Q3 2025 was as high as $647 billion.
Overall, Hyperliquid has joined the ranks of top-tier trading infrastructure in terms of volume, but in terms of fee structure and business model, it resembles a low-take-rate execution layer for professional traders rather than a retail-oriented platform.
The gap is evident not only in the fee level but also in the breadth of monetization dimensions. Retail platforms often profit simultaneously across multiple revenue "interfaces." In Q3 2025, Robinhood achieved a total of $730 million in transaction-related revenue, plus $456 million in net interest income, and $88 million in other revenue (primarily from Gold subscription services).
In contrast, Hyperliquid currently relies much more heavily on trading fees, and these fees are structurally compressed into the single-digit basis point range at the protocol level. This means Hyperliquid's revenue model is more concentrated, more singular, and closer to the low-fee, high-turnover infrastructure role, rather than a retail platform that monetizes deeply through multiple product lines.
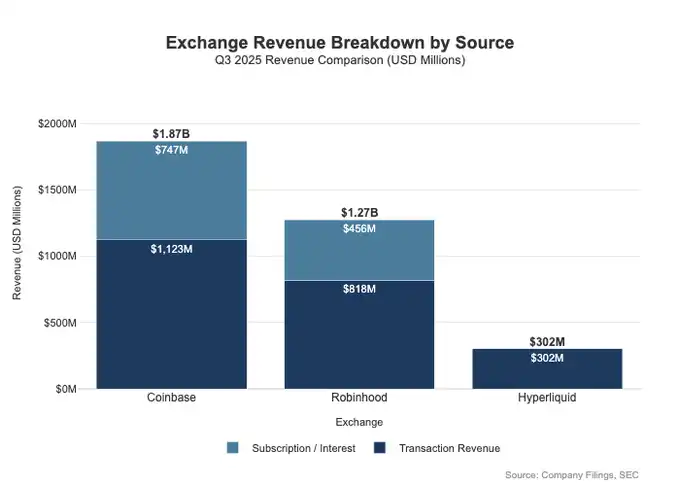
This can be explained by a fundamental positioning difference: Coinbase and Robinhood are brokerage/distribution businesses, monetizing through multiple layers leveraging their balance sheets and subscription systems; whereas Hyperliquid is closer to the exchange layer. In traditional financial market structures, the profit pool is naturally split between these two layers.
Broker-Dealer vs. Exchange Model
In traditional finance (TradFi), the core divide is the separation between the distribution layer and the market layer.
Retail platforms like Robinhood and Coinbase reside in the distribution layer, capturing high-margin monetization surfaces; whereas exchanges like Nasdaq reside in the market layer, whose pricing power is structurally constrained, and execution services are pushed by competition towards an almost commoditized economic model.
Broker/Dealer = Distribution Power + Customer Balance Sheet
Brokers control the customer relationship. Most users do not connect directly to Nasdaq but access the market through a broker. Brokers handle account opening, custody, margin and risk management, customer support, tax documents, etc., and then route orders to specific trading venues.
It is this "relationship ownership" that allows brokers to monetize in multiple ways beyond just trading:
Funds and Asset Balances: Cash sweep spreads, margin lending, securities lending
Product Bundling: Subscription services, feature packages, debit cards / advisory products
Routing Economics: Brokers control order flow and can embed payment or revenue-sharing mechanisms in the routing chain
This is why brokers often earn more than trading venues: the profit pool is truly concentrated at the "distribution + balances" location.
Exchange = Matching + Rules + Infrastructure, Take Rate Limited
Exchanges operate the trading venue itself: the matching engine, market rules, deterministic execution, and infrastructure connectivity. Their main monetization methods include:
Trading fees (continuously pressured lower in highly liquid products)
Rebates / Liquidity incentives (often returning most of the nominal fee to market makers to compete for liquidity)
Market data, network connectivity, and co-location services
Listing fees and index licensing
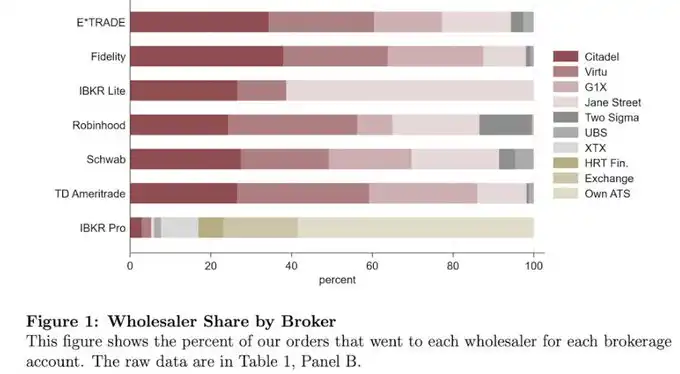
Robinhood's order routing mechanism clearly illustrates this structure: the user relationship is held by the broker (Robinhood Securities), and orders are then routed to third-party market centers, with economic benefits distributed along the routing chain.
The truly high-margin layer is at the distribution end, which controls customer acquisition, user relationships, and all monetization surfaces around execution (like payment for order flow, margin, securities lending, and subscription services).
Nasdaq itself resides in the thin-margin layer. The product it provides is essentially a highly commoditized execution capability and queue access, and its pricing power is strictly limited by mechanism.
The reasons are: To compete for liquidity, trading venues often need to return a large portion of the nominal fee in the form of maker rebates; regulatory caps on access fees limit the chargeable fee space;同时, order routing is highly elastic, capital and orders can quickly switch between different trading venues, making it difficult for any single venue to raise prices.
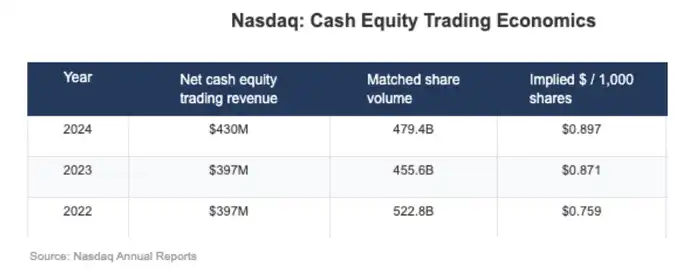
This is reflected very直观ly in Nasdaq's disclosed financial data: the net revenue it actually captures in cash equity trading is typically on the order of a few mils per share. This is a direct写照 of the structurally compressed profit space at the market layer exchange.
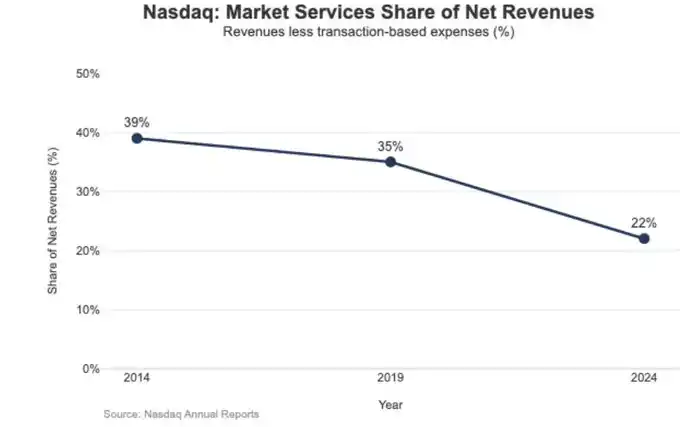
The strategic consequences of this low profitability are also clearly reflected in the changes in Nasdaq's revenue structure.
In 2024, Nasdaq's Market Services revenue was $1.020 billion, accounting for 22% of total revenue of $4.649 billion; this proportion was as high as 39.4% in 2014 and was still 35% in 2019.
This持续下滑 trend is高度一致 with Nasdaq's主动 shift from execution-based业务 highly dependent on market volatility and limited profits towards more recurring, predictable software and data businesses. In other words, it is the structurally low profit space at the exchange level that has pushed Nasdaq to gradually migrate its growth focus from "matching and execution" to "technology, data, and servitized products."
Hyperliquid as the "Market Layer"
Hyperliquid's effective take rate of approximately 4 basis points (bps) is高度一致 with its有意选择的 market layer positioning. It is building an on-chain "Nasdaq-style" trading infrastructure:
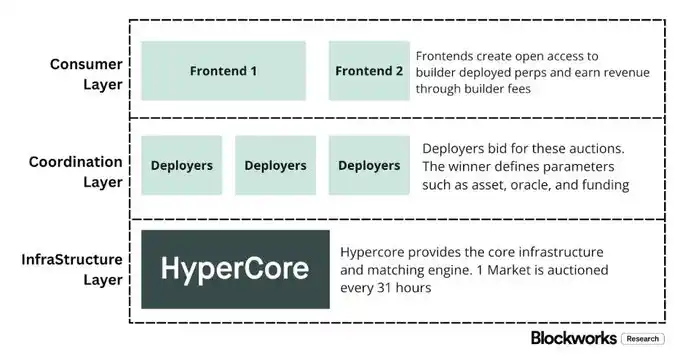
A high-throughput matching, margin, and clearing system centered on HyperCore, employing maker/taker pricing and market maker rebate mechanisms, aiming to maximize execution quality and shared liquidity, rather than multi-layer monetization面向 retail users.
In other words, Hyperliquid's design focus is not on subscriptions, balances, or distribution-based revenue, but on providing commoditized yet extremely efficient execution and settlement capabilities—this is a typical characteristic of the market layer and the inevitable result of its low-fee structure.
This is reflected in two types of structural splits that most crypto trading platforms have not yet truly implemented but are very typical in traditional finance (TradFi):
First, permissionless broker/distribution layer (Builder Codes).
Builder Codes allow third-party trading frontends to be built on top of the core trading venue and to charge their own economic fees. Among these, Builder fees have clear caps: up to 0.1% (10 bps) for perpetuals and up to 1% for spot, and fees can be set at the individual order level.
This mechanism thus creates a competitive market at the distribution layer, rather than having a single official application monopolize the user entry point and monetization rights.
Second, permissionless listing/product layer (HIP-3).
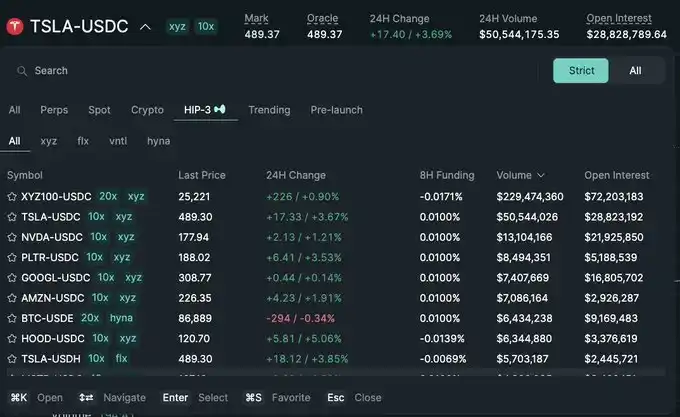
In traditional finance, exchanges typically control listing approvals and product creation. HIP-3 externalizes this function: developers can deploy perpetual contracts that inherit HyperCore's matching engine and API capabilities, while the definition and operation of specific markets are the responsibility of the deployer.
In terms of economic structure, HIP-3 clarifies the revenue-sharing relationship between the trading venue and the product layer: deployers of spot and HIP-3 perpetual contracts can retain up to 50% of the trading fees generated by the assets they deploy.
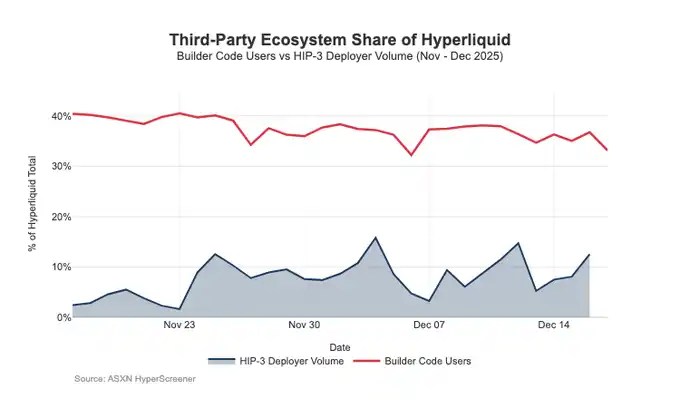
Builder Codes have already shown effectiveness on the distribution end: as of mid-December, approximately one-third of users trade not through the native interface but through third-party frontends.
The problem is that this structure, which favors distribution expansion, itself creates持续 pressure on the trading venue layer's take rate:
1. Pricing is compressed.
Multiple frontends simultaneously selling access to the same underlying liquidity will naturally compete towards the lowest total trading cost; and Builder fees can be flexibly adjusted at the order level, further pushing prices downward.
2. Loss of monetization surfaces.
The frontend controls account opening, product bundling, subscription services, and the complete trading workflow, thereby capturing the high-margin space of the broker layer; while Hyperliquid can only retain the thinner exchange layer take rate.
3. Strategic routing risk.
Once frontends evolve into true cross-venue routers, Hyperliquid could be forced into wholesale execution competition, having to defend order flow through fee reductions or increased rebates.
Overall, Hyperliquid is consciously choosing a low-profit-margin market layer positioning (via HIP-3 and Builder Codes), while allowing a high-profit-margin broker layer to grow on top of it.
If Builder frontends continue to expand, they will increasingly determine user-facing pricing structures, control user retention and monetization interfaces, and gain bargaining power at the routing level, structurally creating long-term pressure on Hyperliquid's take rate.
Defending Distribution Rights and Introducing Non-Exchange Profit Pools
The most direct risk is commoditization.
If third-party frontends can consistently undercut the native interface on price long-term, or even ultimately achieve cross-venue routing, Hyperliquid would be pushed towards a wholesale execution economic model.
Recent design adjustments show that Hyperliquid is trying to avoid this outcome while exploring new revenue sources.
Distribution Defense: Maintaining the Native Frontend's Economic Competitiveness
A previously proposed staking discount scheme, which allowed Builders to receive up to a 40% fee discount by staking HYPE, effectively provided third-party frontends with a path to be structurally cheaper than Hyperliquid's native interface. The withdrawal of this proposal equates to canceling direct subsidies for external distribution "price undercutting."
At the same time, HIP-3 markets were initially positioned to be distributed primarily through Builders and not displayed on the main frontend;但现在, these markets have begun to be displayed on Hyperliquid's native frontend, subject to strict listing standards.
This signal is very clear: Hyperliquid remains permissionless at the Builder layer but will not do so at the cost of sacrificing its core distribution rights.
USDH: Shifting from Trading Monetization to "Float" Monetization
The launch of USDH aims to recapture stablecoin reserve earnings that would otherwise be captured outside the ecosystem. Its公开 structure is a 50/50 split of reserve收益: 50% to Hyperliquid, 50% for USDH ecosystem growth.
Simultaneously, the trading fee discounts offered for USDH-related markets further reinforce this orientation: Hyperliquid is willing to concede on per-transaction economics in exchange for a larger, stickier profit pool tied to balances.
In effect, this introduces an annuity-like revenue stream for the protocol, whose growth depends on the monetary base size, not just nominal trading volume.
Portfolio Margin: Introducing Prime Broker-like Financing Economics
Portfolio margin unifies the margin for spot and perpetual contracts, allowing different exposures to offset each other, and introduces a native borrowing loop.
Hyperliquid will retain 10% of the interest paid by borrowers, making the protocol's economics increasingly dependent on leverage utilization and interest rate levels, not just trading volume. This is closer to a broker/prime revenue model than pure exchange logic.
Hyperliquid's Path Towards a "Brokerage-Style" Economic Model
In terms of throughput, Hyperliquid has already reached first-tier trading venue scale; but in terms of monetization, it still resembles the market layer: extremely high nominal trading volume paired with a single-digit basis point effective take rate. The gap with Coinbase and Robinhood is structural.
Retail platforms reside at the broker layer, controlling user relationships and fund balances, able to monetize multiple profit pools (financing, idle cash, subscriptions); whereas pure trading venues sell execution services, and under liquidity and routing competition, execution naturally tends towards commoditization, with net capture being持续 compressed. Nasdaq is the TradFi reference for this constraint.
Hyperliquid initially leaned明显 towards the trading venue prototype. By splitting the distribution layer (Builder Codes) and the product creation layer (HIP-3), it accelerated ecosystem expansion and market coverage; the cost is that this architecture could also push economics outward: once third-party frontends determine composite prices and can route cross-venue, Hyperliquid risks being squeezed into a thin-margin wholesale execution轨道.
However, recent actions show a conscious pivot: defending distribution rights and expanding revenue sources to "balance-based" profit pools, without abandoning the advantages of unified execution and clearing.
Specifically: the protocol is no longer willing to subsidize external frontends to be structurally cheaper than the native UI; HIP-3 is being displayed more natively; and balance sheet-style revenue sources are being introduced.
USDH pulls reserve earnings back into the ecosystem (50/50 split, with fee discounts for USDH markets); portfolio margin introduces financing economics through a 10% take on borrower interest.
Overall, Hyperliquid is converging towards a hybrid model: an execution rail as the foundation, overlaid with distribution defense and balance-driven profit pools. This reduces the risk of being trapped in a low-bps, wholesale-type trading venue, while moving closer to a brokerage-style revenue structure without sacrificing the advantages of unified execution and clearing.
Looking ahead to 2026, the unresolved question is: Can Hyperliquid move further towards a brokerage-style economy without破坏 its "outsourcing-friendly" model. USDH is the clearest test case: at the current supply level of approximately $100 million, expansion through外包发行 appears relatively slow when the protocol doesn't control distribution.
An obvious alternative path could have been UI-level defaults—for example, automatically converting the roughly $4 billion USDC存量 into the native stablecoin (similar to Binance's auto-conversion for BUSD).
If Hyperliquid wants to truly capture broker-layer profit pools, it might also need brokerage-style behavior: stronger control, tighter native product integration, and clearer boundaries with ecosystem teams regarding distribution and balance competition.