Using AI for Weather Prediction: Earn $200 a Day While Doing Nothing?

marsbitОпубликовано 2026-03-18Обновлено 2026-03-18

Введение

Using AI for Weather Prediction: Can You Really Earn $200 a Day? This article explores how to leverage AI and data analysis to profit from weather prediction markets like Polymarket, focusing on Shanghai’s temperature forecasts. The system relies on Shanghai Pudong Airport (ZSPD) weather station data, sourced via Wunderground, rather than general city forecasts. Key insights include: - Temperature data is reported in whole Fahrenheit values in METAR format, not Celsius, affecting precision. - Historical data shows daily high temperatures most frequently occur between 11:00-13:00, peaking at 12:00 in summer (27.6% of days). Three effective prediction methods were implemented: 1. **Integrated Forecasting**: Combines Weather Company (WC) and ECMWF model data, weighted by weather conditions (e.g., sunny days favor WC). 2. **Real-Time Correction**: Uses morning temperature rise data and historical patterns to extrapolate the daily high, adjusted for cloud cover and wind. A Kalman filter dynamically weights real-time data vs. forecasts. 3. **Temperature Trend Model**: Predicts whether the day will be warmer/cooler than the previous day using pre-dawn data (pressure changes, wind, cloud cover, recent trends). It performs best in winter (clear signals) but poorly in autumn (63.7% accuracy). Two failed methods—Fourier analysis (systematic underestimation) and ERA5 peak-time prediction (insufficient precision)—were discarded. Case studies demonstrate the system...

Weather is not like elections—it has no stance; it's not like the NBA—it has no home team. But it is precisely this market that has attracted domestic users. The reason is simple: everyone has a feeling about it, and everyone thinks they understand Shanghai's weather.

But "feeling like you understand" and "being able to make money" are two different things.

Biteye shares three things today:

1. Understand the settlement rules

2. Establish a method for weather prediction

3. Use a system to find trading opportunities others can't see

1. First, Figure Out: How Exactly Does This Weather Market Settle?

1. The temperature settled is not what you think it is

Many people make a mistake when participating for the first time: they check their phone's weather app and bet on the highest temperature accordingly. But the app shows the temperature in downtown Shanghai, while Polymarket settles using the actual measured data from Shanghai Pudong International Airport (ZSPD weather station). This data is publicly available through the American weather platform Wunderground, and PM directly reads the records on WU as the basis for settlement.

Two locations, two numbers. Pudong Airport is located on the east side of the city, right next to the Yangtze River estuary, and is affected by sea breezes, so the temperature is usually lower than in the city center. This difference isn't usually noticeable, but near the threshold boundaries, it can be the difference between a correct and incorrect bet.

So you can see this kind of confusion in the weather market comments: "It clearly felt warmer today than yesterday, why is the displayed maximum temperature lower?"

2. The number is correct, but the unit isn't what you think

WU's data comes directly from the METAR reports (the global aviation standard meteorological telegraph format) reported hourly by the airport.

There's a detail hidden here: METAR records temperatures in whole Fahrenheit numbers, and WU displays this number without conversion or correction.

Most weather forecast systems and meteorological models output temperatures with decimal points. The more refined your model is, the easier it is to overlook this crude detail.

3. Shanghai Temperature Patterns

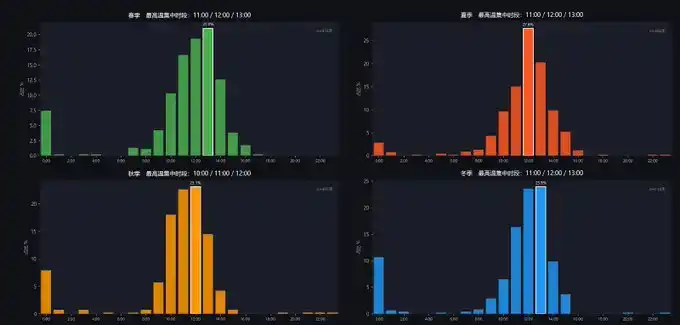
After scraping nearly 1900 days of data from the ZSPD station, the occurrence period of Shanghai's highest temperature is more concentrated than imagined:

· Highly concentrated between 11:00-13:00 across all four seasons,

· The concentration is highest at 12:00 in summer, with that single hour accounting for 27.6% of the entire season.

· The peak period in autumn is slightly earlier, with 10:00 also being one of the high-frequency periods.

Knowing the pattern is the first step, but patterns don't watch the market themselves. When the daily high temperature appears, whether it has been broken, and how far it is from the threshold.

So the editor built this system: to predict as accurately as possible which Celsius threshold the day's maximum temperature will fall into before daily settlement.
2. Five Methods, Three Worked

After understanding the market rules, the next question is: how to predict the day's maximum temperature?

As a weather novice, the first step was to ask ChatGPT: How does the meteorological industry actually calculate the day's maximum temperature, and what are the mature methods? ChatGPT provided a theoretical framework, and Claude turned the framework into code. Using the two AIs together, the system was built over a weekend.

Five methods were tried in total, but only three ended up working.

Those that worked:

1. WC + ECMWF Ensemble Forecast

Predicting the maximum temperature first requires data. Two sources were adopted:

· Weather Company (WC) is a commercial weather API providing hourly forecast data with high precision;

· ECMWF is the global meteorological model from the European Centre for Medium-Range Weather Forecasts, more sensitive to large-scale weather systems.

The two sources have their own pros and cons, so they were made to vote with weighted averages. The weights are dynamically adjusted based on the day's weather type: trust WC more on sunny days, trust ECMWF more on days with high cloud cover and wind speed.

2. Real-time Correction: Estimating the Peak Using Warming Data

The forecast was calculated last night, but today's weather is constantly changing. So what this module does is: use the actual measured data that has already happened this morning to estimate how high it can go today.

The logic isn't complicated; the editor found that 8-9 AM in Shanghai is the fastest warming period. After the system gets the measured temperature at this time, it checks historical data: for the same season, at the same time, how much higher did it get on average in the past.

Then add two corrections:

· Apply a discount for more clouds; the cloudier it is, the more the warming is hindered.

· Apply a discount for stronger wind; strong wind accelerates heat loss. This calculates an "extrapolation estimate."

Pressure, dew point, and humidity were also included in the calculation, but they were removed after backtesting showed these factors had a smaller, lower correlation impact.

But relying solely on extrapolation isn't stable enough. Here, a concept similar to Kalman gain is used. Simply put, it takes a weighted average between the "extrapolation result" and the "original forecast," and this weight changes automatically over time.

· At 6 AM, extrapolation only accounts for 20%, mostly still trusting the forecast

· By noon 12 PM, extrapolation accounts for 72%

· After 1 PM, it almost entirely trusts the actual measurements, accounting for 85%

The later it is, the more important the current events are; the earlier it is, the more reference value the historical forecast has.

After 2 PM, the system judges that the peak has most likely passed, directly takes the day's highest temperature from the historical record to lock in the result, and stops extrapolating.

3. Is Today a Warming Day?

This is the most satisfying module in the entire system. It makes a judgment every early morning: Will today's maximum temperature be higher than yesterday's?

Every day between 2-4 AM, the system collects a batch of meteorological data and feeds it to this model:

· Changes in air pressure over the past 3 hours and 12 hours

· Wind direction and speed in the early morning, cloud conditions

· The magnitude of warming/cooling yesterday, the temperature trend over the past three days, whether yesterday's temperature was above or below average

· Plus the month, season, the day of the year, whether it rained yesterday

The model output is divided into five levels: Warming Day, Slightly Warming, Flat, Slightly Cooling, Cooling Day, along with a confidence level.

However, the accuracy of this method varies greatly by season.

Most accurate in winter: When cold air arrives, pressure rises sharply, north winds strengthen—the signals are extremely clear, and the model can spot it instantly.

Worst in autumn: Cold and warm air masses repeatedly wrestle, temperatures rise today only to fall back tomorrow—historical patterns fail fastest in this season.

Eliminated methods:

1. Fourier Numerical Prediction

Initially tried using Fourier analysis to fit the periodic patterns of historical temperatures to see if it could directly predict the day's maximum temperature.

The result found that all it could tell you was "what the historical average is for this season." Shanghai's weather is too random; the Fourier fit produced a smooth average curve, not the real daily fluctuations. The error was 3.6°C, and it was 100% systematically underestimated, so it was deleted.

2. ERA5 Peak Time Prediction

ERA5 is the global historical reanalysis dataset from the European Climate Centre, used to predict what time the day's maximum temperature will occur.

Backtest results:

· ≤1 hour accuracy 59.6%

· ≤2 hours accuracy 81.3%

It sounds okay, but the problem is that PM's precision is higher, leaving traders with a very short time window for judgment. If it can't predict the peak within half an hour, it's better to just watch Polymarket's data, so this method was淘汰 (eliminated).

3. System in Practice: Two Cases and Shortcomings Reflection

Polymarket's weather market opens for trading 4 days in advance. Popular temperature thresholds are usually fully priced early in the market opening. Buying directly on high-probability thresholds offers a poor risk-reward ratio.

So the strategy the editor adopted is: wait for the signal, wait for the time window after warming, and then enter the market.

Based on the self-built weather system, the following two operations were performed:

Case 1:
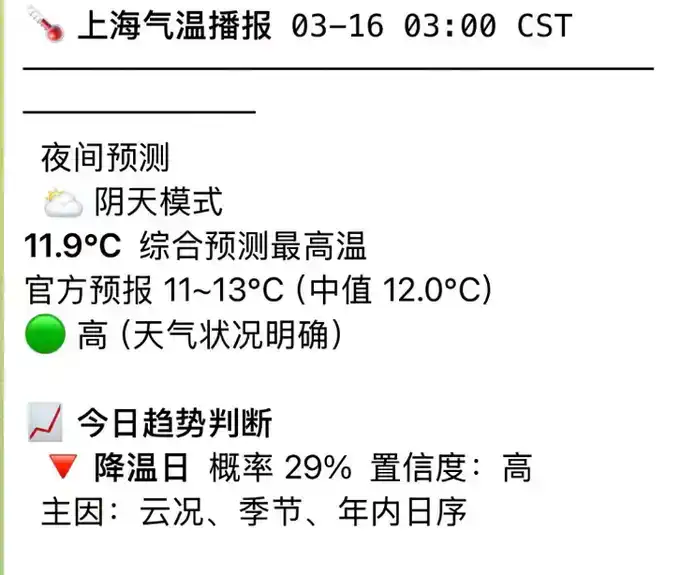
On the early morning of the 16th, the Telegram channel pushed a report from the night mode: tomorrow is a cooling day. The reasons were that the cloud cover was thick that night, and both the season and the day of the year pointed towards cooling.

The editor did not bet immediately at this point. The early morning signal was just the first layer of reference.

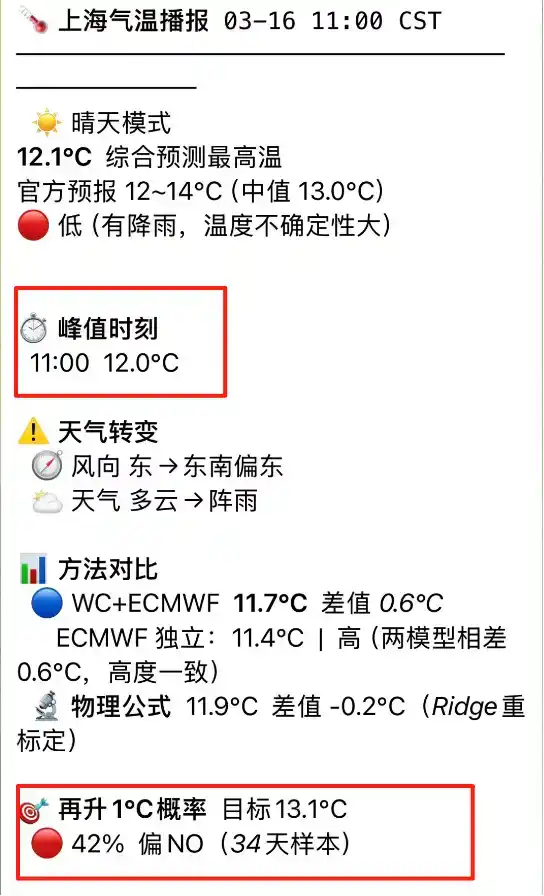
By 11 AM, the system pushed a real-time report during the warming period. The actual measured high temperature had already reached 12°C, and the +1°C probability score gave a result: the probability of rising another 1°C today was 42%, leaning towards not warming further.

Combined with the slightly cooling signal from the early morning logistic regression, the two modules were in agreement. The signal was much clearer now than in the early morning. So a bet was placed that the 16th's maximum temperature would not exceed 13°C.

Settlement that day: 12°C. The previous day, the 15th, was 15°C, a drop of 3 degrees.

Case 2:
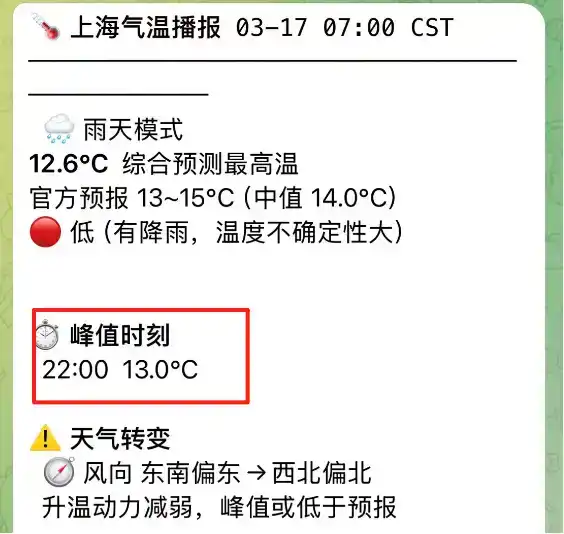
Another example is Shanghai's weather on the 17th (today). The weather system can also serve as an early warning: the push received at 7 AM showed an abnormal peak time: 22:00

Normally, the peak temperature on a sunny day appears between 1-3 PM, but today's peak is at 10 PM, indicating this is not solar heating but warm, moist air transport at night. It rained all day, with cloud cover 97-100%, and almost zero sunshine.

At this point, opening Polymarket, the price for 12°C was still at 53%. Someone in the community was confused: It's already afternoon, the temperature is only 11°C, the normal peak period is long gone, why are people still buying 12°C?

Behind this confusion is that people are still using sunny day logic to judge a rainy day market.

The system is not confused. It identified today's weather type clearly in the morning: abnormal peak time, obvious deviation between the current temperature and market expectations. This is an information gap, and the information gap is a trading opportunity.

This is precisely the meaning of building this system: Easier to identify opportunities; faster to warn of risks.
What are the system's shortcomings?

A system built over a weekend cannot be without flaws:

· Autumn accuracy is only 63.7%, close to a coin toss.

· Cold and warm air masses wrestle repeatedly this season, temperatures rise today and fall back tomorrow—historical patterns fail fastest in autumn.

· Pressure characteristics are not available in live trading. Pressure changes were used as a feature when training the model, and backtest results were good.

· The signal of cold air passing through is very clear. But during live operation, the current interface cannot obtain real-time pressure data.

· Coastal correction is still waiting for more data activation. The sea breeze effect at Pudong Airport is real, and the system has built a corresponding correction module, but there aren't enough backtest samples yet.

For a system that has only been running for a weekend, finding these problems is already a gain. Next step: fix it while running.

4. Conclusion

Meteorology has developed for hundreds of years, using satellites, supercomputers, and global models, yet weather forecasts still dare not guarantee 100% accuracy for tomorrow. It's not that scientists aren't trying hard enough; it's that the atmospheric system itself is chaotic. A one-degree difference in initial conditions can lead to completely different results.

This system, which has only been running for a weekend, will of course make mistakes. Autumn accuracy is nearly a coin toss, the system might not react in time if cold air arrives early, and the sea breeze effect hasn't been fully captured yet.

But that's not important. Participating in prediction markets doesn't require being right every time; it only requires having one more layer of information than the market when the odds are advantageous.


Трендовые криптовалюты

Связанные с этим вопросы

QWhat is the key difference between the temperature data used by Polymarket for settlement and the data shown on typical weather apps?

APolymarket uses the actual measured data from Shanghai Pudong Airport (ZSPD weather station) provided by Wunderground, which is typically lower than the temperature in the city center due to its coastal location. Weather apps often show the temperature for the urban area of Shanghai.

QWhat are the three methods that were successfully implemented in the AI weather prediction system?

AThe three successful methods are: 1. WC + ECMWF ensemble forecast, 2. Real-time correction using morning warming data to extrapolate the peak temperature, and 3. A model to predict if the day will be a warming day compared to the previous day.

QWhy was the Fourier numerical prediction method eliminated from the system?

AThe Fourier numerical prediction was eliminated because it had a high error of 3.6°C and systematically underestimated the temperature. It only provided a smooth average curve for the season and couldn't capture the real daily fluctuations of Shanghai's highly random weather.

QHow does the system's confidence in its 'real-time correction' forecast change throughout the day?

AThe system uses a Kalman gain concept to weight the 'extrapolated result' from real data against the 'original forecast'. In the early morning (6 AM), it relies 80% on the forecast and 20% on real-time extrapolation. By noon (12 PM), it relies 72% on extrapolation, and after 1 PM, it relies 85% on实测 (actual measurements), almost fully trusting the real data as the peak time has likely passed.

QWhat is the main trading opportunity the system is designed to identify on Polymarket?

AThe system is designed to identify information gaps or mispricings on Polymarket by providing more accurate and timely predictions of the day's maximum temperature. This allows the user to place bets on temperature brackets when the market's expectation, based on conventional logic (e.g., for a sunny day), differs from the system's prediction based on a deeper analysis of real-time data and weather patterns (e.g., for a rainy day with a late peak time).

Похожее

После трёх кварталов падения: получится ли у крипторынка стабилизироваться в третьем квартале?

Криптовалютный рынок пережил худший квартал с 2022 года, общая капитализация упала на 12,6% до $2,1 трлн, а дневные объемы торгов снизились на 20,9%. Впервые за три года сократилась и капитализация стейблкоинов. Основные факторы спада — отток средств из биткоин-ETF, распродажа биткоинов корпоративным казначейством Strategy и ужесточение монетарной политики ФРС. Второй квартал завершился чистым оттоком $46,7 млрд из ETF, при этом в июне отток достиг рекордных $45 млрд. Ключевым событием третьего квартала станет заседание ФРС 28–29 июля. Мягкий сигнал может поддержать биткоин в диапазоне $68 000–84 000 и вернуть приток в ETF, тогда как жесткая риторика способна сместить торговый диапазон к $50 000–56 000. Законодательная неопределенность также давит на рынок: прогресс по закону CLARITY Act, определяющему регуляторные границы, замедлился, и вероятность его принятия в 2026 году упала до 40–45%. Несмотря на общий спад, два сегмента показали рост: объемы на рынках предсказаний выросли на 48,7%, а торговля токенизированными коллекционными предметами увеличилась на 143%. Сектор RWA продолжает стабильно развиваться, достигнув $28,1 млрд. Рынок, вероятно, миновал фазу острой распродажи, но для устойчивого восстановления необходимы ясность от ФРС и регуляторный прогресс.

marsbit1 ч. назад

После трёх кварталов падения: получится ли у крипторынка стабилизироваться в третьем квартале?

marsbit1 ч. назад

BIT Торговые часы: BTC по-прежнему под давлением 200 EMA на недельном графике, после отскока возможен перезапуск нисходящего движения; секторы хранения данных и полупроводников, выросшие ночью, начали падение в вечерней сессии

**Краткий обзор рынка: BTC под давлением, коррекция на рынке акций, внимание к данным и событиям** Рынок криптовалют демонстрирует осторожное восстановление. Bitcoin торгуется около $66 000, сталкиваясь со значительным сопротивлением в районе $68 000, где сосредоточены объемные "застрявшие" позиции. Ключевые технические уровни — 200-недельная скользящая средняя (~$63 333) и 200-недельная EMA (~$68 328). Аналитики отмечают низкую ликвидность, характерную для летнего периода. На фондовом рынке после сильного роста во вторник наблюдается коррекция. Фьючерсы на основные индексы США снижаются. Акции полупроводниковой и памяти, которые резко выросли накануне, падают в ночных торгах. Исключением стал SMCI, который вырос более чем на 15% после оптимистичного прогноза. На общий настрой негативно влияют рост цен на нефть (более $91 за баррель Brent) и доходности государственных облигаций США (10-летние — около 4,64%), что возрождает инфляционные опасения. Азиатские рынки показали нестабильную динамику. Индекс KOSPI в Корее вырос на 0,74%, а японский Nikkei 225 снизился на 0,18%. Основной риск для региона — ослабление японской иены до минимумов с 1986 года, что повышает вероятность вмешательства властей. **Ключевые события для наблюдения:** * **24 июля:** Финансовые отчеты Alphabet (Google), Tesla, IBM. Событие AMD, посвященное ИИ. * **25 июля:** Решение по процентной ставке ЕЦБ и пресс-конференция Кристин Лагард. Финансовые отчеты Intel, American Airlines, Honeywell и других. Данные по числу первичных заявок на пособие по безработице в США.

marsbit1 ч. назад

BIT Торговые часы: BTC по-прежнему под давлением 200 EMA на недельном графике, после отскока возможен перезапуск нисходящего движения; секторы хранения данных и полупроводников, выросшие ночью, начали падение в вечерней сессии

marsbit1 ч. назад

Бывший глава CFTC и президент Circle Тарберт: призывает к долгосрочной стратегии, но сам выводит $30 млн

Бывший председатель CFTC и президент Circle Хит Тарберт, публично пропагандируя долгосрочное видение компании для инвесторов на фоне падения акций на 70% с пиковых значений, сам активно распродавал свои акции CRCL. С момента IPO Circle он по плану 10b5-1 продал более 360 тысяч акций, выручив около 30 миллионов долларов, и при этом ни разу не докупал акции на открытом рынке. Эта разница между его публичными заявлениями и личными действиями вызвала критику. Карьера Тарберта демонстрирует классическое использование «вращающейся двери» между регулирующими органами и частным сектором. Уйдя с поста председателя CFTC в 2021 году, через 27 дней он занял должность главного юрисконсульта в маркет-мейкере Citadel Securities, который в тот момент находился под пристальным вниманием из-за скандала с акциями GameStop. Позже, уже работая в Citadel, Тарберт выступал за расширение полномочий CFTC на крипторынок, в то время как его работодатель планировал выход на этот рынок. В 2023 году Тарберт присоединился к Circle, где его опыт и связи сыграли ключевую роль в успешном проведении IPO компании в 2025 году. Однако его последующие массовые продажи акций, совпавшие с падением котировок и его же призывами к долгосрочным инвестициям, ставят под сомнение искренность его уверенности в будущем компании. Критики видят в его карьере образец превращения регуляторного опыта и политических связей в личную выгоду, в то время как риски несут обычные инвесторы, верящие его нарративам.

marsbit1 ч. назад

Бывший глава CFTC и президент Circle Тарберт: призывает к долгосрочной стратегии, но сам выводит $30 млн

marsbit1 ч. назад

Gate Research: Взлет «уолл-стритизации» криптофинансовых продуктов — это конкуренция или интеграция?

**Аналитический обзор Gate Research Institute: Волна "уолл-стритизации" криптофинансовых продуктов — конкуренция или интеграция?** Создание биткоина в 2009 году было ответом на финансовый кризис и стремлением построить децентрализованную систему без доверенных посредников. Однако к 2026 году значительная часть биткоинов (около 7,14%) хранится через ETF таких гигантов, как BlackRock. Это символизирует глубокую интеграцию традиционных финансов (TradFi) и крипторынка. С появлением биткоин-ETF, фьючерсов, RWA (токенизированных реальных активов) и государственных облигаций на блокчейне, традиционные институты получают всё больше влияния на выпуск, ценообразование, кастодию и дистрибуцию криптоактивов. Однако это не одностороннее поглощение, а взаимодополняющая конвергенция. Криптосфера приносит TradFi глобальную 24/7 ликвидность и программируемость, а TradFi предоставляет криптосфере регулируемые каналы, институциональное доверие и массовый доступ. Яркий пример — две противоположные, но ведущие к одной цели траектории: * **Путь А:** Криптобиржи, такие как Gate, начинают с токенизированных акций и CFD, а затем напрямую подключаются к инфраструктуре традиционных брокеров, предлагая реальную торговлю акциями США, Гонконга и Кореи за стейблкоины. * **Путь Б:** Традиционные брокеры, такие как Robinhood, интегрируют криптоактивы, а затем создают собственные Layer 2 для токенизации своих акций, стремясь к круглосуточной торговле. Обе стратегии нацелены на создание **универсального финансового аккаунта будущего** — единой точки доступа к акциям, криптовалютам, ETF, токенизированным облигациям и другим активам. Ключевой конкурентной борьбой становится не между CEX и брокерами, а между этими "супераккаунтами". Параллельно, слой RWA и токенизированных гособлигаций растёт даже на медвежьем рынке, становясь "прослойкой" для объединения капиталов. Хотя этот рынок (около $150 млрд токенизированных казначейских облигаций) ещё мал по сравнению с традиционным ($30 трлн), он демонстрирует устойчивый структурный тренд, привлекающий крупнейшие финансовые институты (JPMorgan, DTCC и др.). **Вывод:** "Уолл-стритизация" — это не поражение идеалов децентрализации, а формирование новой гибридной модели. Децентрализованные протоколы продолжают работать на базовом уровне, в то время как на уровне приложений и пользовательского опыта формируется более эффективный, глобальный и свободный объединённый рынок капитала, где активы TradFi и DeFi торгуются бок о бок в одном интерфейсе. Уолл-стрит не завоевала криптосферу, а криптосфера не обошла Уолл-стрит — они совместно строят новые финансовые рельсы.

marsbit1 ч. назад

Gate Research: Взлет «уолл-стритизации» криптофинансовых продуктов — это конкуренция или интеграция?

marsbit1 ч. назад

S&P Dow Jones и Pantera выпускают криптоиндекс, биткоин оставлен за бортом из-за «отсутствия прибыли»

Стандард энд Пурс (S&P Dow Jones Indices) совместно с Pantera Capital запускает индекс S&P Pantera Digital Asset Index. Новый индекс включает 18 токенов, но исключает биткоин, XRP и мем-токены. Критерием отбора послужила «финансовая жизнеспособность», по аналогии с S&P 500: протокол должен демонстрировать положительный доход в течение нескольких кварталов и распределять стоимость среди держателей токенов. Это первое применение фундаментального подхода к оценке криптоактивов со стороны крупнейшего в мире провайдера индексов. В первую пятерку активов вошли Ethereum (ETH), BNB, Solana (SOL), TRON (TRX) и Hyperliquid (HYPE). Pantera отмечает, что совокупный годовой доход всех протоколов индекса превышает $30 млрд. Биткоин был исключен по трем причинам: он рассматривается как монетарный актив, доступный через отдельные ETF; он не генерирует доход протокола; а смешивание его в индексе с доходными активами затрудняет фундаментальный анализ для институциональных инвесторов. Пока индекс является эталонным, но Pantera ведет переговоры о создании на его основе ETF и других инвестиционных продуктов. Компания также отмечает значительный разрыв на рынке: многие институциональные инвесторы готовы к аллокации в криптоактивы, но им не хватает структурированных продуктов, фокусирующихся на активах с реальной экономической деятельностью.

marsbit1 ч. назад

S&P Dow Jones и Pantera выпускают криптоиндекс, биткоин оставлен за бортом из-за «отсутствия прибыли»

marsbit1 ч. назад

Торговля

Спот

Популярные статьи

Неделя обучения по популярным токенам (2): 2026 может стать годом приложений реального времени, сектор AI продолжает оставаться в тренде

2025 год — год институциональных инвесторов, в будущем он будет доминировать в приложениях реального времени.

1.9k просмотров всегоОпубликовано 2025.12.16Обновлено 2025.12.16

Неделя обучения по популярным токенам (2): 2026 может стать годом приложений реального времени, сектор AI продолжает оставаться в тренде

Обсуждения

Добро пожаловать в Сообщество HTX. Здесь вы сможете быть в курсе последних новостей о развитии платформы и получить доступ к профессиональной аналитической информации о рынке. Мнения пользователей о цене на AI (AI) представлены ниже.

活动图片