Терпение HODLеров с медвежьего цикла 2025 года, наконец, похоже, окупается.
В то время альткоины завершили цикл с глубокими двузначными потерями, несмотря на сильные фундаментальные показатели. Возьмем, к примеру, обновление Fusaka. Оно было в основном сосредоточено на увеличении пропускной способности Ethereum.
Какой был результат? Объем сетевых транзакций вырос на 36% к концу года, даже несмотря на то, что ETH закрыл год с падением на 29%.
С технической точки зрения, такое расширение объема обычно совпадает с улучшением ликвидности в блокчейне, поскольку более высокая активность приводит к лучшему движению капитала и более активному использованию сети.
В этом контексте 20-процентное движение Ethereum [ETH] за последний месяц выглядит меньше как случайный всплеск и больше как стратегический сдвиг, который начинает разворачиваться.

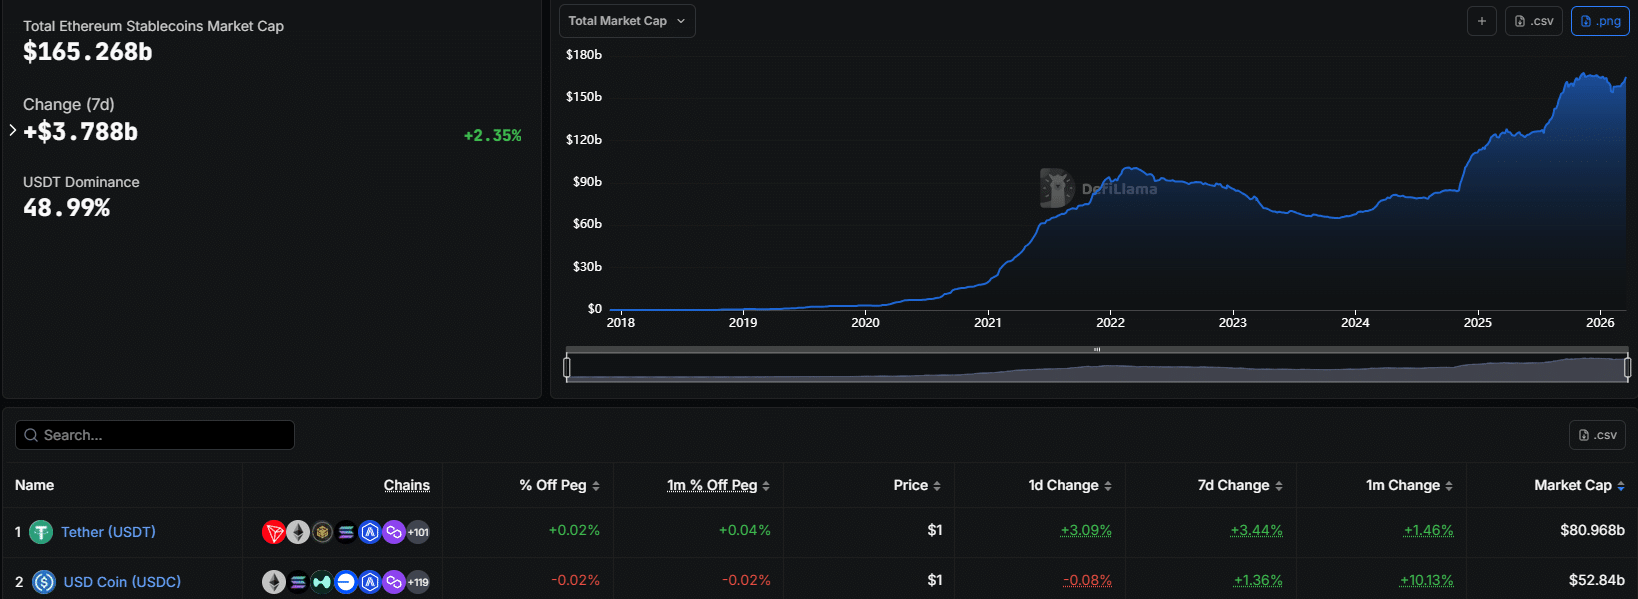
Как показывает график выше, потоки стейблкоинов в Ethereum явно меняют направление. За последний месяц ончейн-поток USDT вырос всего на 1,46%, в то время как объем предложения USDC увеличился на более значительные 10,13%. Это почти десятикратный разрыв, что свидетельствует о том, что ликвидность начинает отдавать предпочтение USDC, а не USDT.
Подтверждая это, данные Santiment показывают, что топ-100 кошельков с USDC в Ethereum теперь содержат USDC на сумму 32,71 миллиарда долларов. Что еще более примечательно, только первые шесть контролируют чуть более 25,6% от общего предложения, что указывает на высокий уровень концентрации среди крупных держателей.
Вместе это сигнализирует о явном сдвиге в позиционировании ликвидности, поскольку крупные игроки steadily накапливают USDC и меняют то, как они размещают капитал в сети Ethereum.
Естественно, это raises вопрос: это всего лишь краткосрочная ротация или «стратегический» сдвиг, который может подготовить почву для переоценки ETH?
USDC набирает обороты, в то время как USDT смещает фокус на Bitcoin
Потоки USDC в Ethereum позволили его доле на рынке превысить 32%, в то время как доля USDT упала ниже 50%.
Однако этот сдвиг, похоже, является чем-то большим, чем краткосрочная ротация. За последние 30 дней Tether направила примерно 20 миллионов долларов в инфраструктуру Bitcoin [BTC] Layer 1, что отражает deliberate стратегию по усилению роли BTC в качестве расчетного уровня.
На этом фоне растущий поток USDT в Ethereum не выглядит случайным.
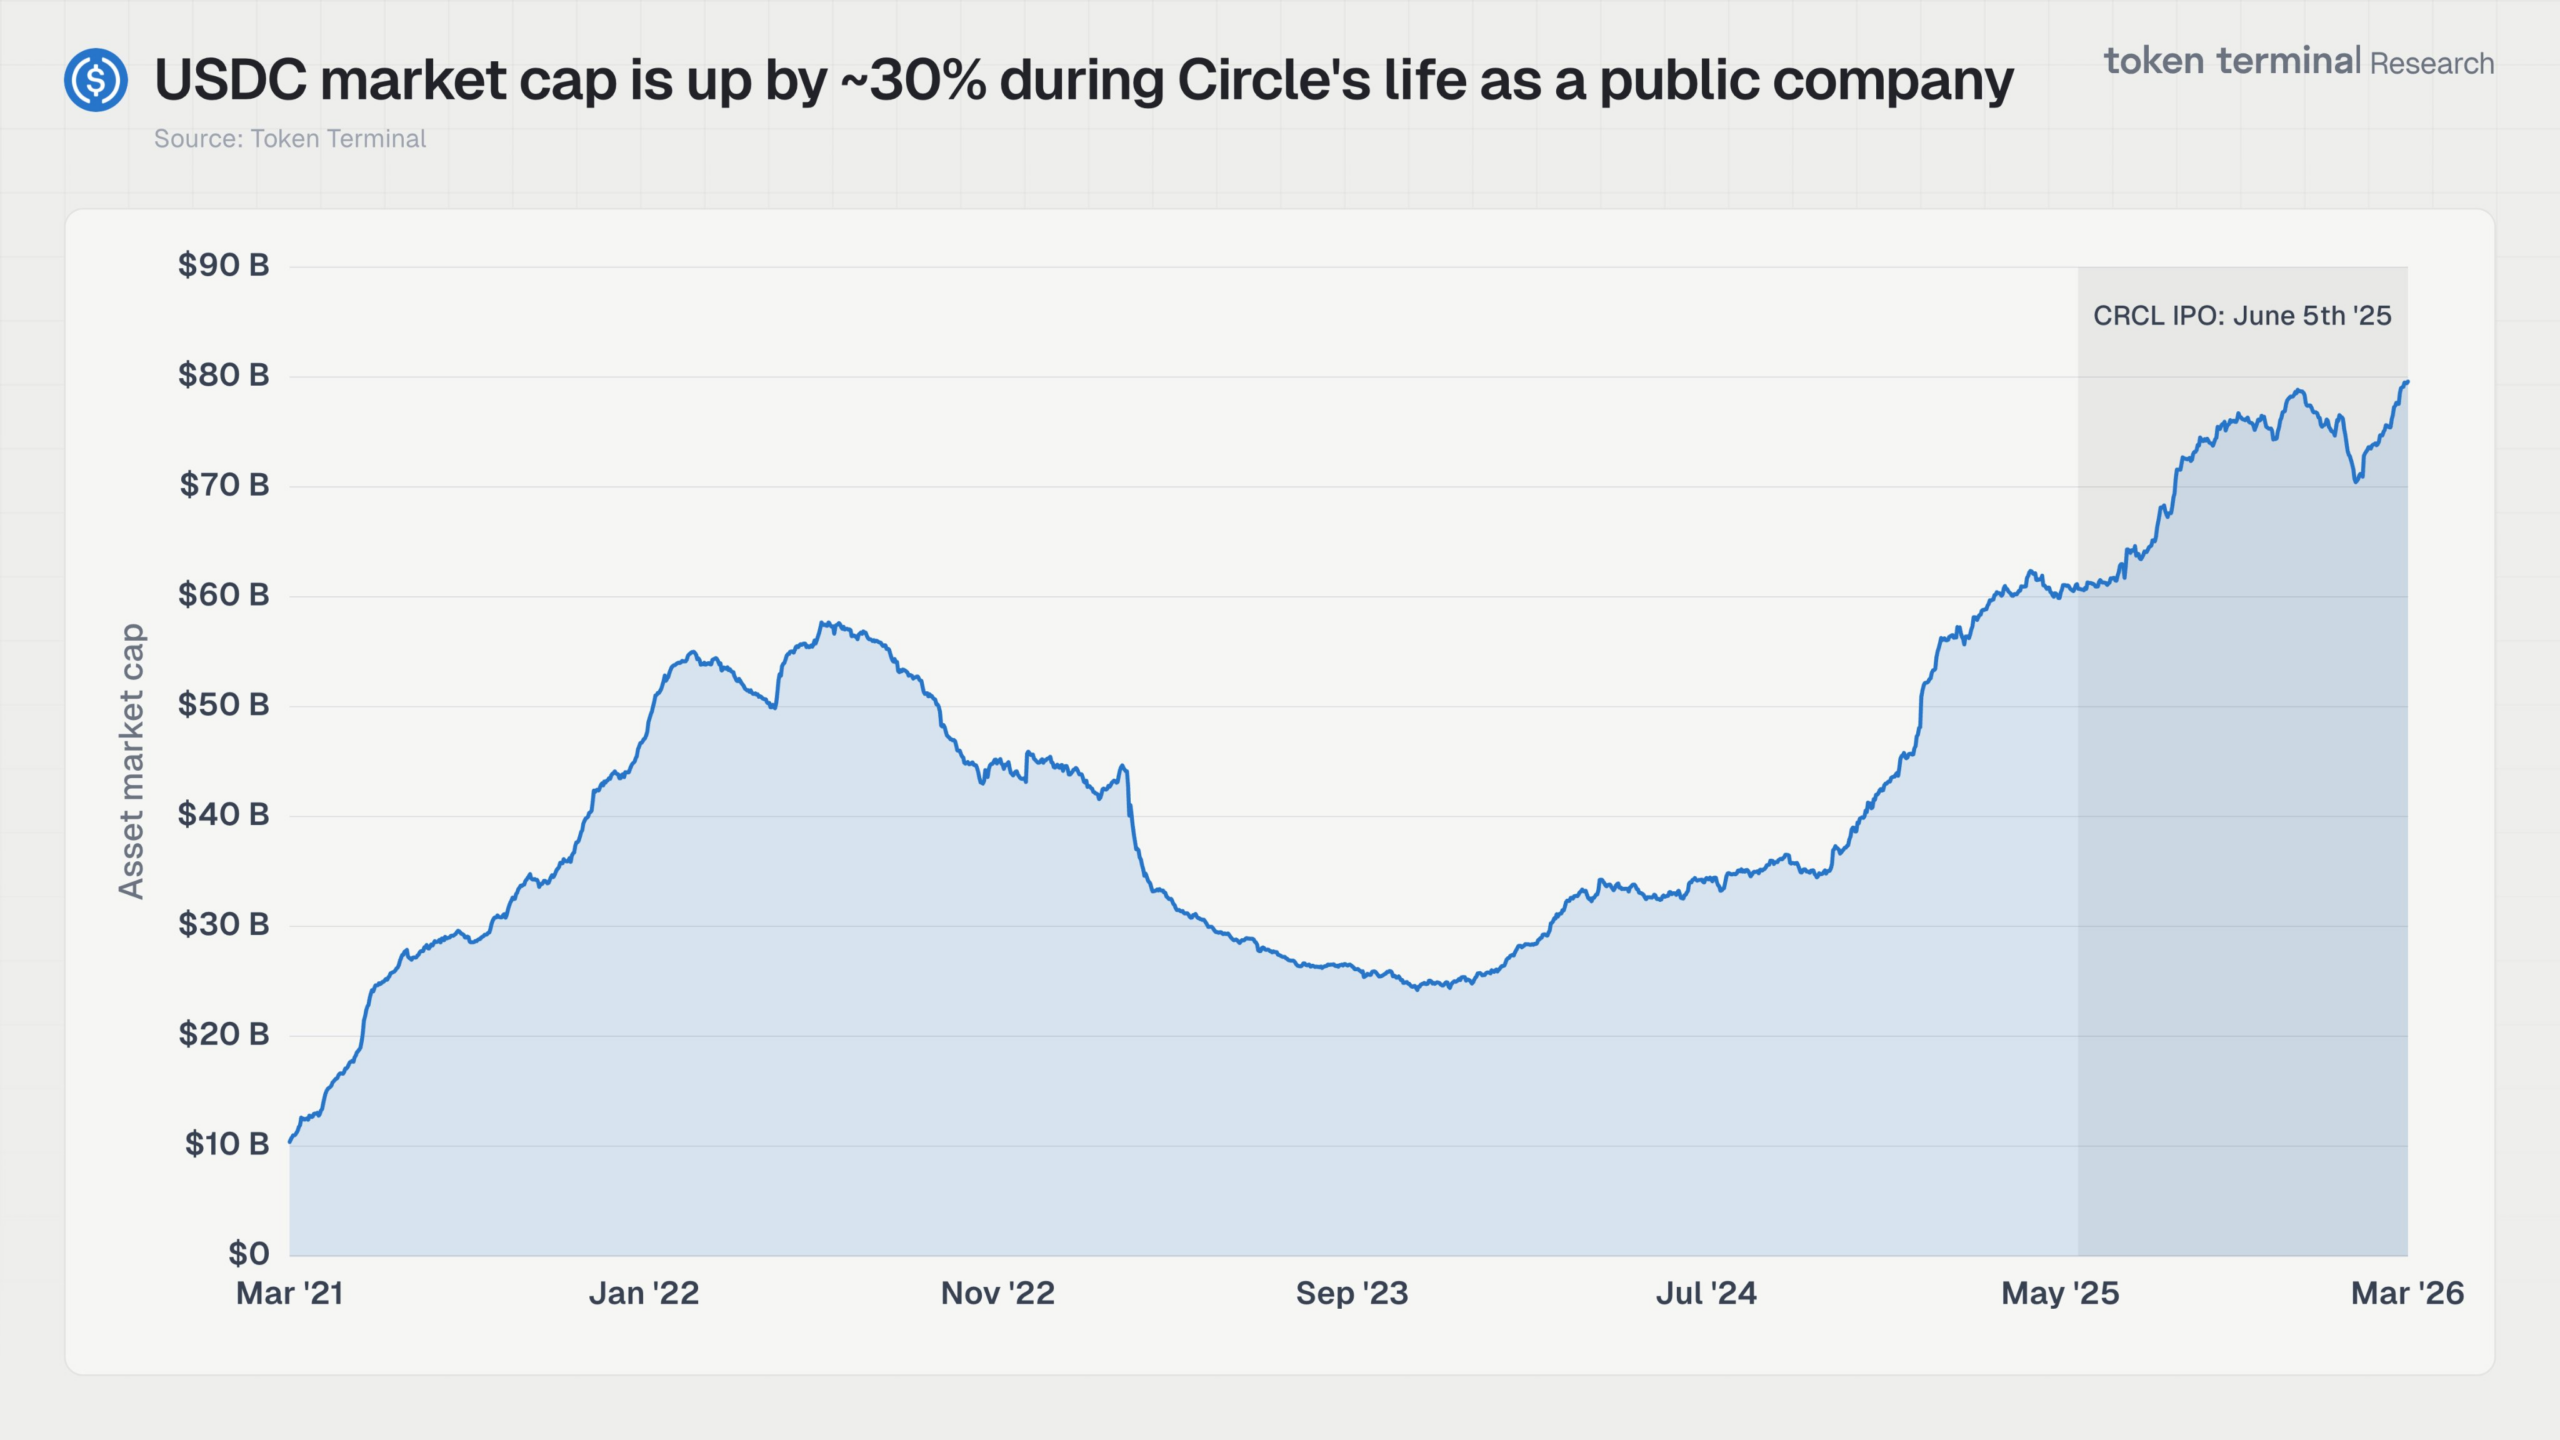
Вместо этого, этот контекст подкрепляется underlying данными. Рыночная капитализация USDC подскочила примерно на 30%, превысив 80 миллиардов долларов и достигнув рекордного уровня с момента IPO Circle в конце второго квартала 2025 года.
Более того, акции Circle [CRCL] выросли на 120% за последние 30 дней, что подчеркивает solid технические и рыночные показатели, подтверждающие ончейн-тренды.

В совокупности, ротация Tether в сторону Bitcoin в сочетании с растущей долей рынка Circle показывает, что крупные игроки стратегически меняют то, как они размещают стейблкоины в Ethereum.
Результат очевиден: рост USDC примерно на 10% за последний месяц тесно коррелирует с 20-процентным ростом цены ETH.
Примечательно, что ончейн-данные подтверждают этот тренд. CryptoQuant показывает, что общая заблокированная стоимость (TVS) ETH выросла почти на 3%, достигнув рекордного уровня в 38 миллионов ETH, в то время как общая стоимость реальных активов (RWA) за тот же период выросла примерно на 6%.
По сути, эффекты обновлений Ethereum 2025 года проявляются в его активности со стейблкоинами, причем потоки USDC теперь напрямую питают ончейн-активность. В этом контексте переоценка рынка Ethereum становится все более тесно связанной с потоками USDC, что делает это ключевым трендом для наблюдения.
Итоговое резюме
- Предложение USDC в Ethereum резко выросло более чем на 10% за последний месяц, чему способствовали крупные держатели и ончейн-активность, что сигнализирует о стратегической ротации, а не о краткосрочном движении.
- 20-процентный рост цены ETH коррелирует с ростом потоков USDC, увеличением стейкинга и ростом RWA, показывая, что обновления Ethereum 2025 года стимулируют активность стейблкоинов и влияют на рыночную переоценку.