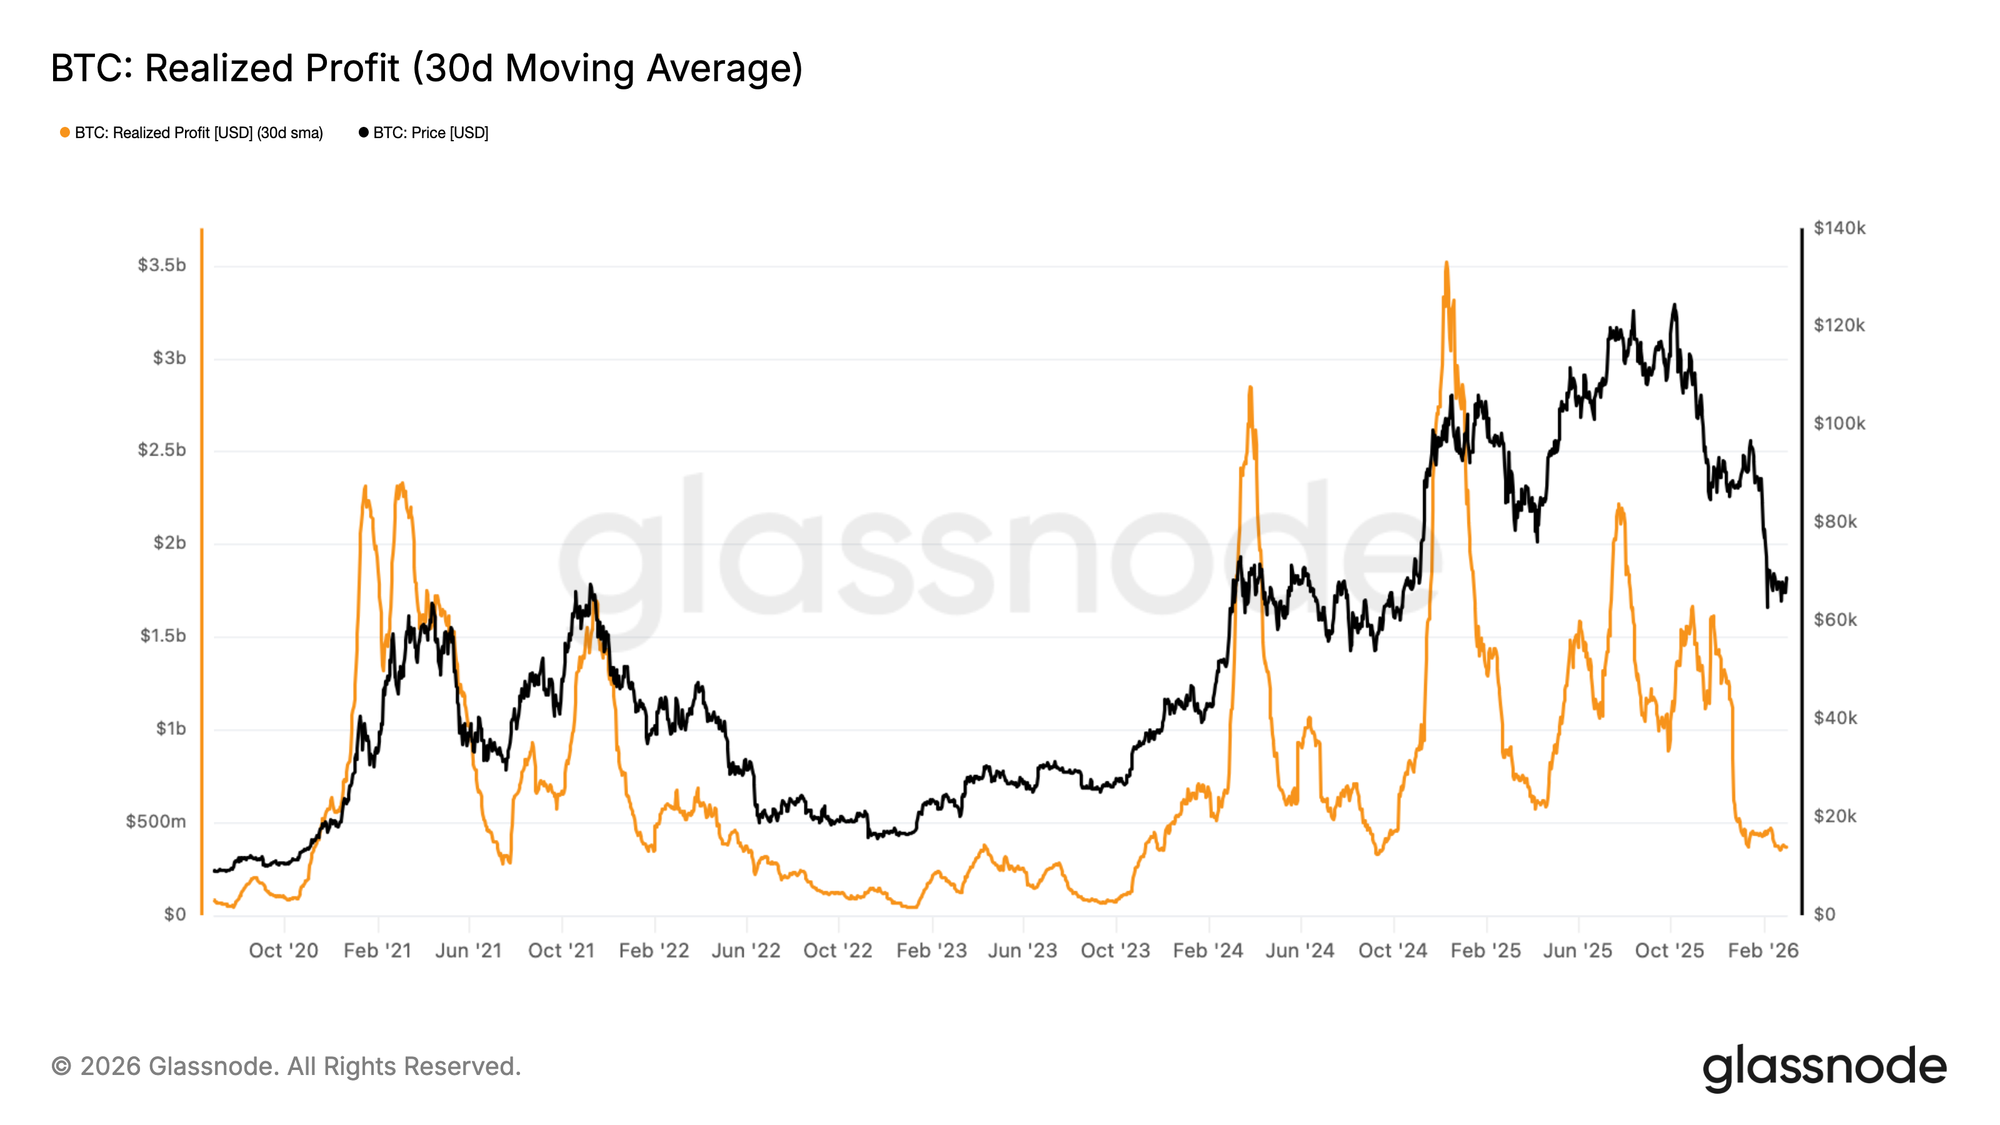
С начала февраля Bitcoin неоднократно не мог закрыть неделю выше отметки в $70 000, что установило этот регион как значимый уровень сопротивления на ближайшую перспективу. Чтобы оценить, отражает ли это ценовое отторжение реальное ухудшение спроса, мы обращаемся к 30-дневной простой скользящей средней (30D-SMA) реализованной прибыли — метрике, которая агрегирует прибыль в долларах США, зафиксированную участниками on-chain в момент расходования монет, сглаженную для фильтрации краткосрочного шума.
Поскольку цена стабилизировалась ниже порога в $70 000, этот индикатор резко сократился с более чем $1 млрд в день до приблизительно $370 млн в день, что составляет снижение примерно на 63%. Это сжатие усредненной за месяц реализованной прибыли сигнализирует о том, что когорта покупателей, готовых совершать сделки с премией, существенно сократилась, а покупательская ликвидность сейчас находится на самом низком уровне с периода августа–сентября 2024 года.
В совокупности доказательства свидетельствуют о том, что восходящий импульс остановился, оставив цену в состоянии бесцельной консолидации до появления новых катализаторов спроса.
Выявление режима на медвежьем рынке
Боковое движение цены — это повторяющаяся структура как на бычьих, так и на медвежьих рыночных циклах, поэтому контекст — это всё. Два периода горизонтальной консолидации могут иметь совершенно разные последствия в зависимости от базового режима спроса, что делает крайне важным поиск подтверждающих доказательств под ценой цены.
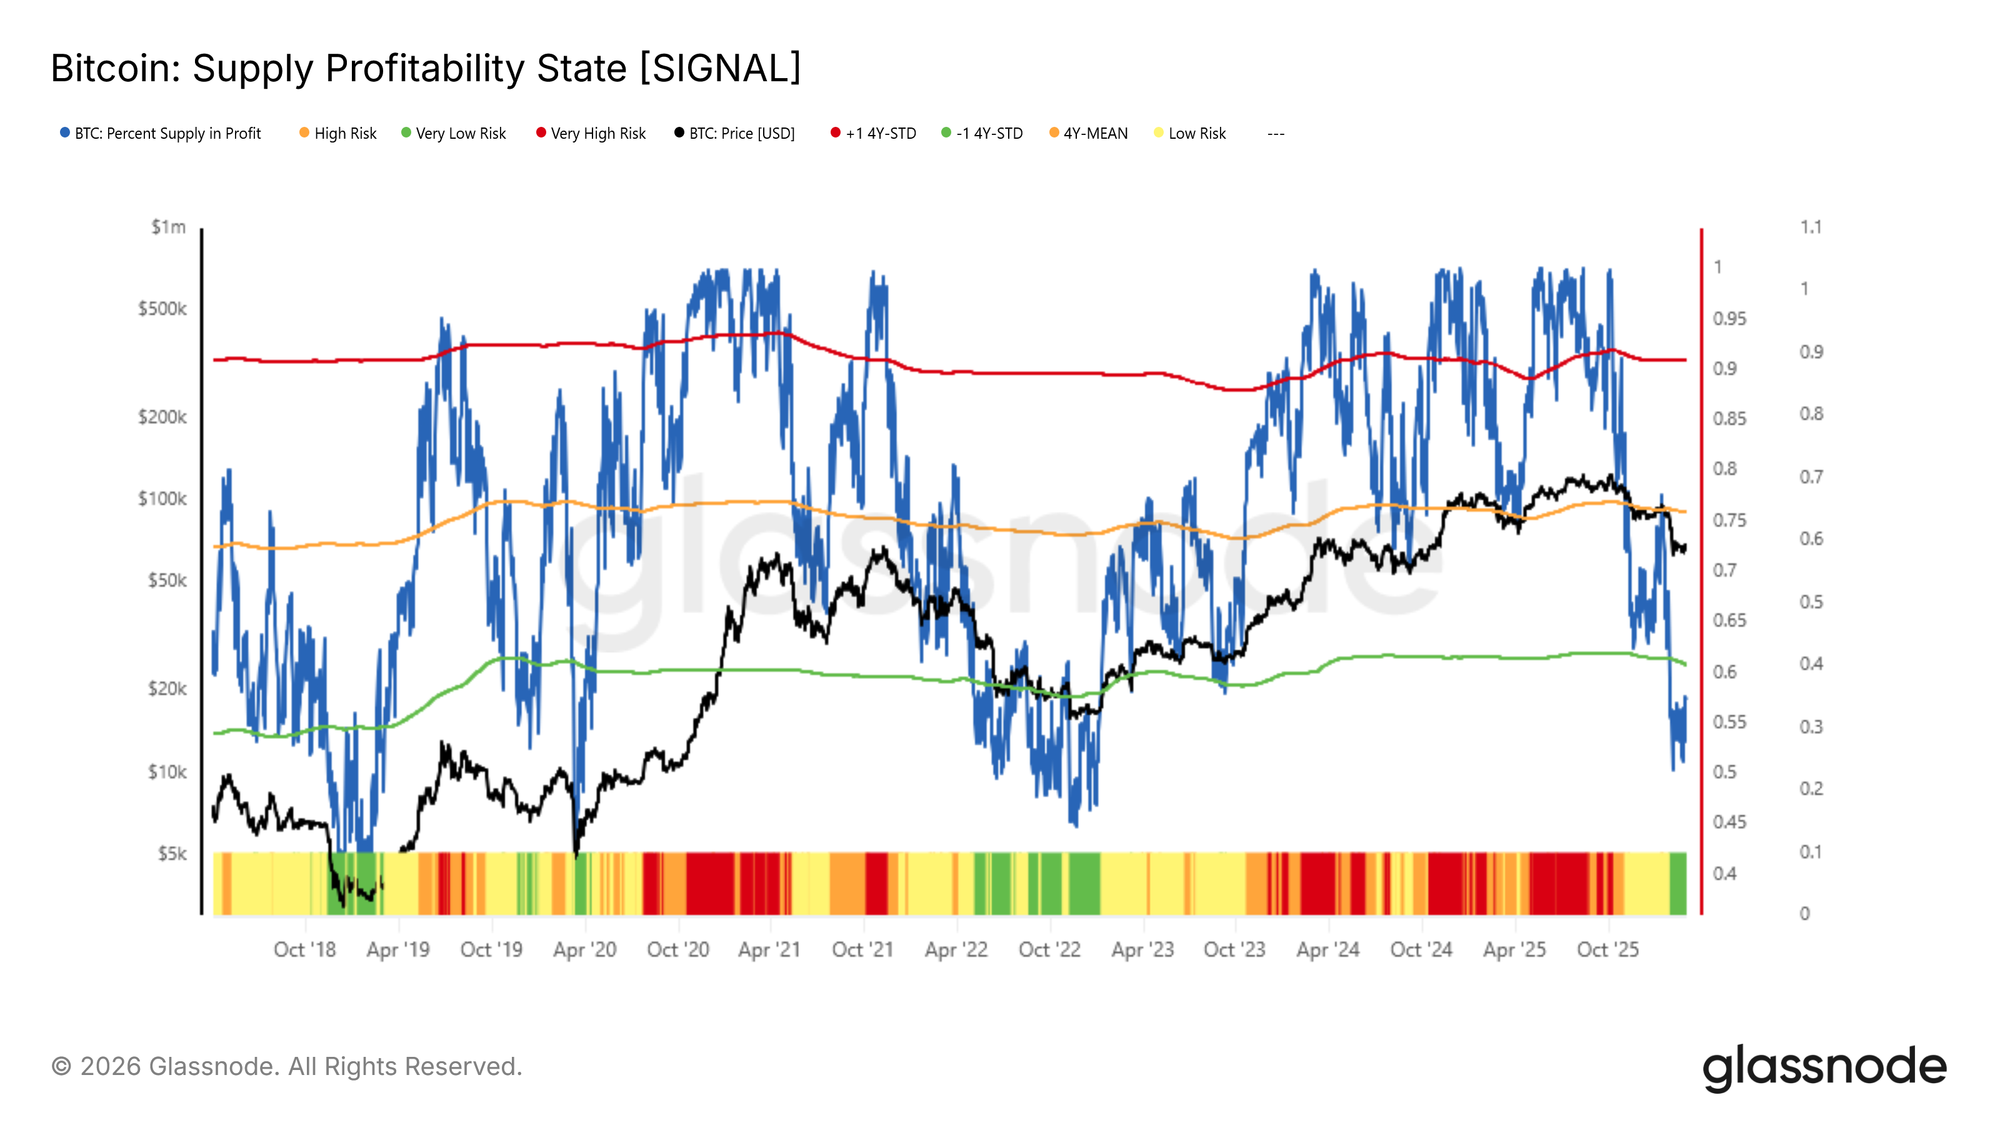
Одним из эффективных инструментов для этой цели является показатель Percent of Supply in Profit (Процент предложения в прибыли), который измеряет долю обращающегося предложения Bitcoin, удерживаемого с нереализованной прибылью относительно себестоимости приобретения каждой монеты в on-chain.
Когда этот показатель широко повышен, он отражает всеобщее доверие инвесторов; когда он ухудшается, это сигнализирует о растущей когорте держателей «в минусе» — условии, исторически ассоциируемом с устойчивым продавческим давлением.
С начала февраля этот индикатор опустился ниже своего порога в -1 стандартное отклонение около 60% и в настоящее время находится на уровне примерно 57%. Показатели на этом уровне исторически совпадали с ранними стадиями глубоких медвежьих рынков, наиболее заметно в мае 2022 года и ноябре 2018 года. Это позволяет предположить, что нынешняя консолидация может быть меньше трамплином для восстановления, а скорее продолжением преобладающего неблагоприятного рыночного режима в среднесрочной перспективе.
Краткосрочные восстановительные ралли и потолок себестоимости
Несмотря на встречные ветры, создаваемые сокращающейся покупательской ликвидностью и рыночным режимом, обделенным широкой нереализованной прибыльностью, многонедельная боковая консолидация не лишена конструктивной интерпретации. Подобное локальное равновесие может и часто предшествует краткосрочным восстановительным ралли.
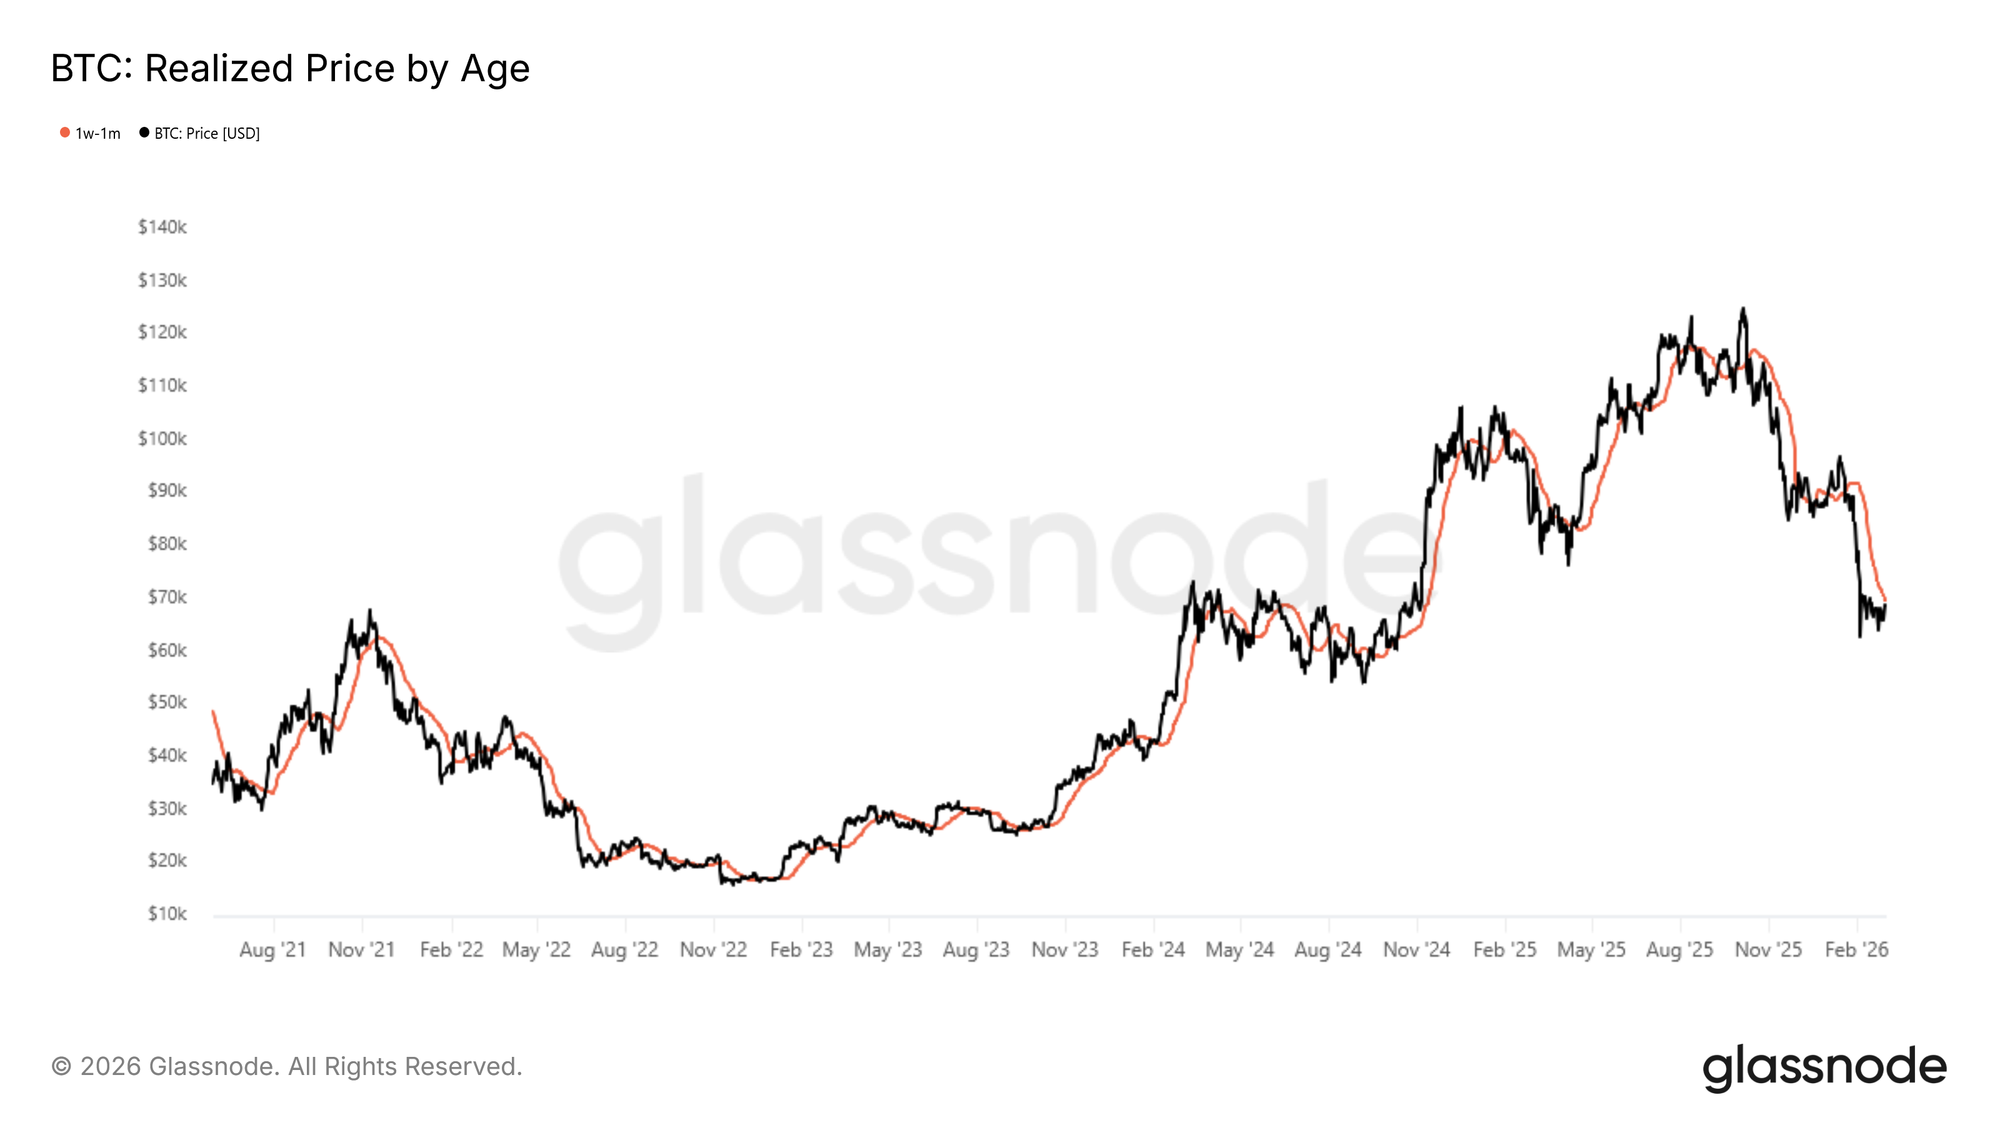
Практическим on-chain инструментом для оценки потенциальной точки истощения таких ралли является себестоимость краткосрочных держателей (Short-Term Holder Cost Basis), specifically для монет в возрасте от одной недели до одного месяца. Эта когорта представляет собой самую последнюю волну участников рынка, цена приобретения которых выступает ключевым поведенческим якорем: на более глубоких стадиях медвежьего рынка локальные отскоки tend to stall, когда эти недавние покупатели приближаются к точке безубыточности, что стимулирует их выходить из позиций или фиксировать небольшую прибыль до дальнейшего ухудшения условий.
В настоящее время себестоимость этой когорты держателей 1W–1M находится near $70 000, что означает, что зона ±2% вокруг этого уровня — roughly $68.5k to $71.5k — представляет собой значительную потенциальную зону сопротивления и дистрибуции для любого near-term восстановления цены.
Офф-чейн инсайты
Спотовые потоки показывают признаки восстановления
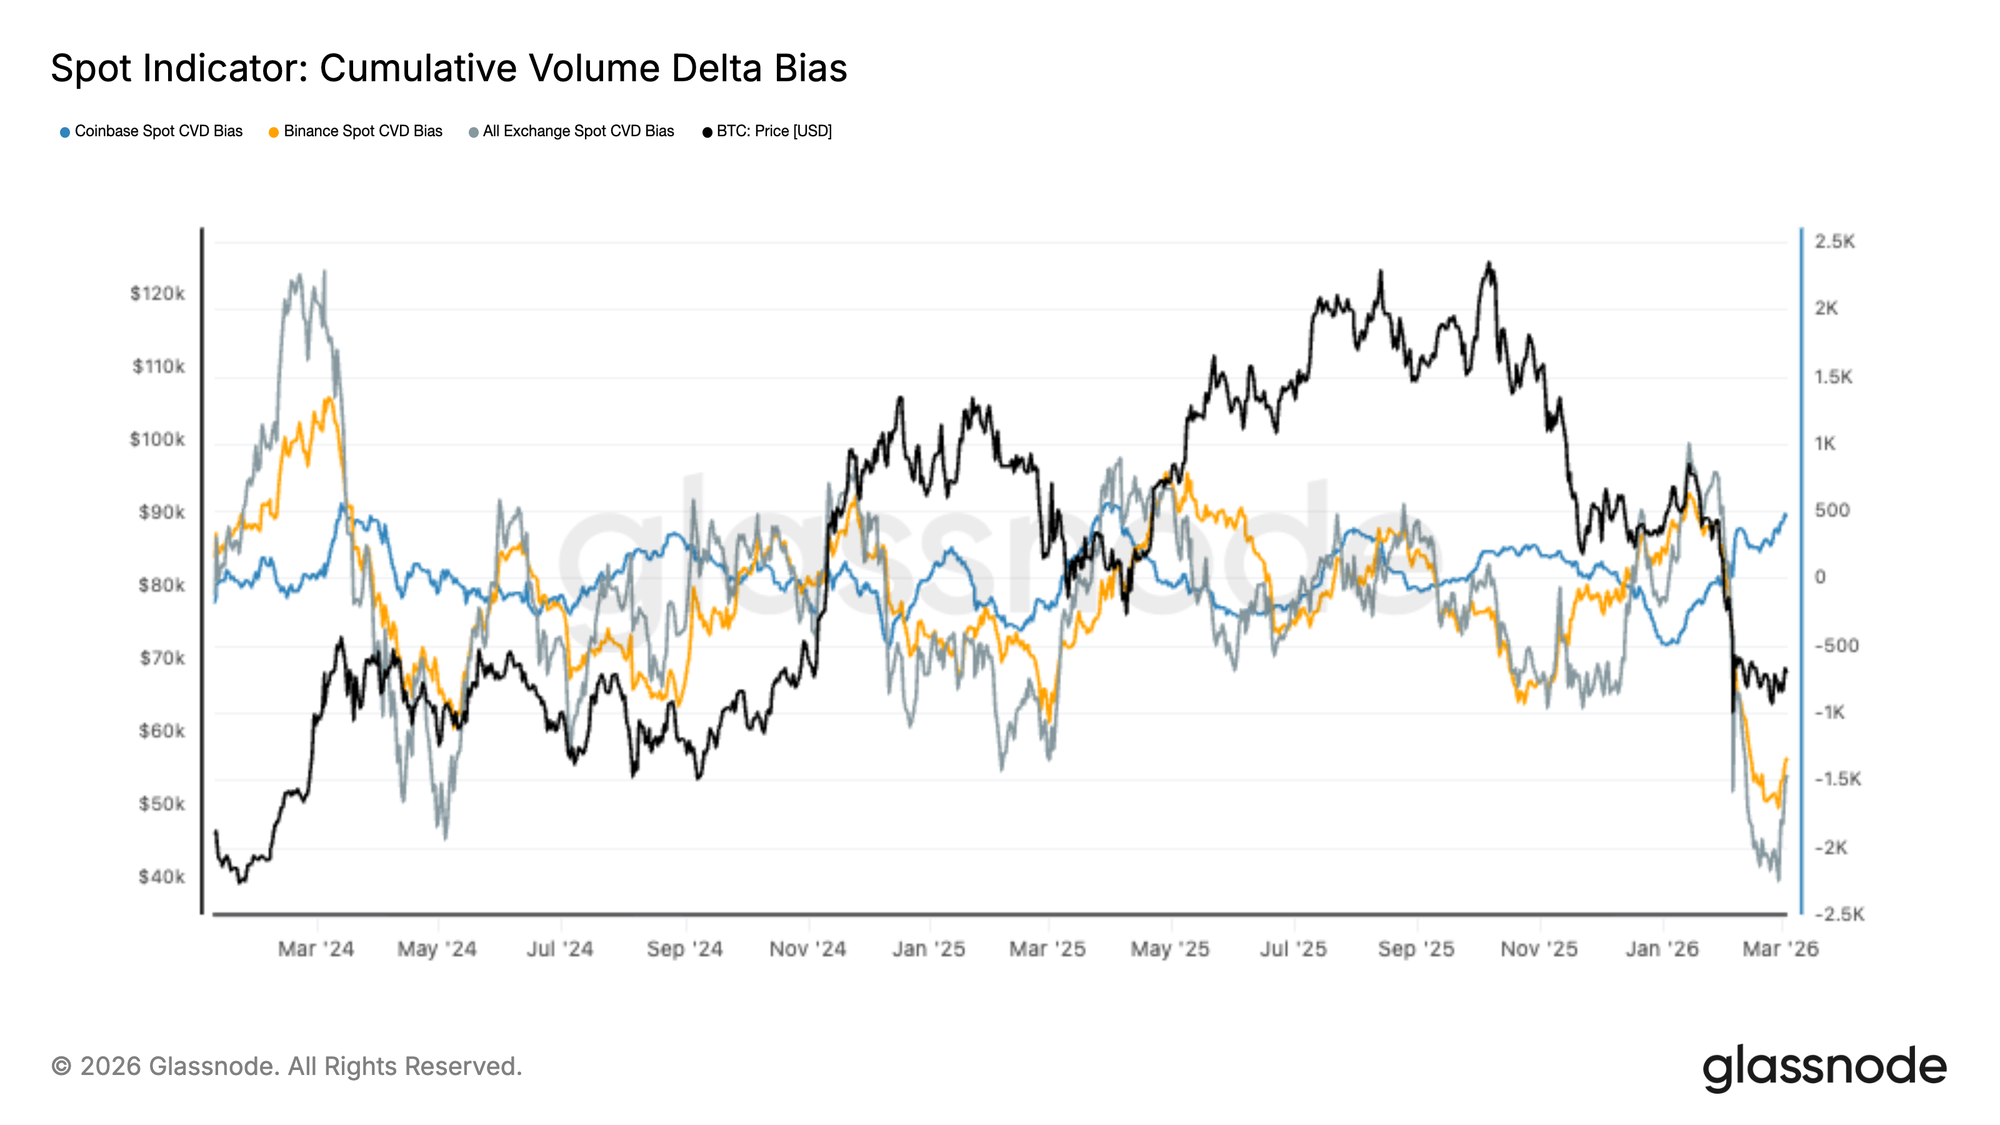
Недавно на спотовых рынках наблюдалась резкая волна доминирования продавцов: Cumulative Volume Delta (CVD) на крупных биржах упал до глубоко отрицательных уровней, поскольку агрессивные рыночные ордера на продажу спровоцировали последнее снижение цены.
Однако за последние несколько дней темпы продаж, по-видимому, moderating. Спотовый CVD на Coinbase начал восстанавливаться, что свидетельствует о ранних признаках возобновления активности со стороны покупателей, в то время как потоки на Binance и агрегированные биржевые потоки остаются слабыми, но уже не ускоряются вниз.
Этот сдвиг намекает на то, что самая интенсивная фаза спотовой дистрибуции может ослабевать. Тем не менее, устойчивое восстановление, вероятно, потребует более широкого улучшения поглощения спотовых заявок на покупку на нескольких биржах, прежде чем смогут установиться более сильные dynamics накопления.
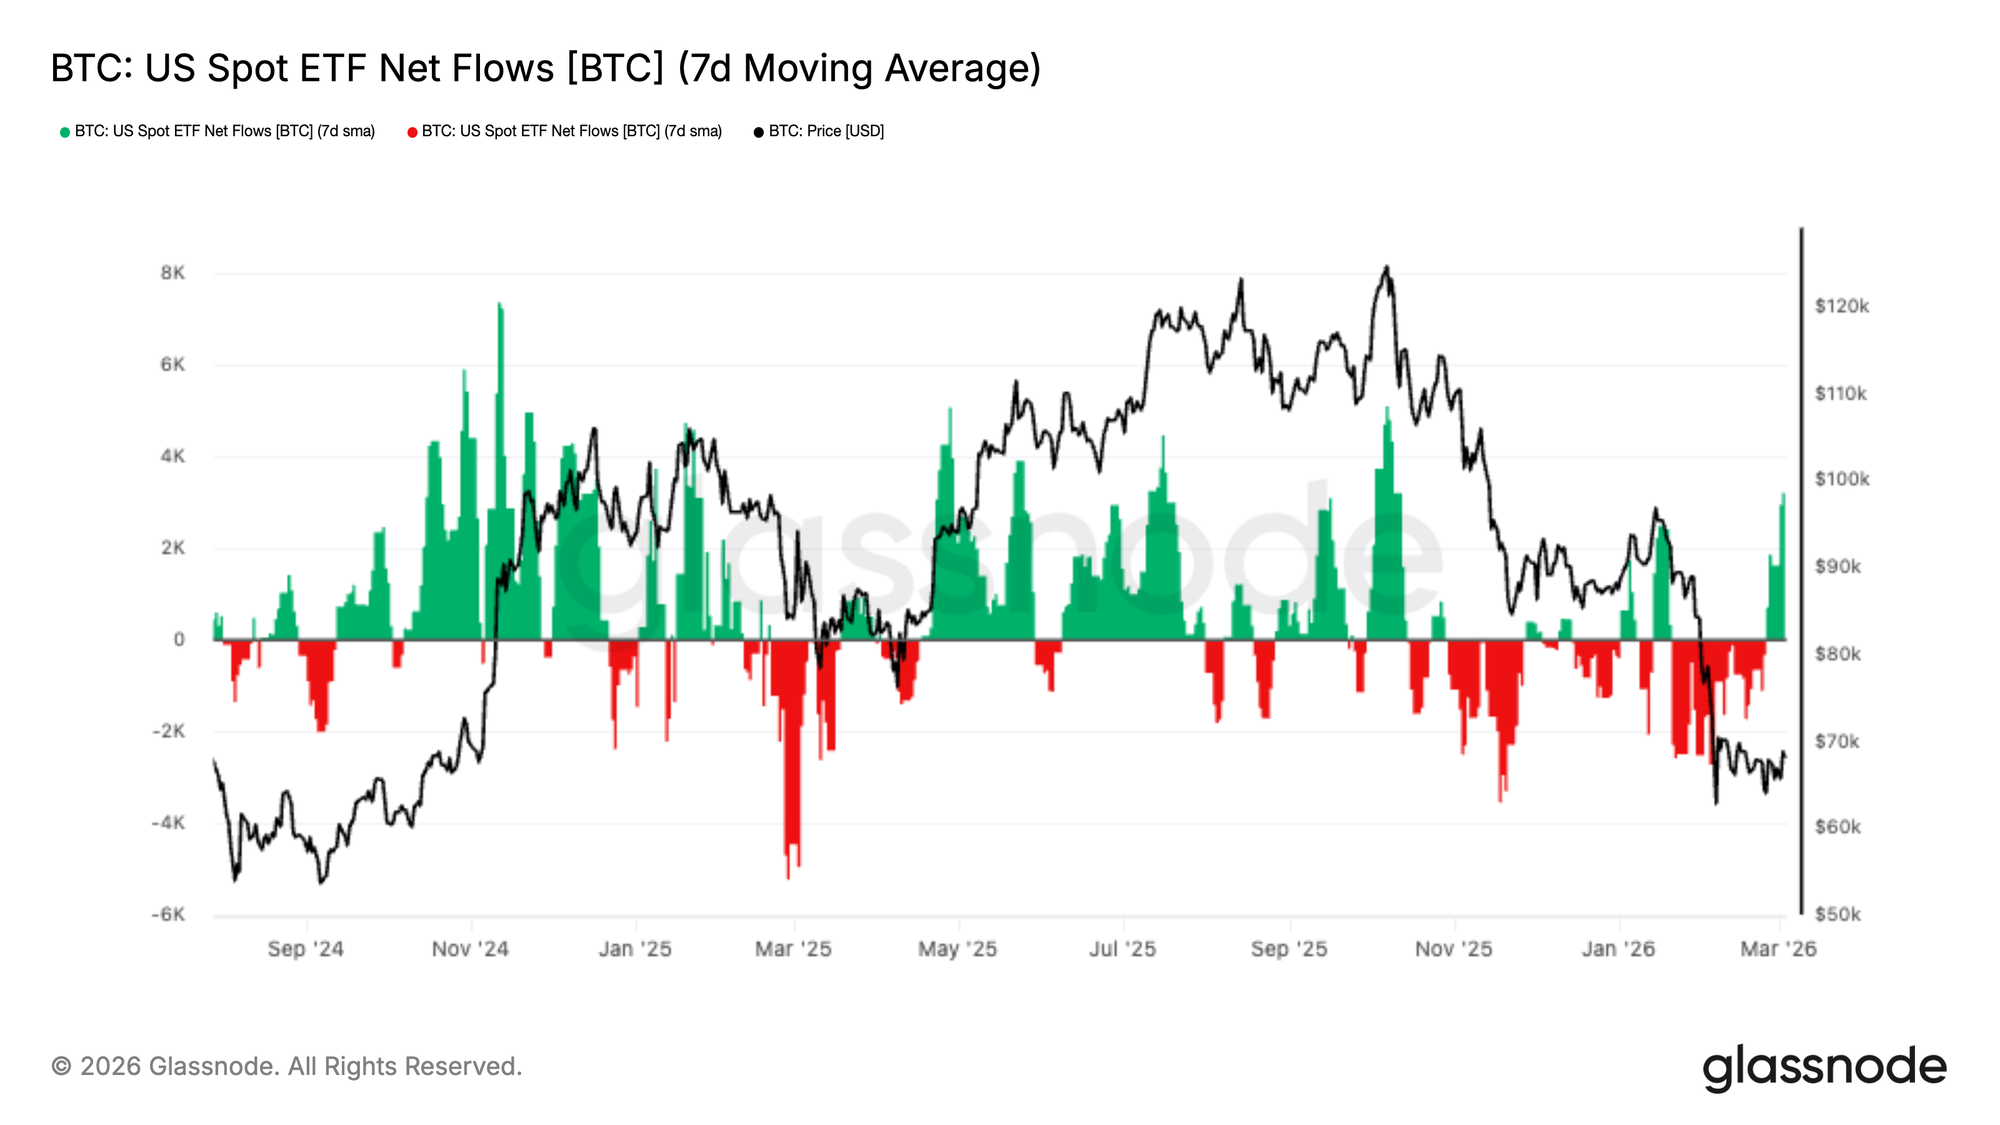
Оттоки ETF ослабевают, появляются ранние притоки
US Spot Bitcoin ETFs переживали устойчивые оттоки во время недавнего снижения рынка, что отражало persistent институциональное снижение рисков по мере снижения цен. 7-дневная скользящая средняя чистых потоков оставалась отрицательной в течение нескольких недель, усиливая общую среду избегания рисков на регулируемых инвестиционных каналах.
Однако за последние несколько дней потоки начали стабилизироваться, появились первые признаки возобновления притоков. Этот сдвиг suggests, что давление институциональных продавцов может moderating, поскольку Bitcoin консолидируется near недавних минимумов.
Хотя еще слишком рано подтверждать устойчивый разворот в спросе, continued восстановление притоков в ETF сигнализировало бы об улучшении институциональных настроений и могло бы стать важным источником поддержки со стороны спота для рынка.
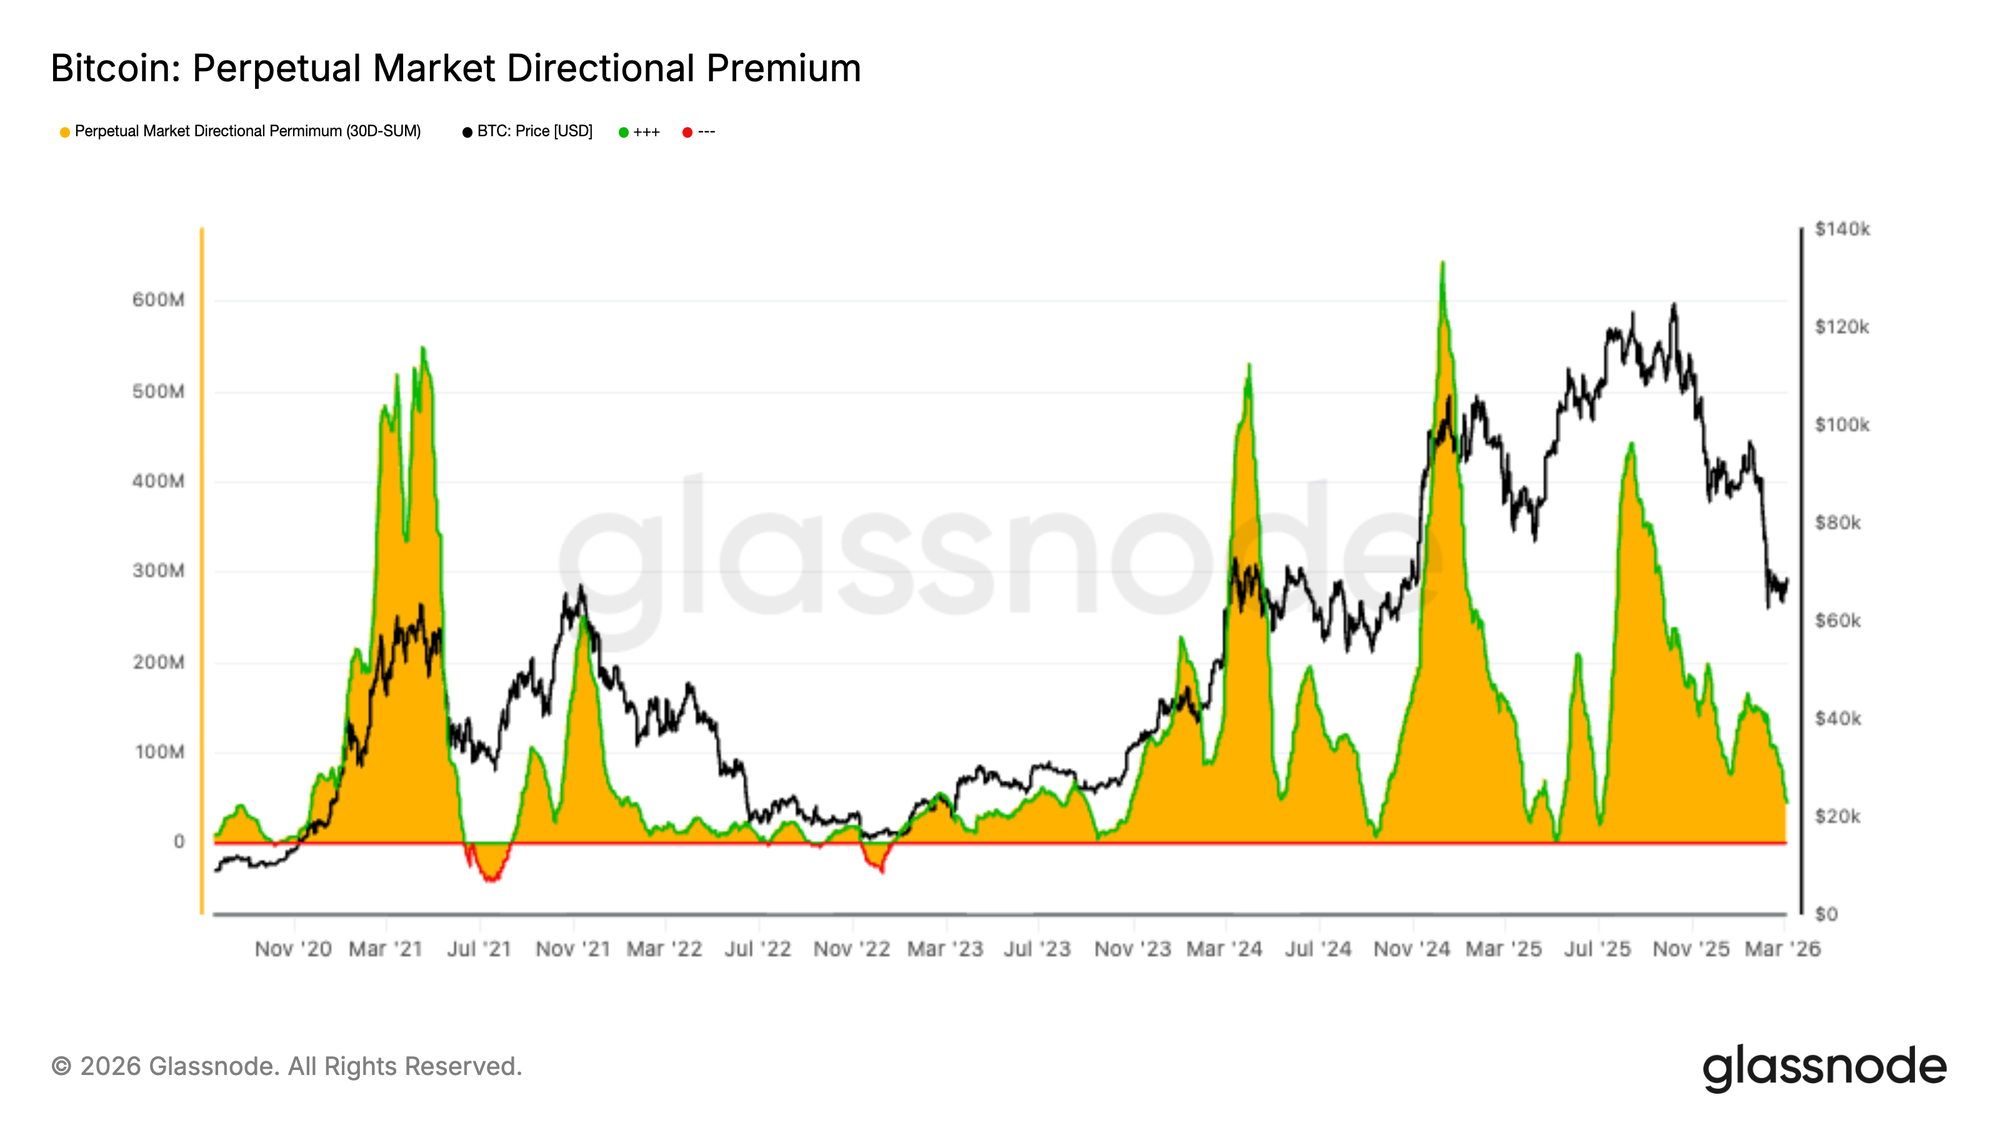
Перпетуальный премиум продолжает сжиматься
Perpetual Market Directional Premium продолжает снижаться, отражая sustained сокращение бычьих позиций на рынках perpetual фьючерсов. Метрик steadily declined в последние недели по мере того, как leverage и уверенность в направлении охлаждались на фоне общего рыночного отката.
За последние несколько дней премиум сжался further к минимумам цикла, signalING, что спекулятивное длинное exposure продолжает сокращаться. Эта dynamic suggests, что трейдеры деривативов остаются осторожными, а спрос на leveraged восходящее exposure заметно subdued.
Хотя снижение отражает ослабление бычьего импульса, оно также указывает на то, что из системы вымывается избыточный leverage. Стабилизация премиума может signal, что позиционирование в деривативах приближается к более нейтральной основе.
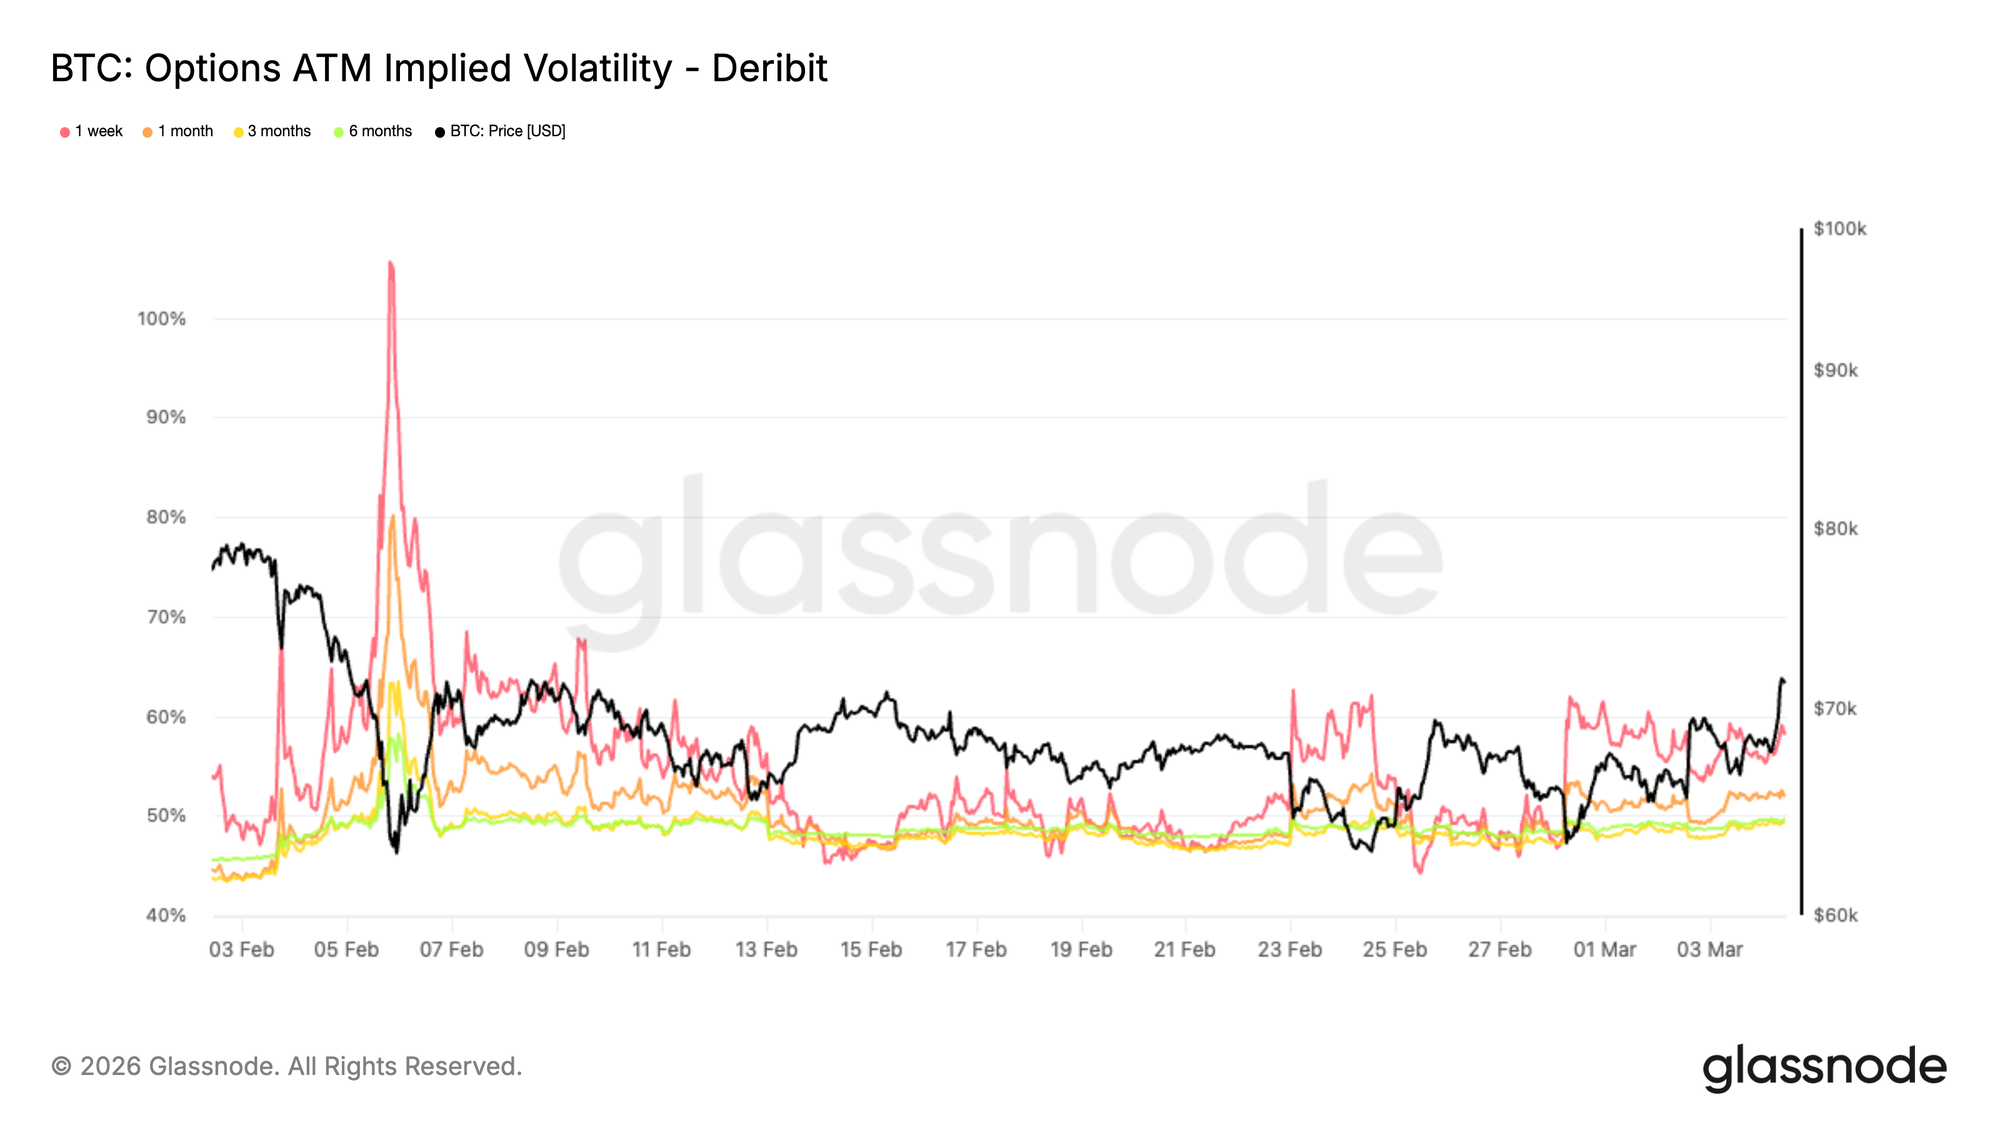
Сжатие волатильности сигнализирует о стабилизации
Подразумеваемая волатильность (Implied volatility) продолжала сжиматься после всплеска, наблюдавшегося в начале февраля. По основным срокам ATM IV значительно снизилась, что indicates, что трейдеры больше не агрессивно оценивают хвостовые риски.
Этот сдвиг отражает стабилизацию настроений после периода вынужденного deleveraging и волатильности, driven ликвидациями. По мере того как паническое ценообразование fade, рынки опционов начинают transition от стресса к более нейтральному режиму волатильности.
Более низкая подразумеваемая волатильность также меняет динамику позиционирования. Когда волатильность снижается при стабилизации цены, держатели длинных опционов сталкиваются с increasing тета-распадом, что делает уверенность в направлении более важной.
На данный момент сжатие волатильности suggests, что рынок отходит от кризисного ценообразования и переходит в фазу консолидации, где доминирующим драйвером ценового действия становится позиционирование, а не паническое хеджирование.
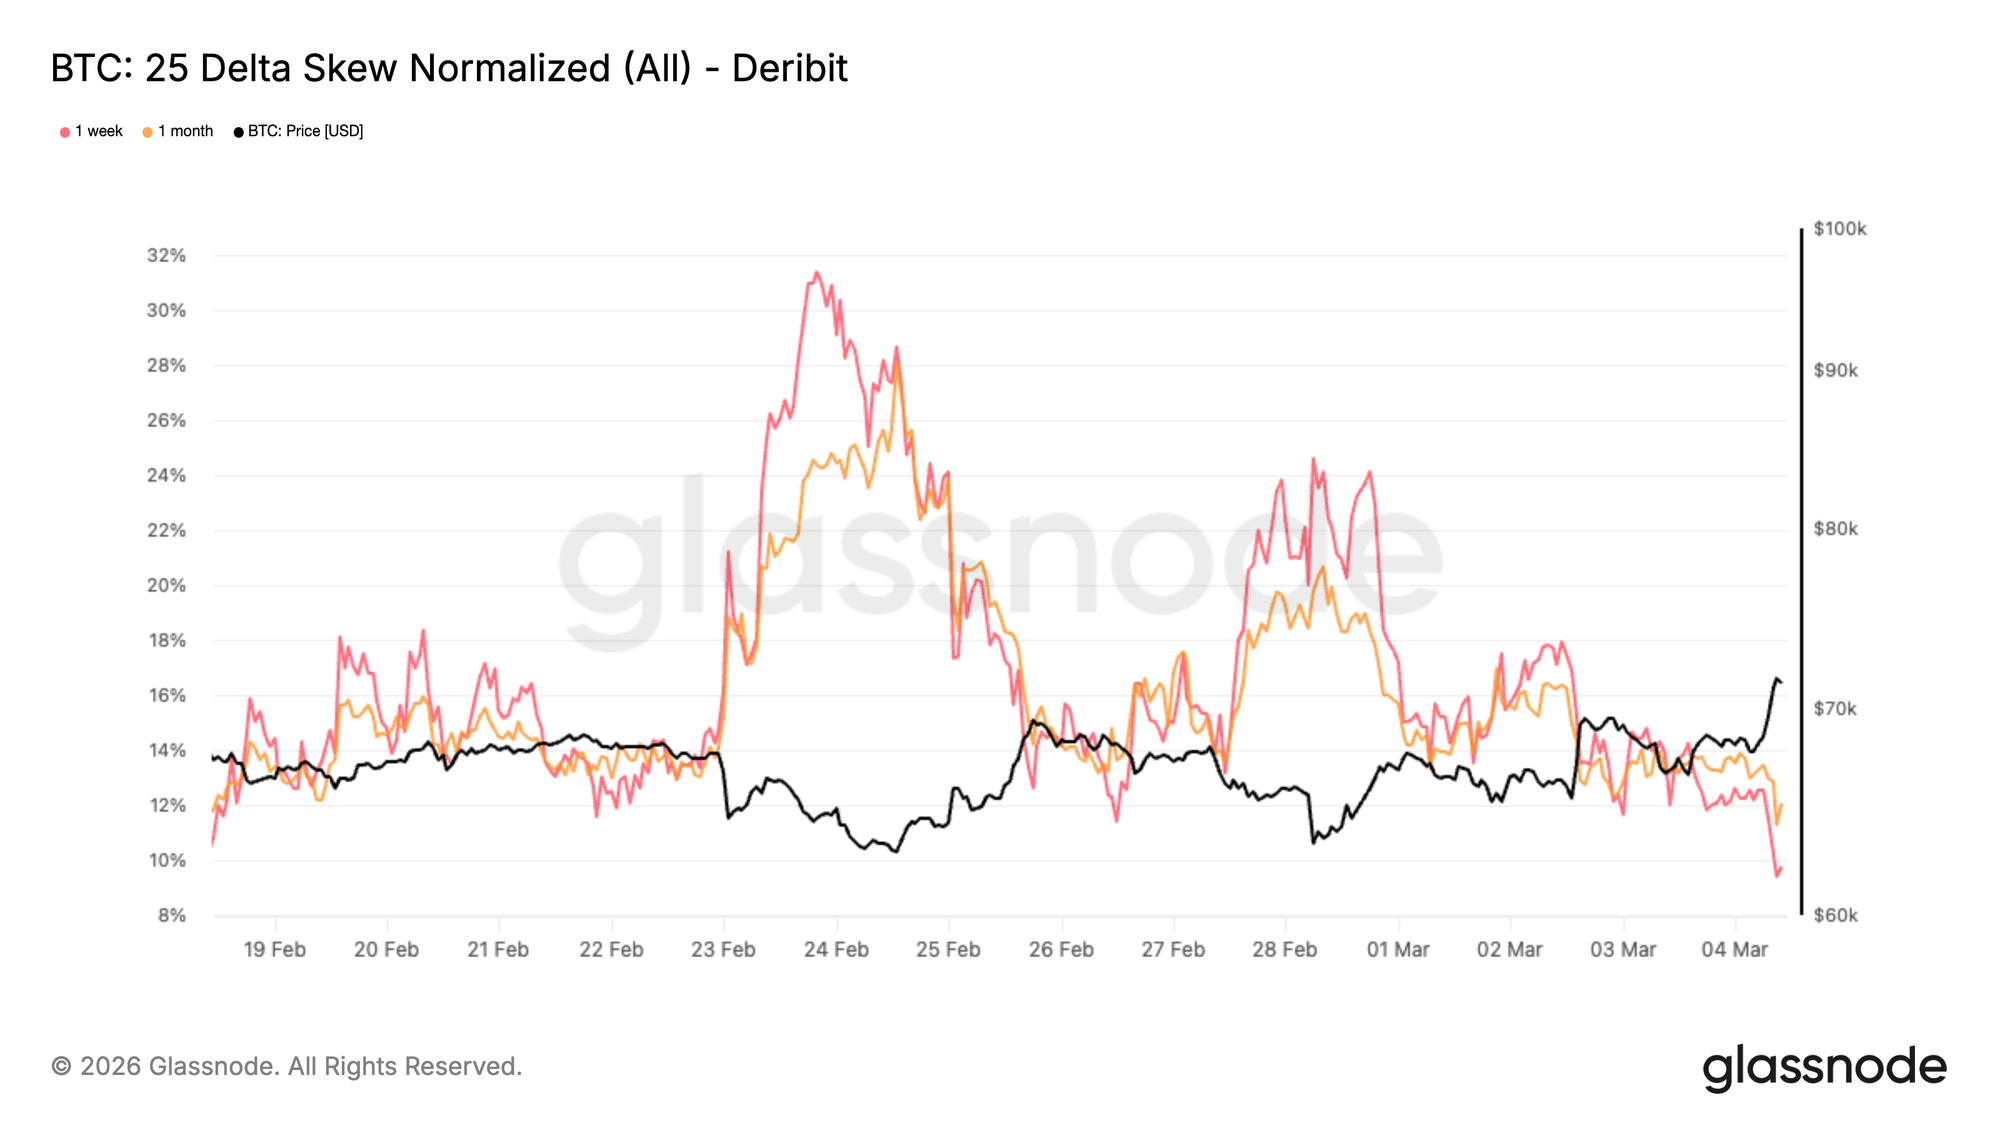
Нормализация skew отражает ослабевающий страх снижения
Skew значительно сжался с экстремальных уровней, наблюдавшимся во время распродажи в феврале. Как показывает график, за последние две недели каждое снижение цены BTC вызывало progressively более мягкую реакцию на рынке опционов. Трейдеры были far less агрессивны в ставках на защиту от снижения, постепенно опуская skew ниже. Во время пика распродажи спрос на puts резко вырос и pushed skew глубоко в put территорию, поскольку трейдеры бросились хеджироваться от дальнейшего снижения. Эта срочность clearly eased.
Вместо полной нормализации мы наблюдаем переоценку риска: skew переместился с середины 20-х в низкие 10-е, все еще отражая спрос на защиту, но на far less стрессовых уровнях. Этот сдвиг suggests, что непосредственная необходимость в downside хеджировании fade. Часть защитного позиционирования unwound, в то время как интерес к upside exposure slowly reappearing.
Исторически такое сжатие skew tends происходить, когда рынки выходят из стрессовых фаз и начинают transition в более сбалансированные среды позиционирования.
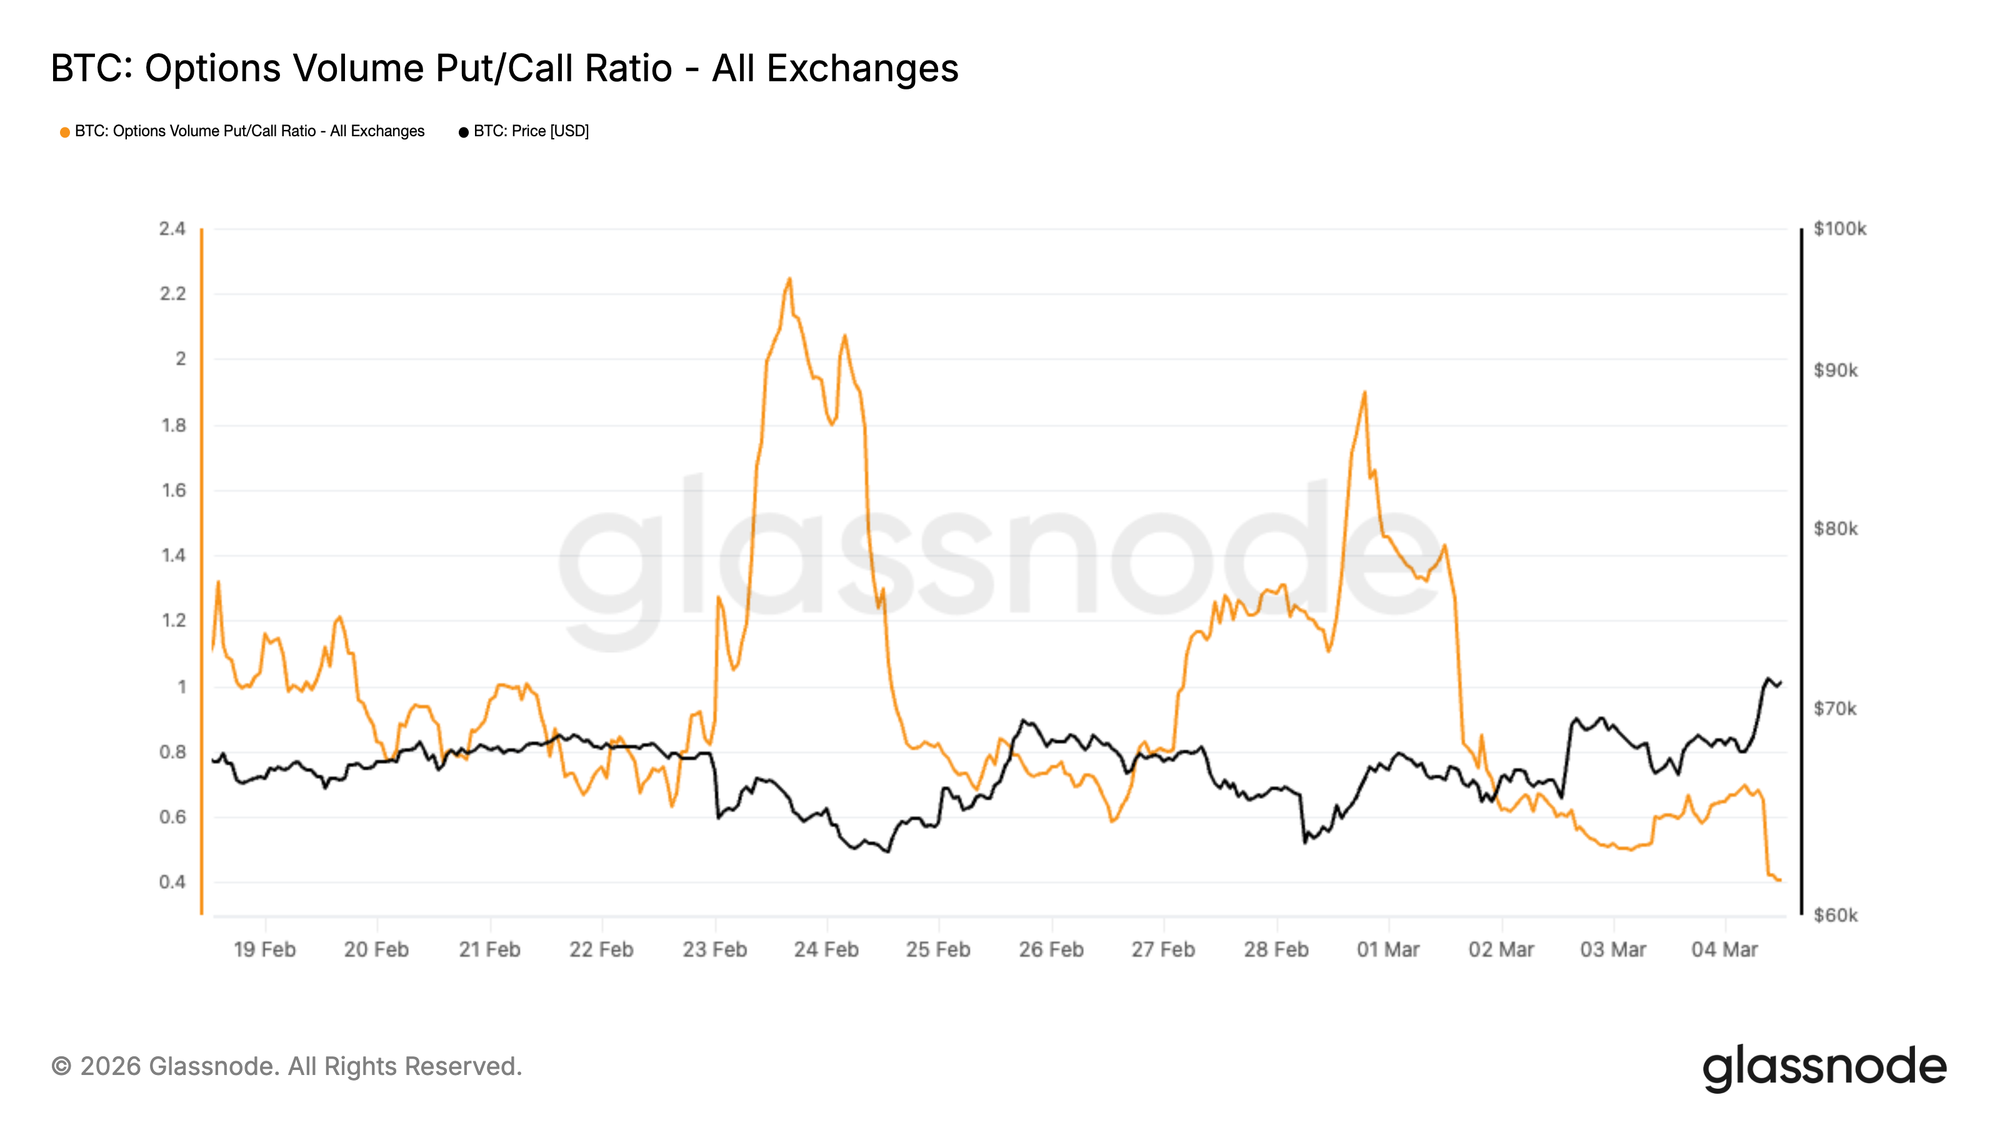
Поток опционов разворачивается в сторону восходящих коллов
Коэффициент объема пут/колл (Put/Call volume ratio) измеряет относительную торговую активность между путами и коллами. Когда коэффициент снижается, это indicates, что активность коллов увеличивается relative to путам.
По мере сжатия подразумеваемой волатильности держатели путов сталкиваются с increasing тета-распадом и mark-to-market давлением. С ослаблением downside импульса эти позиции становятся more costly для удержания, prompting трейдеров выкупать свои хеджи. Эта dynamic может создавать incremental спрос на споте по мере unwinding защитных позиций.
Эта среда incentivized трейдеров позиционироваться под тактический восходящий ход, сдвиг, который visible в коэффициенте объема пут/колл. С 28 февраля коэффициент переместился с 1.89 до 0.4, что marks значительный разворот в потоках опционов и highlights растущую готовность рынка позиционироваться под рост.
Этот сдвиг также reflected в increasing интересе вокруг страйка $75 000.
Комбинация снижающейся волатильности и растущей активности коллов suggests, что рынок gradually transition от защитного хеджирования к more opportunistic восходящему позиционированию.
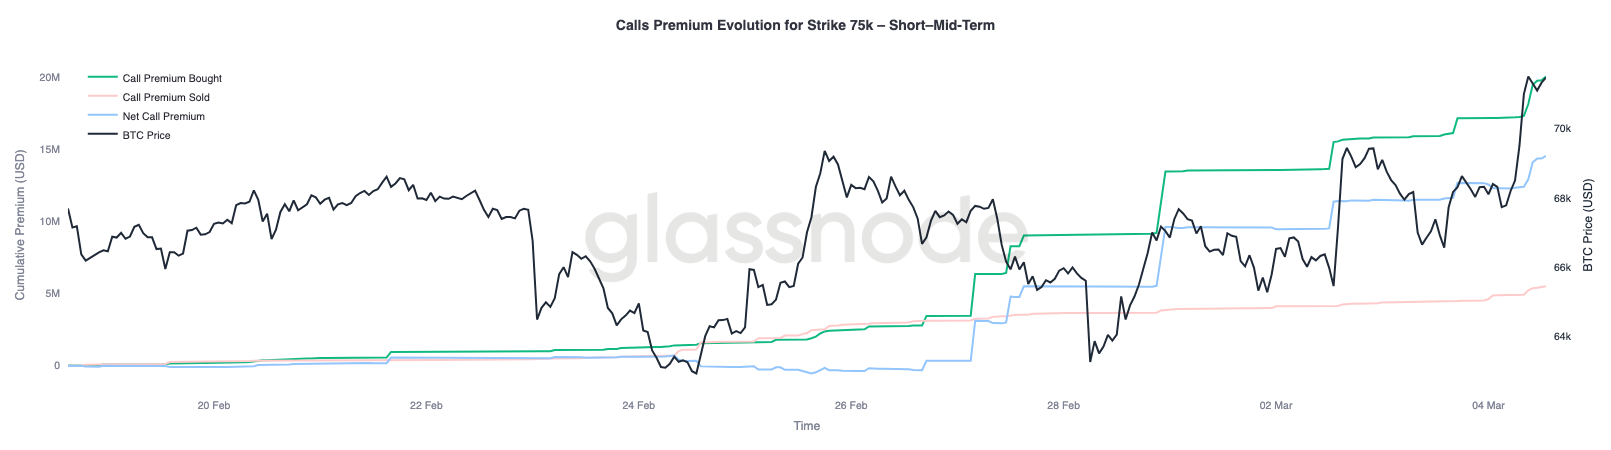
$75K emerges как ключевой gamma магнит
Разворот в сторону активности коллов также visible в растущем интересе вокруг страйка $75 000, который стал наиболее значительным уровнем negative gamma для дилеров.
Страйк $75 000 в настоящее время hosts существенную концентрацию negative gamma, оцениваемую примерно в $2.3 млрд по всем срокам экспирации, причем approximately $1.8 млрд сконцентрировано в экспирации 27 марта.
Среды negative gamma могут усиливать движения цены, поскольку хеджирующие потоки дилеров усиливают преобладающий тренд. Когда цена приближается к этим зонам, хеджирующая активность может притягивать рынок к страйку, создавая магнитный эффект. За последнюю неделю этот магнит effectively shifted из области $60K–$65K вверх к страйку $75K.
На данный момент $75K выделяется как ключевой уровень, где позиционирование и ликвидность могли бы сойтись в ближайших сессиях.
Глядя на динамику премии для коллов $75K по следующим трем ежемесячным экспирациям, было торговано roughly $14.5 млн net премии коллов. Это представляет разницу между купленной и проданной премией.
Примечательно, что nearly две трети этой net премии было accumulated за последнюю неделю, помогая подпитывать текущее восстановление.
Заключение
Bitcoin остается заблокированным в ненадежной консолидации ниже порога в $70 000, при этом несколько индикаторов suggest, что покупательский импульс существенно ослаб. Реализованная прибыль резко сократилась, highlighting снизившуюся готовность участников рынка совершать сделки по завышенным ценам, в то время как снижение Percent Supply in Profit помещает текущий режим в исторический контекст, often ассоциируемый с ранними стадиями медвежьих рыночных условий. В то же время себестоимость краткосрочных держателей near $70k emerges как ключевой поведенческий потолок, likely выступающий зоной дистрибуции, если цена попытается восстановиться в near-term.
Под поверхностью, however, начинают появляться некоторые признаки стабилизации. Спотовое давление продавцов moderating на маргинальном уровне, оттоки ETF ослабевают с возвращением ранних притоков, а leverage деривативов продолжает вымываться из системы. На рынках опционов волатильность и skew нормализуются по мере того, как паническое хеджирование fade, а позиционирование разворачивается в сторону восходящего exposure. Со страйком $75k, emerging как крупный gamma магнит, рынок, по-видимому, transition от стрессовых продаж к more сбалансированному режиму позиционирования. Перерастет ли это в устойчивое восстановление, в конечном итоге будет зависеть от возврата более сильного спотового спроса для поглощения нависающего предложения.
Отказ от ответственности: Этот отчет не предоставляет каких-либо инвестиционных рекомендаций. Все данные предоставляются исключительно в информационных и образовательных целях. Ни одно инвестиционное решение не должно основываться на информации, предоставленной здесь, и вы solely несете ответственность за свои собственные инвестиционные решения.
Балансы бирж, представленные здесь, получены из комплексной базы данных Glassnode меток адресов, которые собираются как через официально опубликованную информацию бирж, так и через проприетарные алгоритмы кластеризации. Хотя мы стремимся обеспечить максимальную точность в представлении балансов бирж, важно отметить, что эти цифры могут не всегда охватывать всю полноту резервов биржи, particularly когда биржи воздерживаются от раскрытия своих официальных адресов. Мы призываем пользователей проявлять осторожность и осмотрительность при использовании этих метрик. Glassnode не несет ответственности за любые несоответствия или потенциальные неточности.