Автор: CryptoSlate
Перевод: Deep Tide TechFlow
Оригинальное название: Биткоин вернулся к 70 000: отскок или настоящая ловушка?
Введение от Deep Tide:
После жестокого отскока с 60 000 до 70 000 долларов за 24 часа биткоин, казалось бы, отыграл свои потери, но базовая логика показывает, что это произошло не из-за уверенных спотовых покупок, а из-за вынужденного перераспределения позиций и сжатия коротких позиций, вызванного восстановлением макрорынка. В этой статье подробно анализируются причины этого «ужасного потрясения» в начале февраля 2026 года: от ожиданий сжатия ликвидности после назначения Дональдом Трампом Кевина Уорша до давления на майнеров, чья прибыль достигла исторического минимума. Несмотря на то, что цена вернулась выше 70 000 долларов, трейдеры опционов делают крупные ставки на возможное повторное падение до 50 000–60 000 долларов к концу февраля, что раскрывает все еще хрупкие настроения рынка и сложную финансовую игру под внешностью «жесткого отскока».
Биткоин взлетел с 60 000 до более чем 70 000 долларов менее чем за 24 часа, отыграв болезненное падение на 14%, которое проверило все теории о «покупке на дне» на рынке.
Скорость этого разворота — однодневный отскок на 12%, восстановление на 17% от дневного минимума — была настолько резкой, что казалось, будто это просто улеглась пыль после клиринга. Однако механизм, стоящий за отскоком, рассказывает другую историю: это была скорее комбинация стабилизации跨активов и вынужденного ребалансирования позиций, а не массовый спрос на споте, движимый убежденностью.
В то же время рынок деривативов по-прежнему переполнен защитными медвежьими позициями, ценообразование которых показывает, что 70 000 долларов могут быть лишь промежуточной станцией, а не настоящим дном.
Волна ликвидаций столкнулась с макродавлением
5 февраля рынок открылся около 73 100 долларов, ненадолго пошел вверх, а затем рухнул, закрывшись на уровне 62 600 долларов. По данным CoinGlass, однодневное падение привело к ликвидации杠杆ных позиций на биткоин на сумму около 1 миллиарда долларов.
Эта цифра сама по себе говорит о цепной реакции вынужденных продаж, но общая картина была еще хуже.
Данные CoinGlass показывают, что открытый интерес (Open Interest) по фьючерсам на биткоин на прошлой неделе упал с примерно 61 миллиарда долларов до 49 миллиардов долларов, что означает, что рынок уже начал снижать leverage до того, как пришел последний удар.
Триггером стали не внутренние события криптоиндустрии. Сообщения в СМИ охарактеризовали эти продажи как ухудшение аппетита к риску, в основном вызванное распродажами акций технологических компаний и волатильностью драгоценных металлов — серебро упало на 18% до примерно 72,21 доллара, что потянуло вниз все связанные рисковые активы.
Исследование Deribit подтвердило этот эффект перелива, указав, что настроения на рынке деривативов сменились на крайне медвежьи: funding rate стал отрицательным, сроковая структура подразумеваемой волатильности inverted, а skew 25-delta risk-reversal упал примерно до -13%.
Это классическое состояние «крайнего страха», при котором расстановка позиций усиливает двусторонние ценовые колебания.
Политический нарратив подлил масла в огонь. Как сообщил Reuters, реакция рынка на выбор избранным президентом Дональдом Трампом Кевина Уорша на пост главы ФРС была резкой, трейдеры интерпретировали это как сигнал к будущему сокращению баланса и ужесточению ликвидности.
Тем временем майнеры столкнулись с огромным давлением на прибыль. По данным TheMinerMag, «цена хеширования» (Hash price) упала ниже 32 долларов за PH/s, а сложность сети, как ожидается, снизится примерно на 13,37% через два дня. Но этот механизм облегчения еще не успел вступить в силу до того, как цена пробила уровни поддержки.
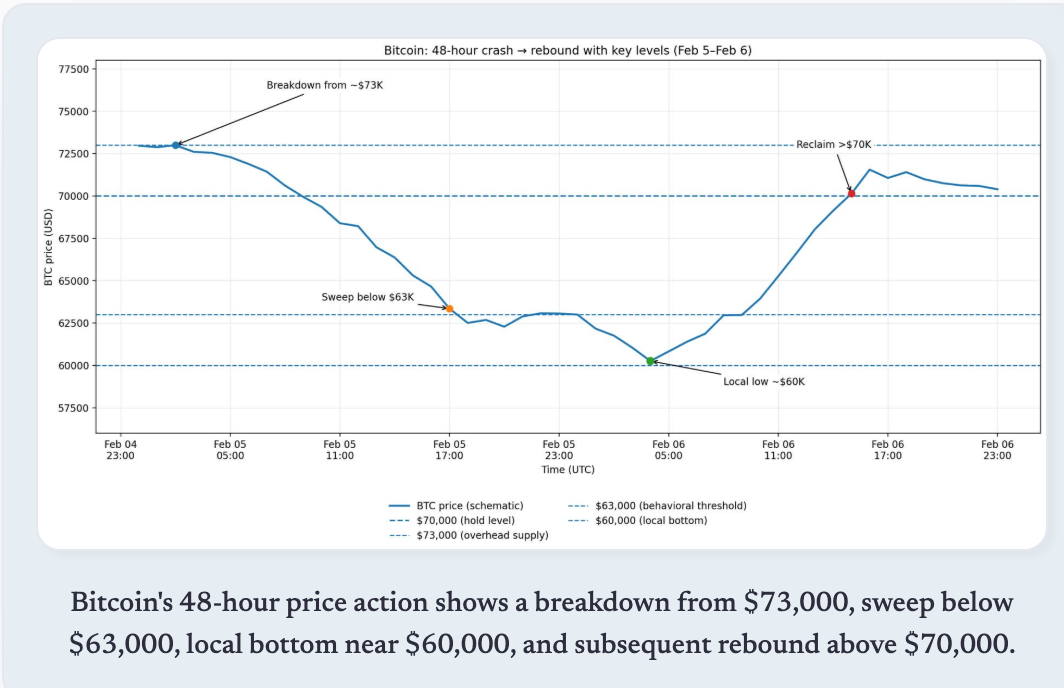
48-часовое движение цены биткоина, показывающее обвал с 73 000 долларов, пробой ниже 63 000 долларов, локальное формирование дна около 60 000 долларов и последующий отскок выше 70 000 долларов.
Макроразворот и механизм сжатия
6 февраля открытие произошло на уровне закрытия предыдущего дня, затем последовало падение до дневного минимума near 60 000 долларов, после чего цена резко пошла вверх до максимума на уровне 71 422 доллара. После трех неудачных попыток пробить этот уровень цена отступила ниже 70 000 долларов.
Катализатор исходил не изнутри криптоиндустрии, а из-за резкого разворота в движении跨активов. Уолл-стрит показала强劲ные результаты: индекс S&P 500 вырос на 1,97%, Nasdaq — на 2,18%, Dow Jones — на 2,47%, а индекс фондового рынка полупроводниковой промышленности Филадельфии (SOX) взлетел на 5,7%.
Цены на металлы резко восстановились: золото выросло на 3,9%, серебро — на 8,6%, в то время как индекс доллара США (DXY) упал на 0,2%, сигнализируя о смягчении финансовых условий.
Биткоин механически следовал этому изменению. Корреляция была очевидной: когда акции технологических компаний стабилизировались, а металлы отскакивали, биткоин подтягивался через общее exposure к риску.
Однако жестокость этого отскока также отражала позиционирование на рынке деривативов. Skew около -13%, отрицательный funding rate и inverted структура волатильности создали условия, при которых любое макроположительное событие могло спровоцировать покрытие коротких позиций (Short-covering) и принудительный ребаланс.
По своей сути, этот отскок был driven событием ликвидности и усилен закрытием crowded коротких позиций.
Тем не менее, форвардные сигналы по-прежнему склоняются к медвежьим. Данные Derive показывают, что в опционах с истечением 27 февраля наблюдается значительная концентрация открытого интереса по пут-опционам со страйками от 60 000 до 50 000 долларов.
Шон Доусон из Derive сообщил Reuters, что спрос на защиту от падения был «экстремальным». Это не анализ задним числом, а четкое указание на то, что трейдеры даже после отскока продолжают хеджировать риск следующего падения.
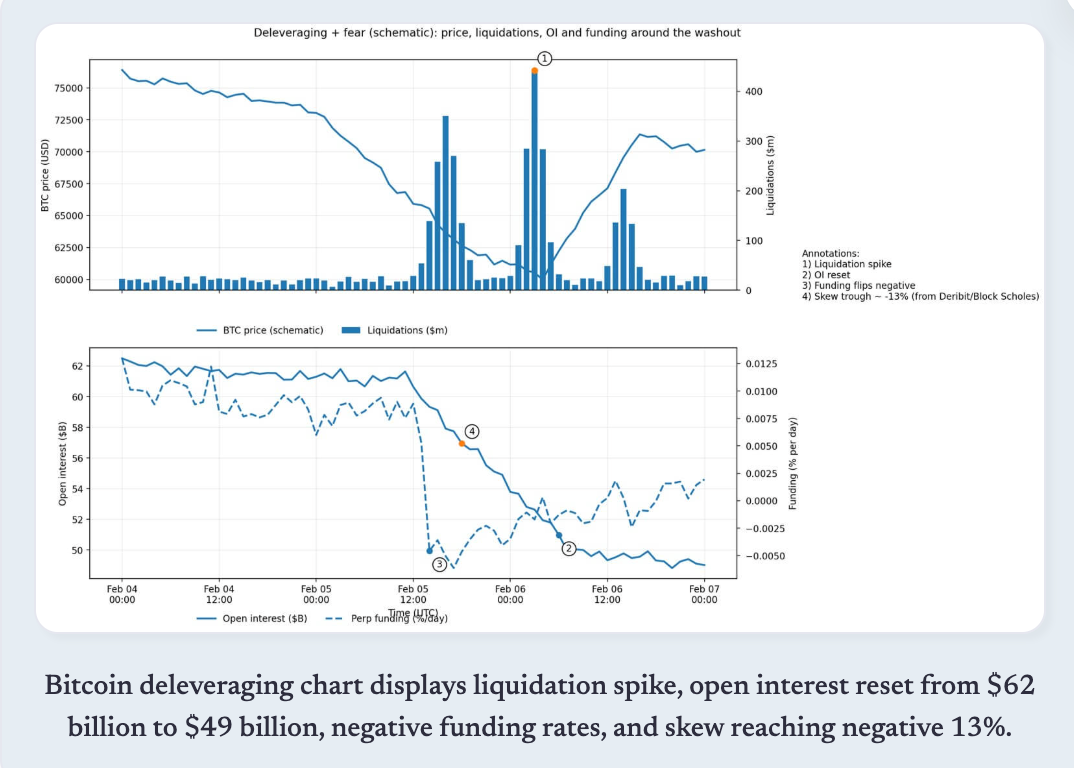
График снижения leverage биткоина, показывающий всплеск ликвидаций, сброс открытого интереса с 62 миллиардов долларов до 49 миллиардов долларов, отрицательный funding rate и skew, достигший -13%.
Удержится ли цена на уровне 70 000 долларов? Аналитическая рамка
Логика удержания 70 000 долларов основана на трех условиях.
Во-первых, макровосстановление должно продолжаться, акции технологических компаний — стабилизироваться, а доходность казначейских облигаций и доллар — не возобновлять ужесточение. Этот отскок был четко跨активным, и если акции США снова пойдут вниз, биткоин не сможет остаться в стороне.
Во-вторых, leverage должен продолжать охлаждаться, и не должно возникать новых вынужденных продаж. Открытый интерес уже значительно снизился, что уменьшает риск «вакуумного падения».
В-третьих, давление на майнеров должно существенно ослабнуть, когда корректировка сложности вступит в силу. Если цена сможет удерживаться в течение окна корректировки, ожидаемое снижение сложности на 13,37% уменьшит маржинальное давление продаж и стабилизирует хешрейт.
Аргументы в пользу очередной встряски также основаны на трех причинах:
Во-первых, позиционирование в опционах остается медвежьим. Крупнейшие путы на конец февраля сконцентрированы на уровнях 60 000–50 000 долларов — это форвардный сигнал, встроенный в implied probability рынка, а не запаздывающие настроения.
Во-вторых, сигналы деривативов все еще хрупки. Экстремальный skew, недавно频繁но появляющийся отрицательный funding rate и inverted структура волатильности больше соответствуют характеристикам «восстановительного ралли» (Relief rally) в системе страха, а не разворота тренда.
В-третьих, данные о потоках ETF показывают continued отток. По состоянию на 5 февраля месячный чистый отток из биткоин-ETF достиг 690 миллионов долларов. Хотя данные за 6 февраля еще не опубликованы, существующая модель показывает, что институциональные allocators еще не перешли от «снижения рисков» (De-risking) к «повторному входу» (Re-engagement).
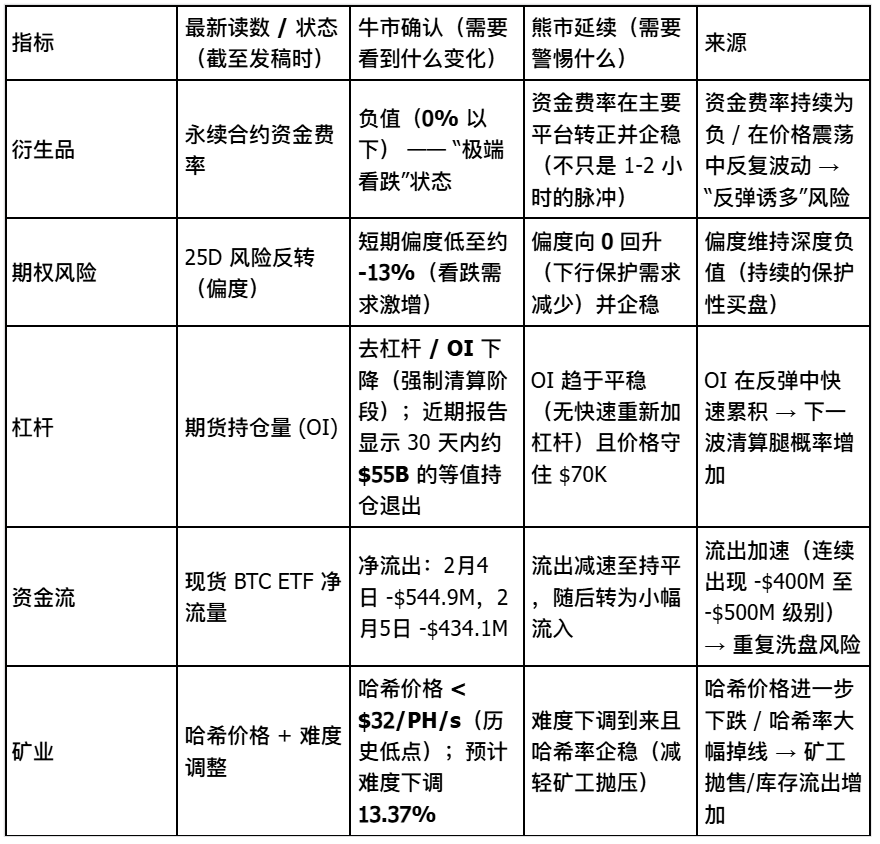
Сигнальная панель
Реальное значение уровня 70 000 долларов
Сам по себе этот ценовой уровень не обладает магией. Его важность заключается в том, что он находится выше кластера链上 поглощения, определенного Glassnode, в диапазоне от 66 900 до 70 600 долларов.
Удержание 70 000 долларов означает, что этот кластер поглотил достаточно предложения для временной стабилизации цены. Однако закрепление требует не только технической поддержки, но и возврата спотового спроса, закрытия хеджевых позиций в деривативах и стабилизации институциональных потоков.
Отскок с 60 000 долларов был реальным, но его состав имеет crucialное значение. Если макроусловия изменятся,跨активная стабильность также развернется.
Закрытие вынужденных позиций создало механический отскок, который не обязательно превращается в устойчивый тренд. Трейдеры опционов по-прежнему закладывают в цены значительную вероятность падения до 50 000–60 000 долларов в течение следующих трех недель.
Биткоин отвоевал 70 000 долларов, но в настоящее время консолидируется ниже этого уровня. Это предвещает паузу перед следующим испытанием, исход которого будет зависеть от последовательного выполнения трех условий: сохранения макроровного аппетита к риску, замедления или разворота оттока из ETF и нормализации настроений на рынке деривативов.
Рынок дал жестокий отскок, но форвардная кривая и данные о потоках показывают, что трейдеры еще не начали ставить на его долговечность. 70 000 долларов — это не конец игры, это лишь базовый уровень, который определит победителя в следующей фазе дискуссии.
Twitter:https://twitter.com/BitpushNewsCN
Группа общения比推 в TG:https://t.me/BitPushCommunity
Подписка比推 в TG: https://t.me/bitpush