Рыночная структура Ethereum продолжала смещаться в сторону доминирования деривативов на момент публикации.
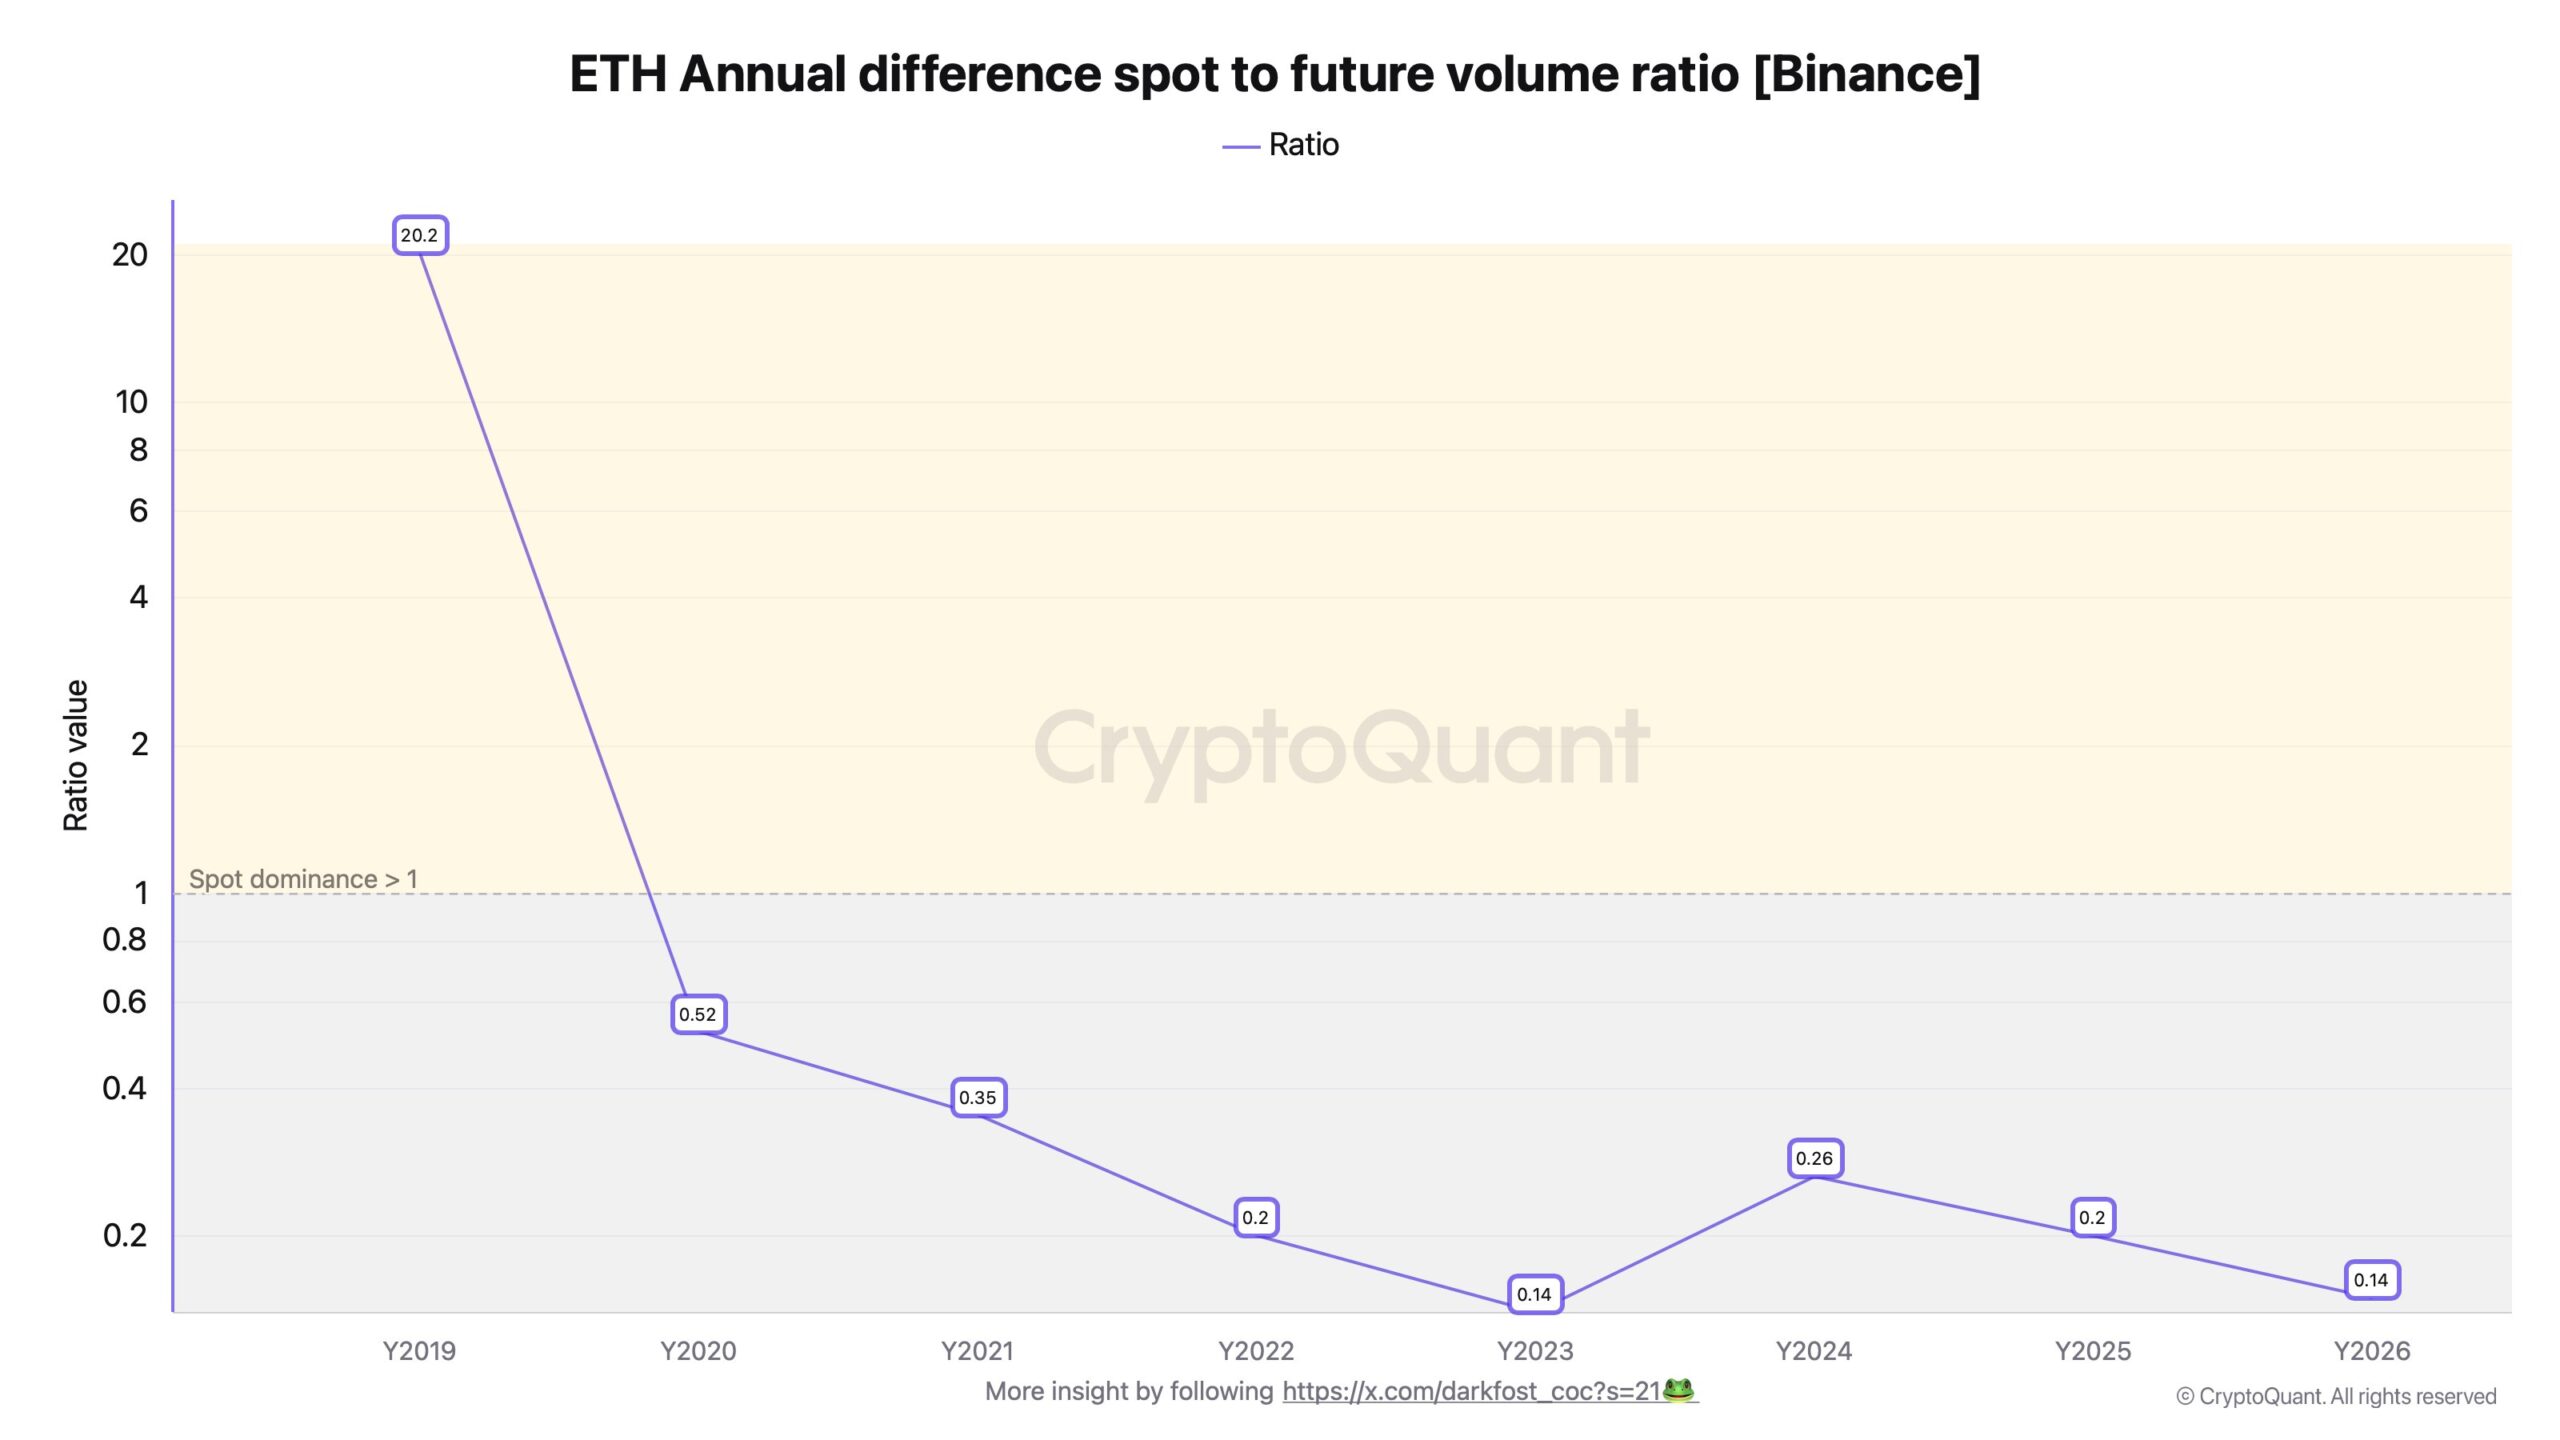
Соотношение объемов спот- и фьючерсных торгов на Binance сократилось с 20,2 в 2019 году до 0,14 в 2026 году. Это резкое снижение показало, что фьючерсные рынки постепенно поглощают ценовое обнаружение.
По мере расширения деривативов объем фьючерсов превысил спотовую активность более чем в шесть раз.

Тем временем позиционирование на рынках с левериджем резко скорректировалось.
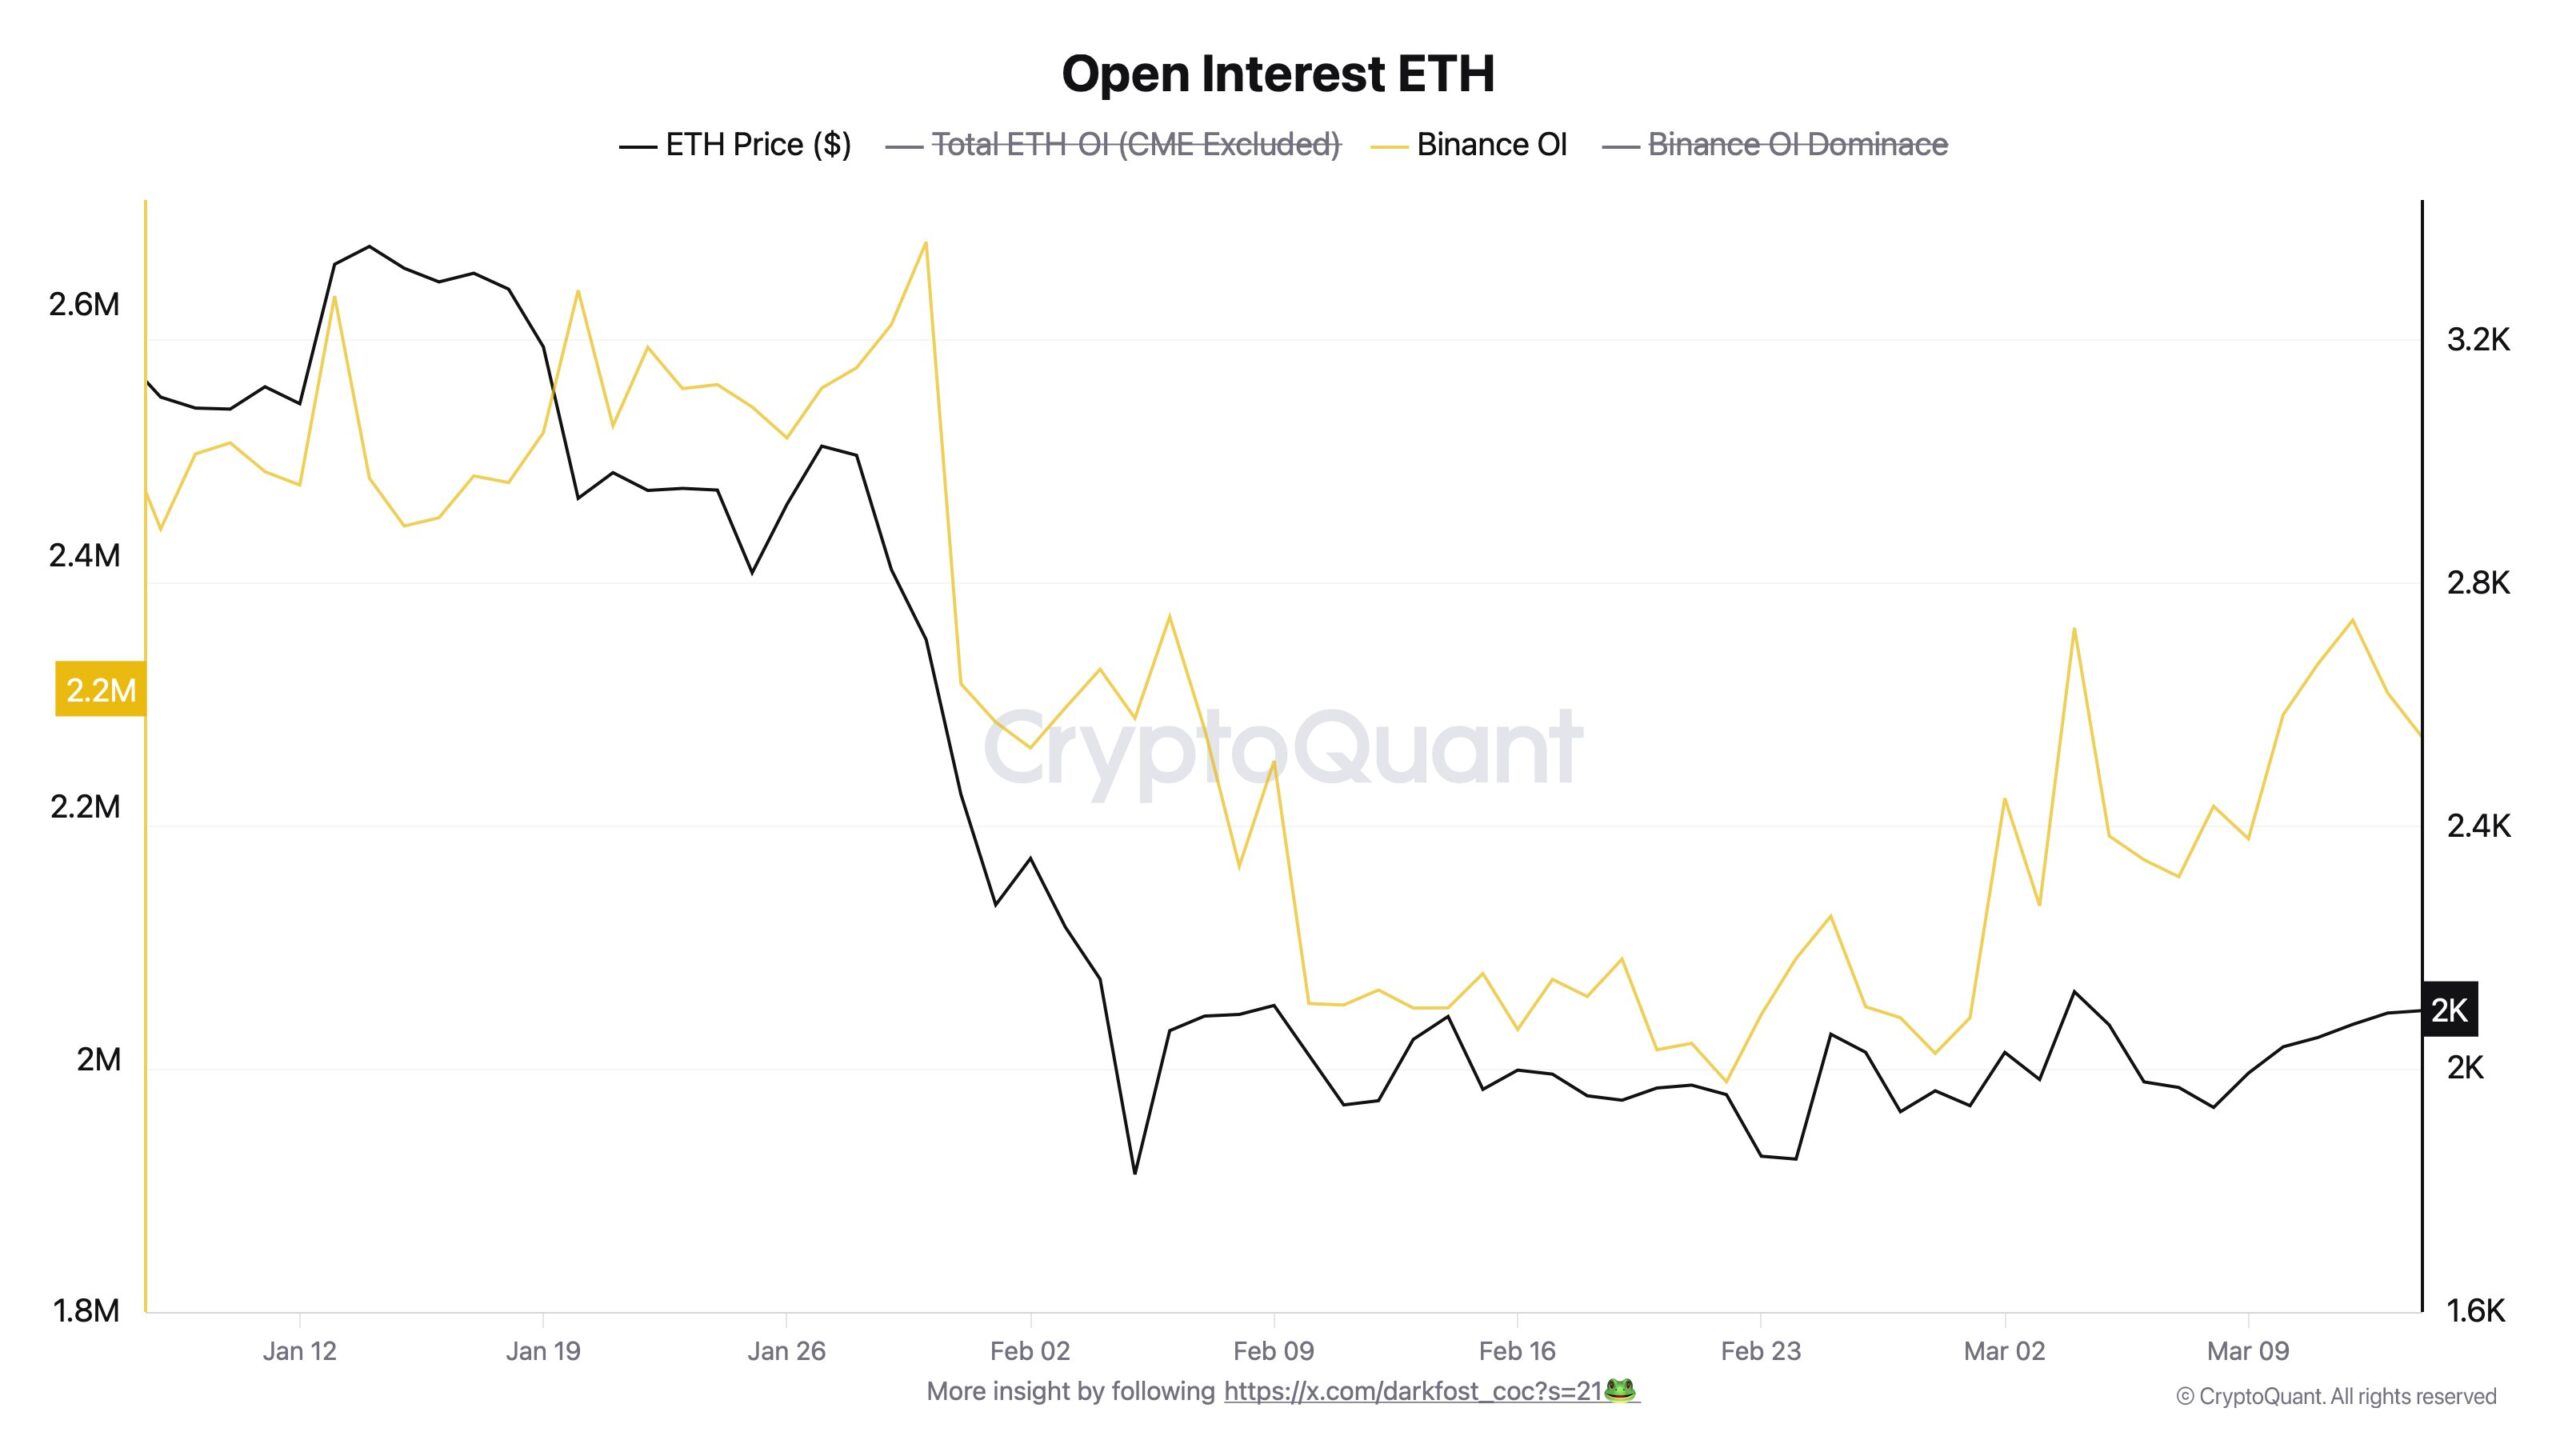
С января открытый интерес на Binance снизился примерно на 400 000 ETH, что эквивалентно уходу фьючерсного экспоушена на $4 миллиарда. Тем не менее, активность на фьючерсных рынках остается высокой, что сигнализирует о том, что трейдеры меняют позиции, а не полностью отказываются от левериджа.

Наряду с этим сдвигом усиливается макродавление.
Нефть марки Brent поднялась выше $100 на фоне роста геополитической напряженности. Более высокие затраты на энергию ужесточают условия глобальной ликвидности.
По мере сжатия ликвидности и роста доходности инвесторы сокращают экспоушен к рисковым активам. В этих условиях Ethereum [ETH] все больше реагирует на макропотоки капитала, а не исключительно на внутренний спрос в криптосфере.
Деривативы теперь определяют ценовое обнаружение Ethereum
Ценовое обнаружение Ethereum постепенно смещается в сторону рынков деривативов.
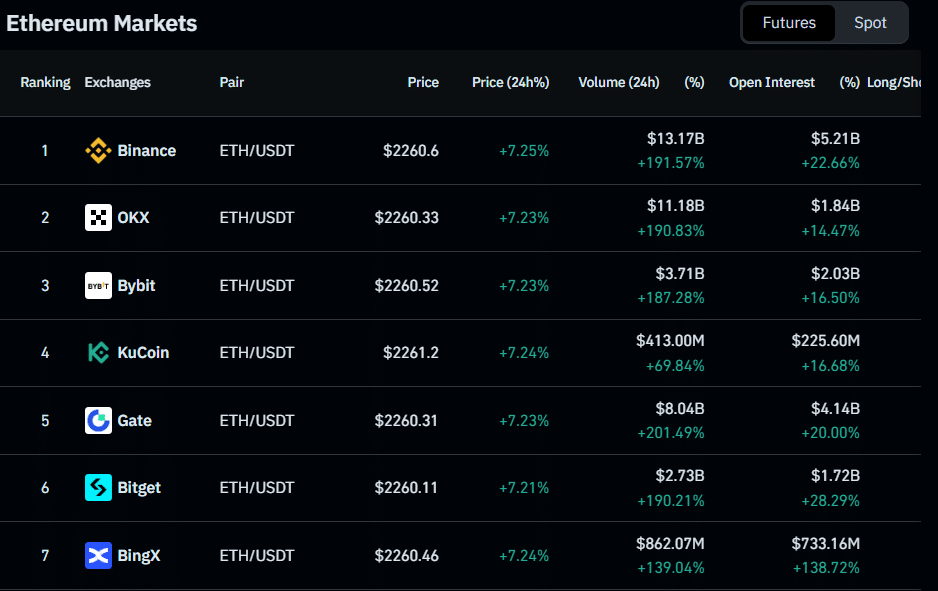
Совокупный объем фьючерсных торгов достиг более $57 миллиардов за 24 часа, что сигнализирует о том, где сейчас сосредоточена большая часть торговой активности.
Тем временем спотовые рынки остаются относительно слабыми. На Binance оборот фьючерсов составил $13,17 миллиарда, в то время как спотовый объем достиг всего $1,1 миллиарда.
Этот дисбаланс делает активность на рынке деривативов примерно в 12,5 раз больше, чем физическая торговля.

Поскольку ликвидность концентрируется в бессрочных контрактах, краткосрочное позиционирование все больше определяет ценовое движение. В рамках этой структуры экспоушен с левериджем становится хрупким.
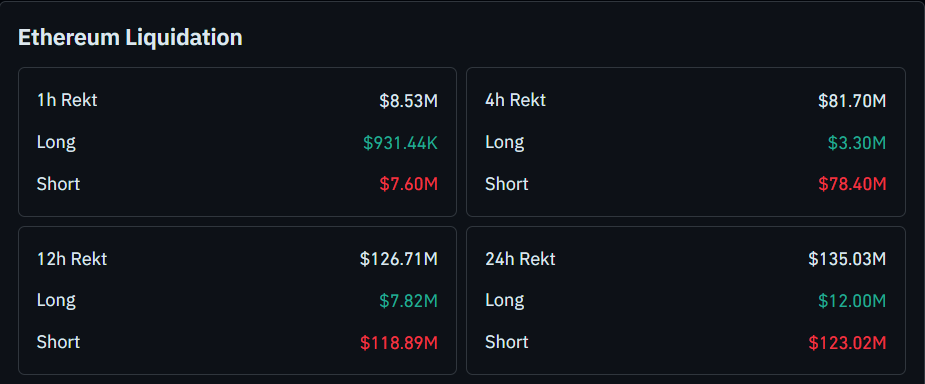
Недавние ликвидации составили в общей сложности $135,03 миллиона за 24 часа, вызвав быстрые каскады на рынках деривативов.

По мере развития этих ликвидаций волатильность часто ускоряется. Следовательно, Ethereum больше реагирует на динамику позиционирования с левериджем, чем на стабильное накопление на споте.
Ethereum становится макронидикатором риска для рынка альткойнов
Рынки нефти ужесточаются, поскольку Brent уверенно преодолевает порог в $100. Подобные всплески цен на энергию часто возрождают инфляционные опасения и оказывают давление на глобальные условия ликвидности.
Тем временем индекс доллара США стабилизируется около отметки 100,39, а доходность 10-летних казначейских облигаций держится около 4,28%. Эти изменения постепенно подталкивают инвесторов к защитному позиционированию на финансовых рынках.
По мере ужесточения ликвидности рисковые активы обычно принимают на себя удар первыми.
В этой макросреде Ethereum демонстрирует повышенную чувствительность по сравнению с большинством альткойнов. ETH обеспечивает залоговое обеспечение на сумму примерно $58,54 миллиарда в DeFi-протоколах, таких как Aave и Lido.
Эта структурная роль удерживает ETH глубоко встроенным в торговую и кредитную инфраструктуру. Поскольку институциональные дески хеджируют экспоушен через рынки ETH, геополитические потрясения и волатильность на энергетических рынках все больше проникают в ценовое поведение Ethereum.
Итоговое резюме
- Рынки деривативов Ethereum [ETH] теперь доминируют в формировании цены, поскольку объем фьючерсов более чем в шесть раз превышает спотовую активность, а ликвидации, вызванные левериджем, все больше усиливают краткосрочную волатильность.
- Ethereum становится макрочувствительным альткойном, поскольку растущие цены на нефть, ужесточение ликвидности и потоки институционального хеджирования все больше формируют рыночное поведение ETH.