Автор: Мах, Foresight News
Оригинальное название: Пять ключевых показателей определяют дно Биткоина, время покупать?
Wintermute на прошлой неделе заявила, что 85 000 долларов стали ключевой точкой для BTC, и в ближайшее время будет выбран направление, к сожалению, это направление оказалось не вверх, а резко вниз.
2 февраля BTC опустился до 75 700 долларов, ETH до 2220 долларов, множество альткоинов продолжают падать. По данным Coinglass, за последние 12 часов ликвидации составили 435 миллионов долларов, из них 324 миллиона долларов пришлось на лонги.
Индекс страха рынка составляет 15, настроения снова в состоянии крайней паники.
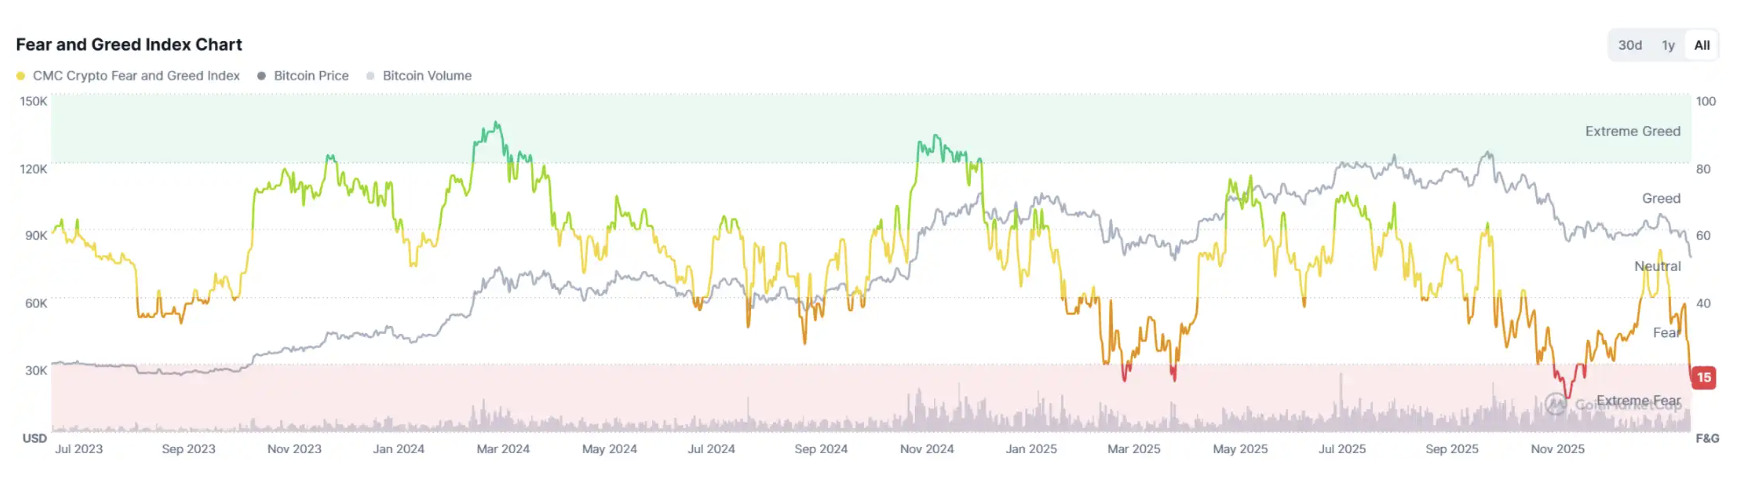
После разворота рынка в медвежий тренд, где же находится дно BTC? Пять ключевых показателей дают ответ.
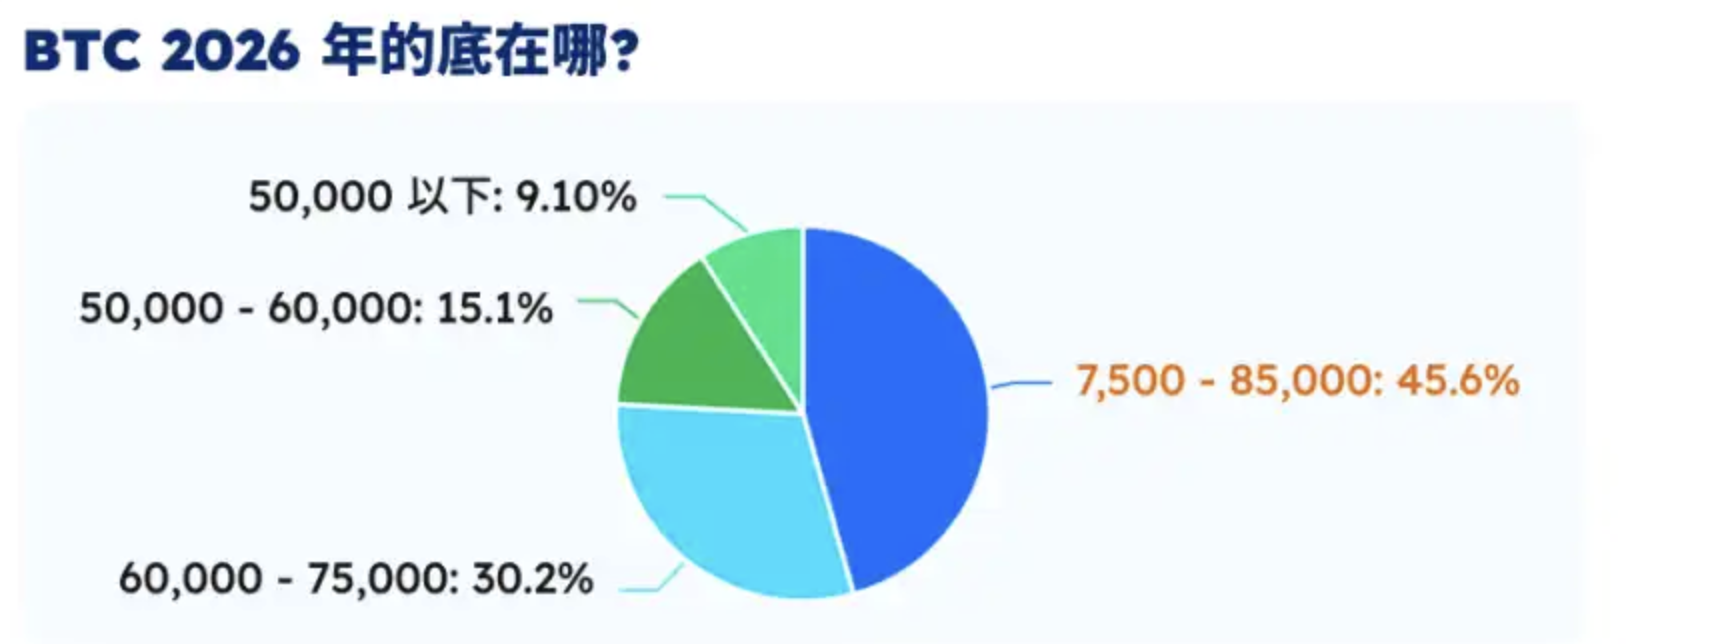
Опрос данных: треть пользователей считает, что дно BTC находится в диапазоне 60-75 тысяч долларов
30 января Foresight News провела опрос доверия инвесторов. В тот день, во время опроса, цена BTC составляла 84 000 долларов, в последующие дни она значительно упала, поэтому данные опроса носят ознакомительный характер.
Опрос (1189 участников) показал, что большинство респондентов (45,6%) считают, что минимальная цена BTC в 2026 году будет в диапазоне 75 000-85 000 долларов. Еще 30,2% респондентов считают, что дно будет в диапазоне 60 000-75 000 долларов.
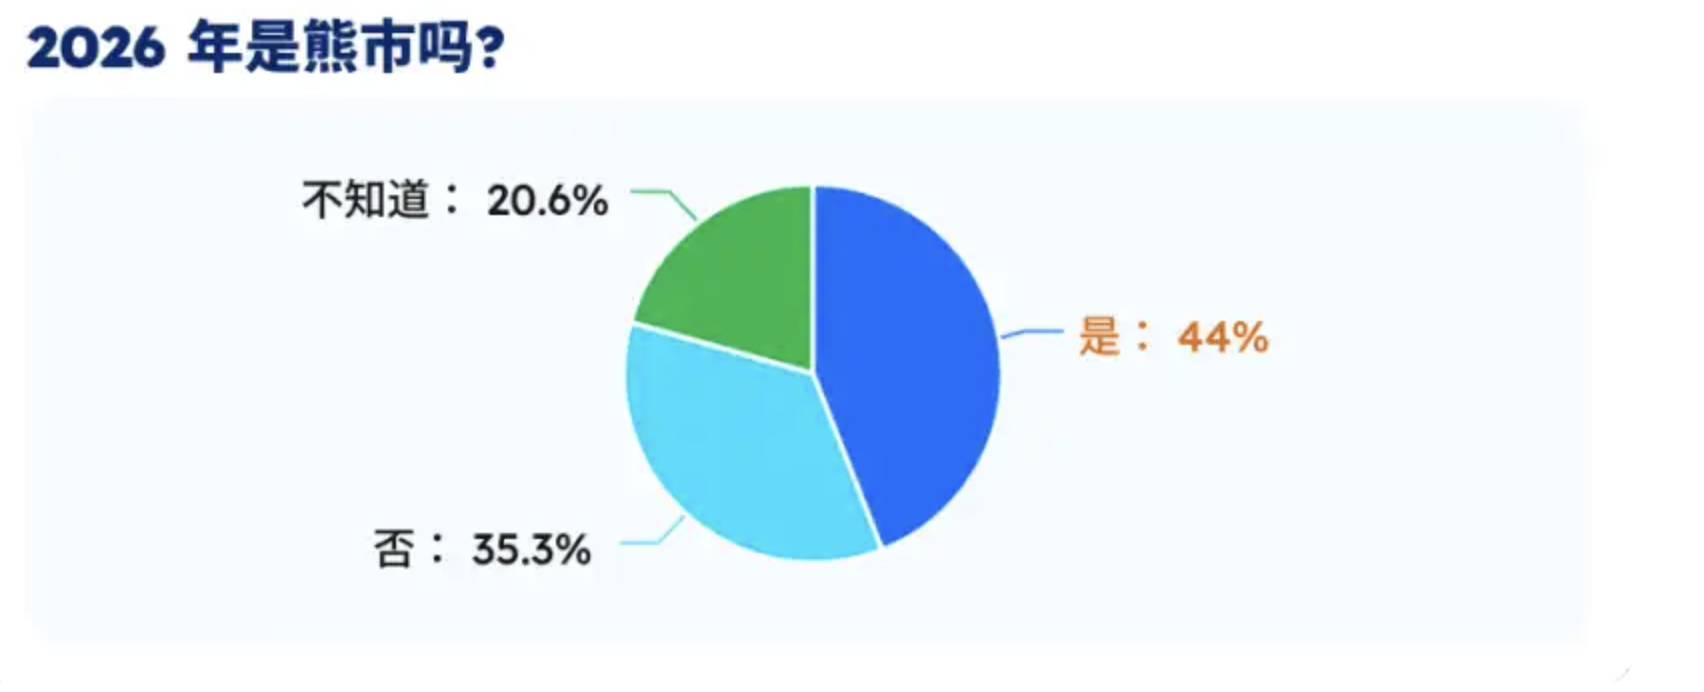
44% респондентов считают, что 2026 год будет медвежьим рынком, а 35,3% респондентов придерживаются противоположного мнения, считая, что это не так. Еще 20,6% респондентов не уверены.
Почти половина респондентов (47,2%) выбрали стратегию регулярных инвестиций (DCA) и долгосрочное хранение биткоина. Еще 25% респондентов выбрали полную продажу активов и переход на стейблкоины или выжидательную позицию. 17,5% респондентов ищут альткоины для стоимостного инвестирования.

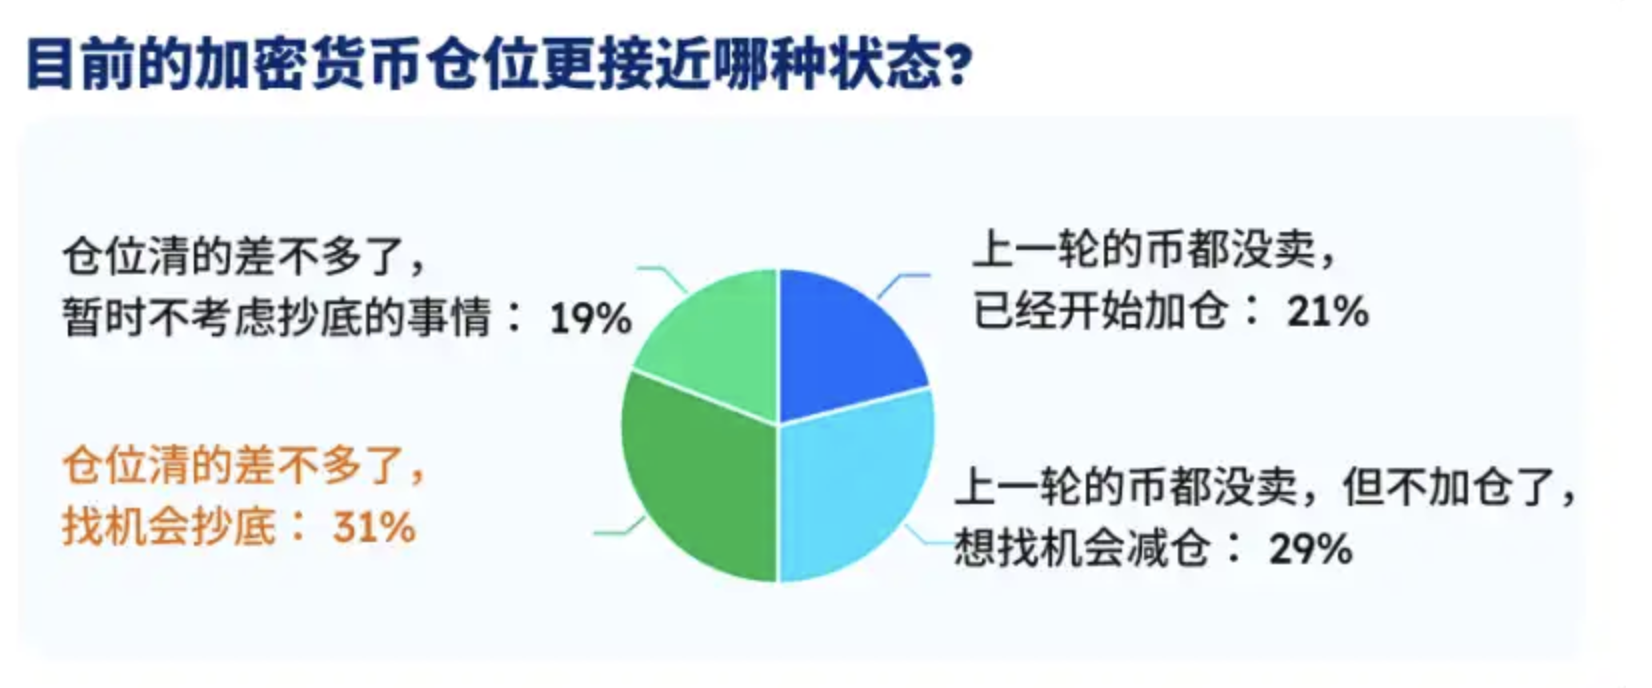
Среди опрошенных пользователей 31% заявили, что уже почти распродали свои активы, но все еще ищут возможности для покупки на дне. 29% респондентов заявили, что не продали монеты из предыдущего цикла, но временно не пополняют позиции, а ищут возможность сократить их. 21% респондентов заявили, что не продали монеты из предыдущего цикла и уже начали докупать.
Glassnode показывает среднюю стоимость BTC в сети на уровне 55,9 тысяч долларов
Биткоин упал ниже 78 000 долларов, glassnode обновил ключевое распределение цен в сети: себестоимость STH (краткосрочных держателей), отражающая среднюю цену входа новых покупателей/трейдеров за последние месяцы, составляет 95,4 тысячи долларов.
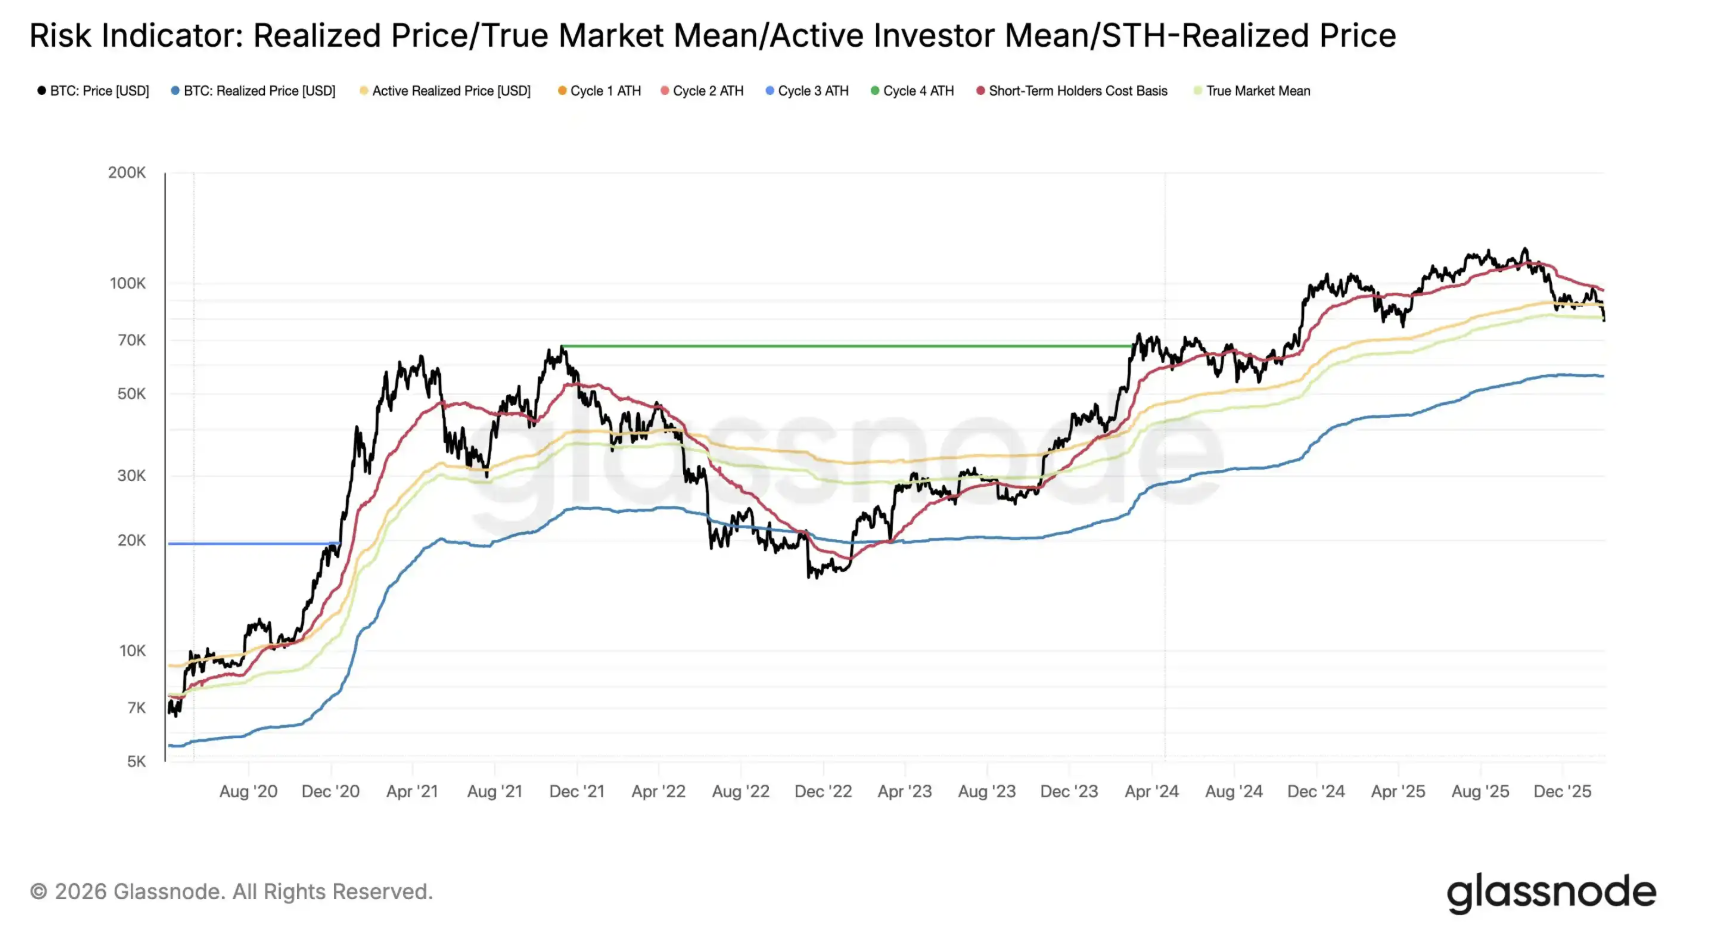
Средний объем инвестиций активных инвесторов, текущая средняя себестоимость активных трейдеров «на поле» составляет 87,3 тысячи долларов; Реальная рыночная средняя, focusing на себестоимость реальных трейдеров на вторичном рынке, составляет 80,5 тысячи долларов. Цена реализации, представляющая среднюю себестоимость всех монет в сети, составляет 55,9 тысячи долларов.
То есть, если цена BTC ниже 80,5 тысячи долларов, вы покупаете дешевле, чем недавние покупатели. Если BTC упадет ниже 55,9 тысячи долларов, это означает, что вы покупаете дешевле средней себестоимости всей сети.
В медвежьем цикле 2022 года цена BTC一度 опускалась ниже средней себестоимости всей сети. В этом цикле на BTC влияют такие факторы, как макроликвидность и спот-ETF, поэтому неизвестно, упадет ли он ниже 55,9 тысячи долларов.
Индикатор ahr999 показывает сигнал накопления
Индикатор ahr999 был разработан несколько лет назад пользователем Weibo ahr999 для оценки краткосрочной доходности BTC и отклонения цены. Формула индикатора: (текущая цена / стоимость DCA за 200 дней) × (текущая цена / оценка экспоненциального роста), где оценка экспоненциального роста основана на исторических ценах и кривой, аппроксимирующей высоту блоков, представляя долгосрочную «справедливую стоимость». Исторический опыт показывает: ahr999 1.2 — зона высоких цен.
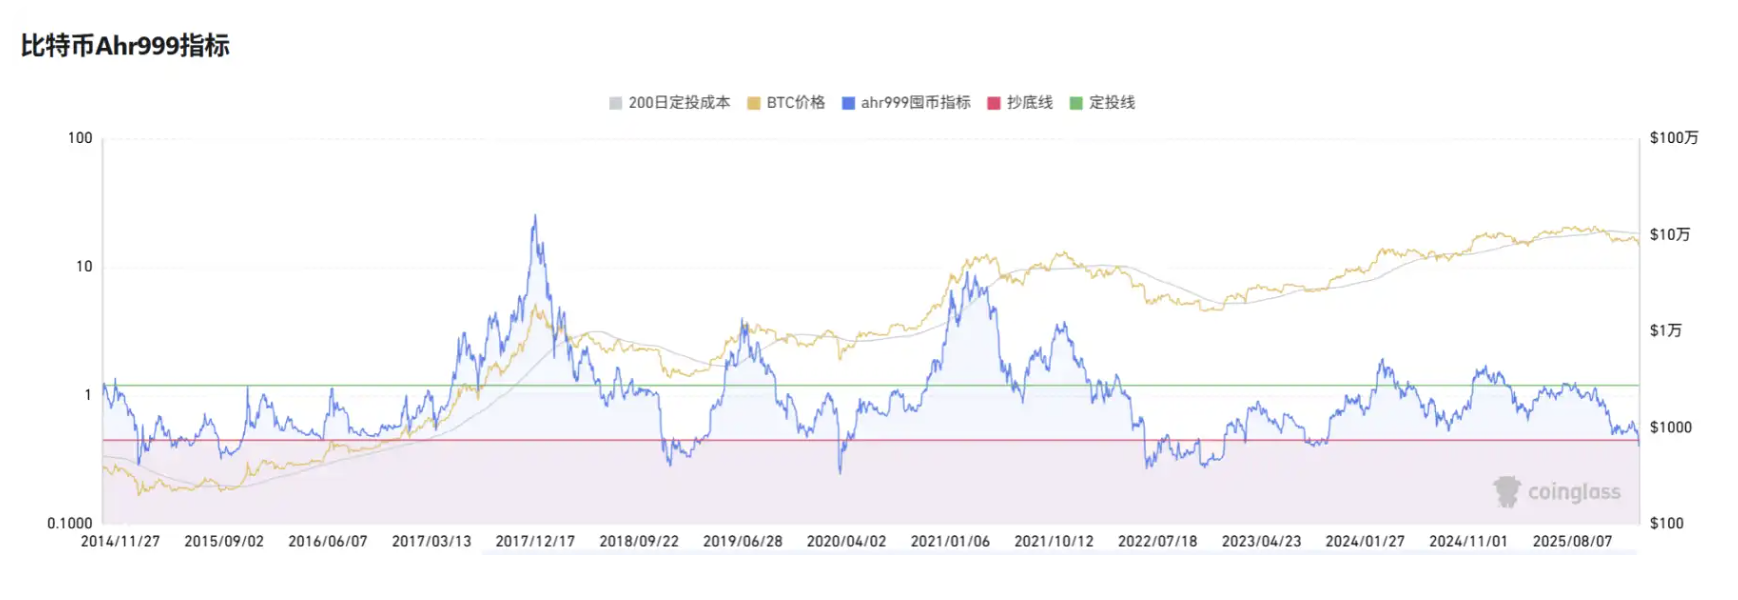
1 февраля 2026 года ahr999 впервые упал ниже 0,45, что произошло впервые за 839 дней с 16 октября 2023 года, что указывает на потенциальное дно рынка. Текущее падение ниже порога предполагает, что цена BTC значительно ниже долгосрочных ожиданий роста, аналогично концу медвежьего рынка 2023 года. Этот сигнал настоятельно рекомендует покупать на дне, но необходимо подтверждение отскока объемом, чтобы избежать ложного пробоя. Стратегия покупки на дне: если ahr999 стабильно ниже 0,45, можно покупать партиями ниже 76 000 долларов, цель — сокращение позиций при восстановлении выше 1,2.
Индикатор Willy Woo показывает железное дно BTC на уровне 45 тысяч долларов
Известный аналитик Willy Woo разработал модель CVDD. Когда Биткоин переходит от старого инвестора, купившего по 1 доллару, к новому инвестору, купившему по 100 000 долларов, новый инвестор оценивает стоимость этих Биткоинов по более высокой минимальной цене, что помогает поднять воспринимаемую минимальную цену всего предложения Биткоинов в глобальном масштабе. Активная смена опекунов (частая передача Биткоинов между разными инвесторами или хранителями) также может указывать на то, что инвесторы очень ценят эти Биткоины.»
Когда многие киты переводят BTC на новые адреса кошельков, рыночная цена дна повышается.
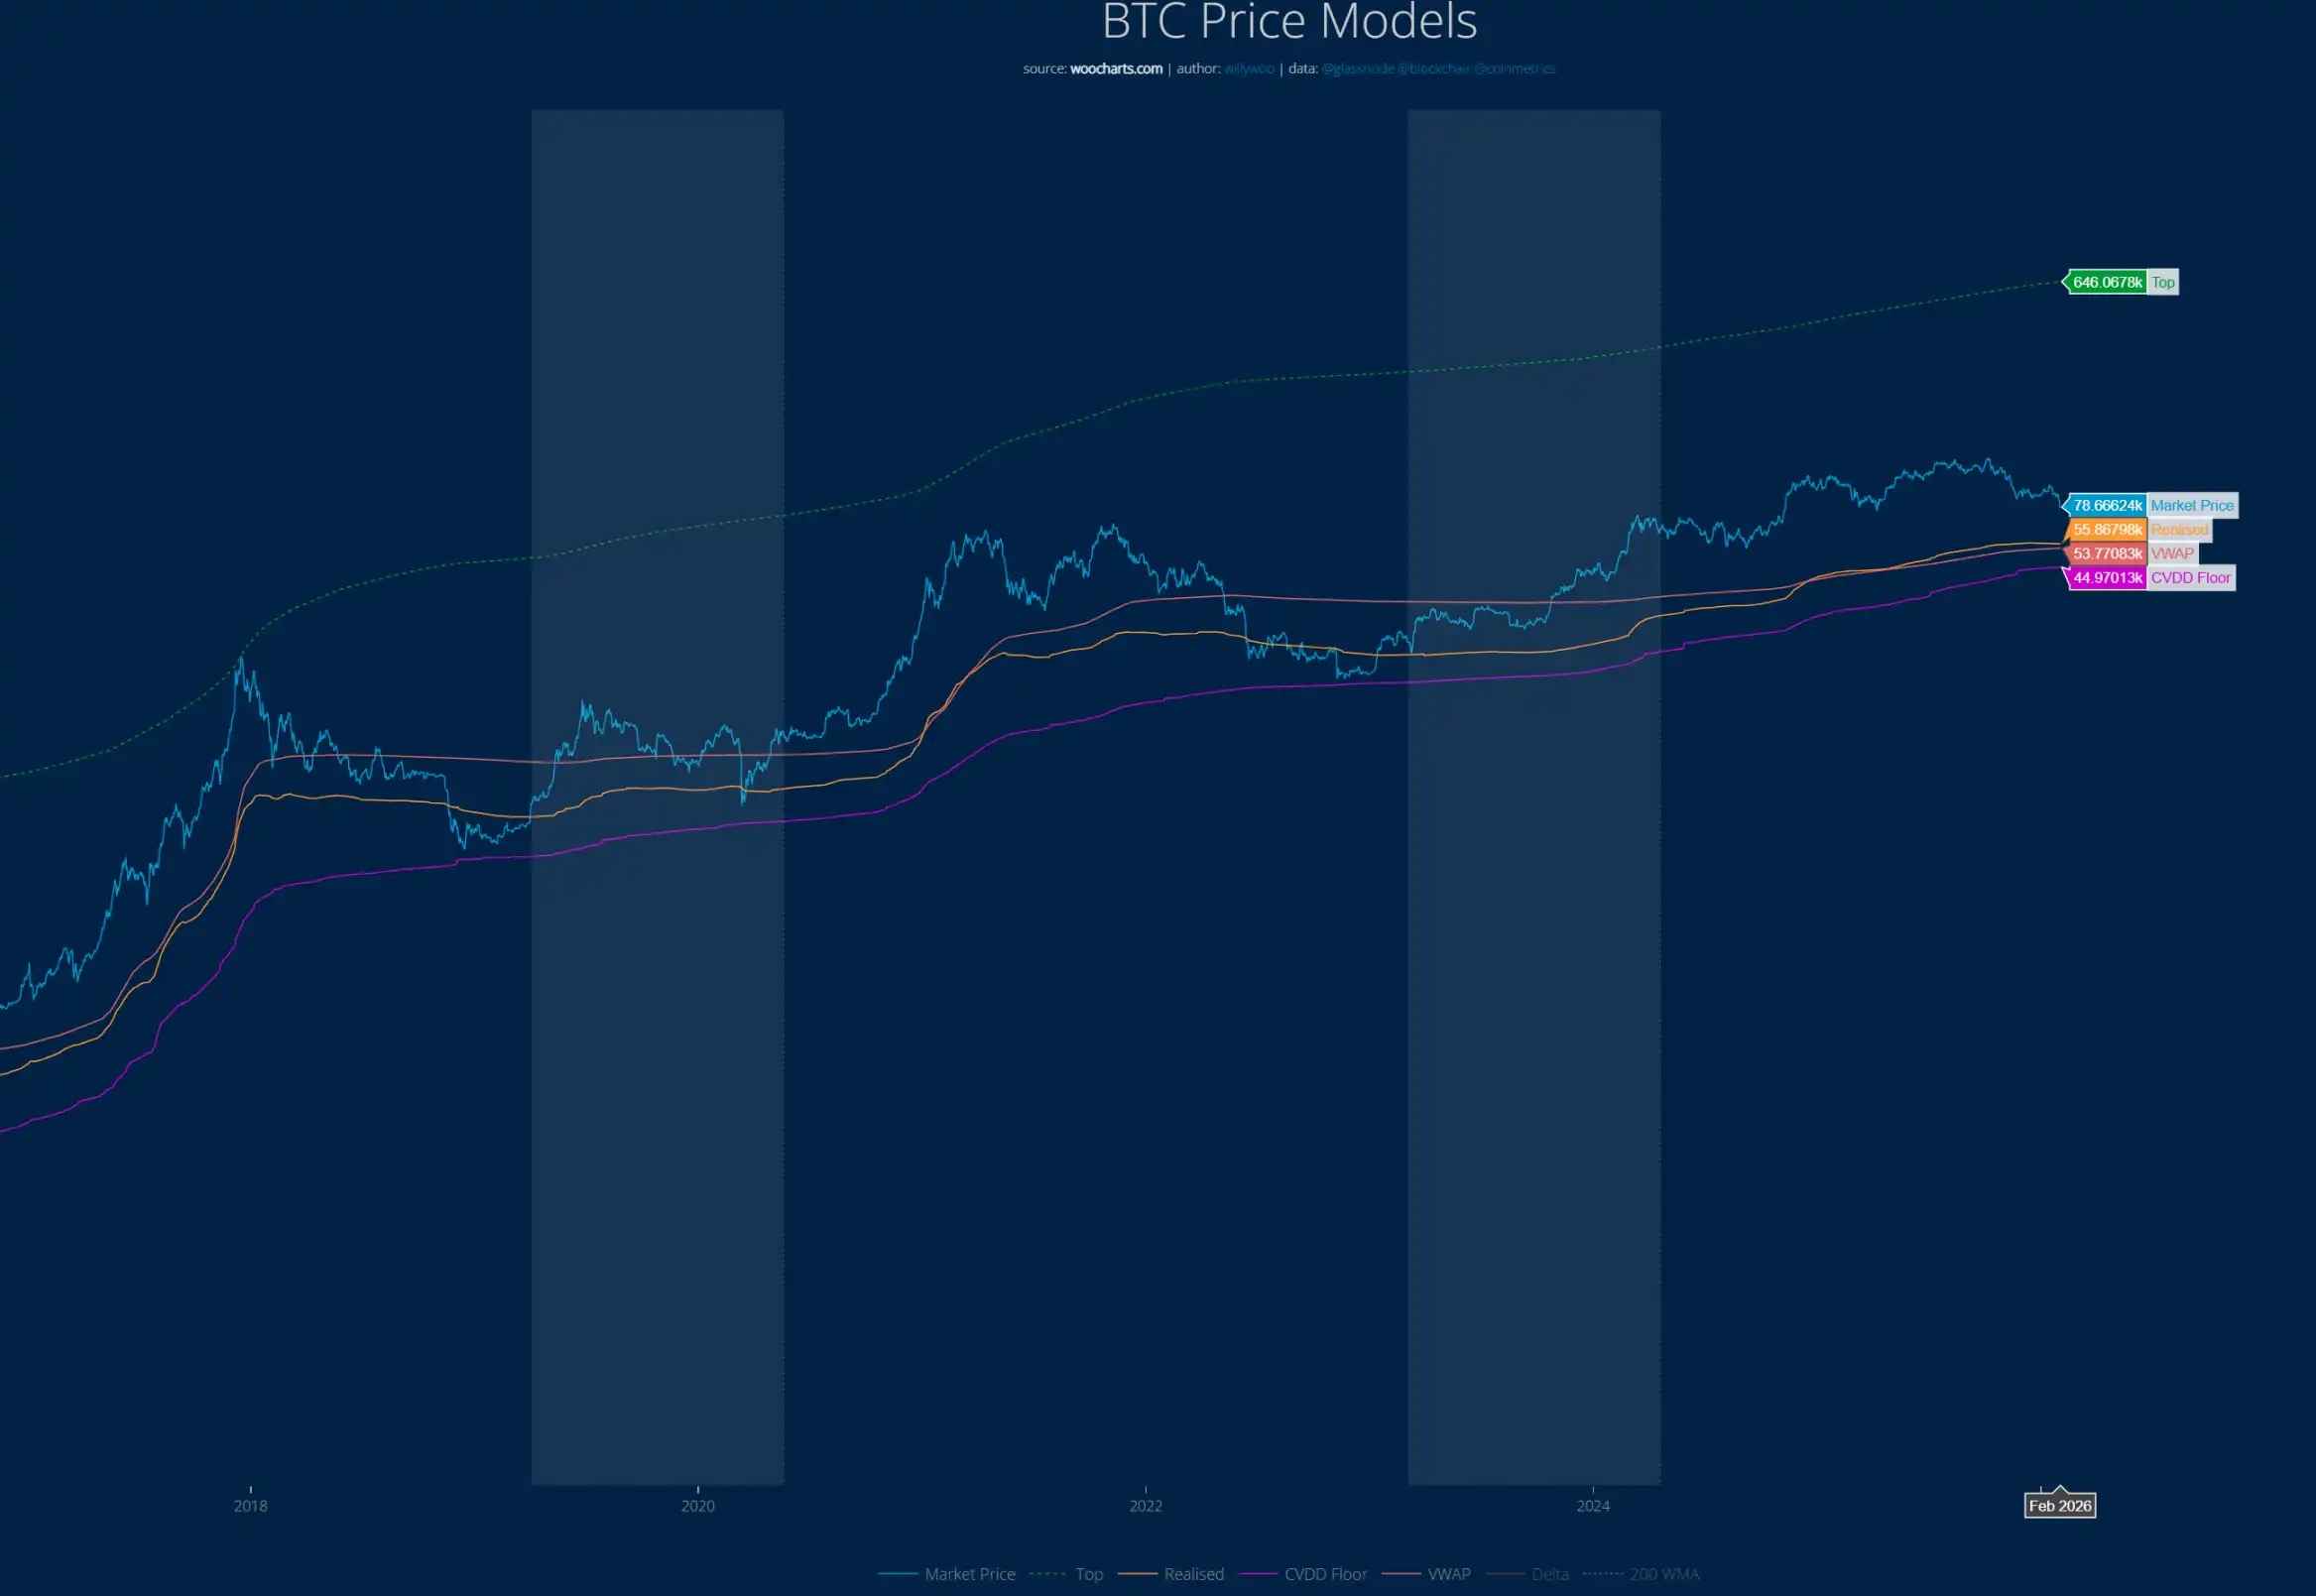
Цена BTC никогда не падала до красной линии (модель CVDD). В настоящее время индикатор CVDD показывает железное дно около 45 000 долларов. В прошлых циклах BTC一度 падал ниже желтой линии на графике, в настоящее время этот диапазон составляет от 53 до 56 тысяч долларов.
Себестоимость Биткоина у Strategy составляет 76 тысяч долларов
По состоянию на 2 февраля, известный крупный держатель Биткоина Strategy holds общая стоимость активов около 54,2 миллиарда долларов, holds 712 647 BTC, его средняя себестоимость составляет approximately 76 040 долларов.
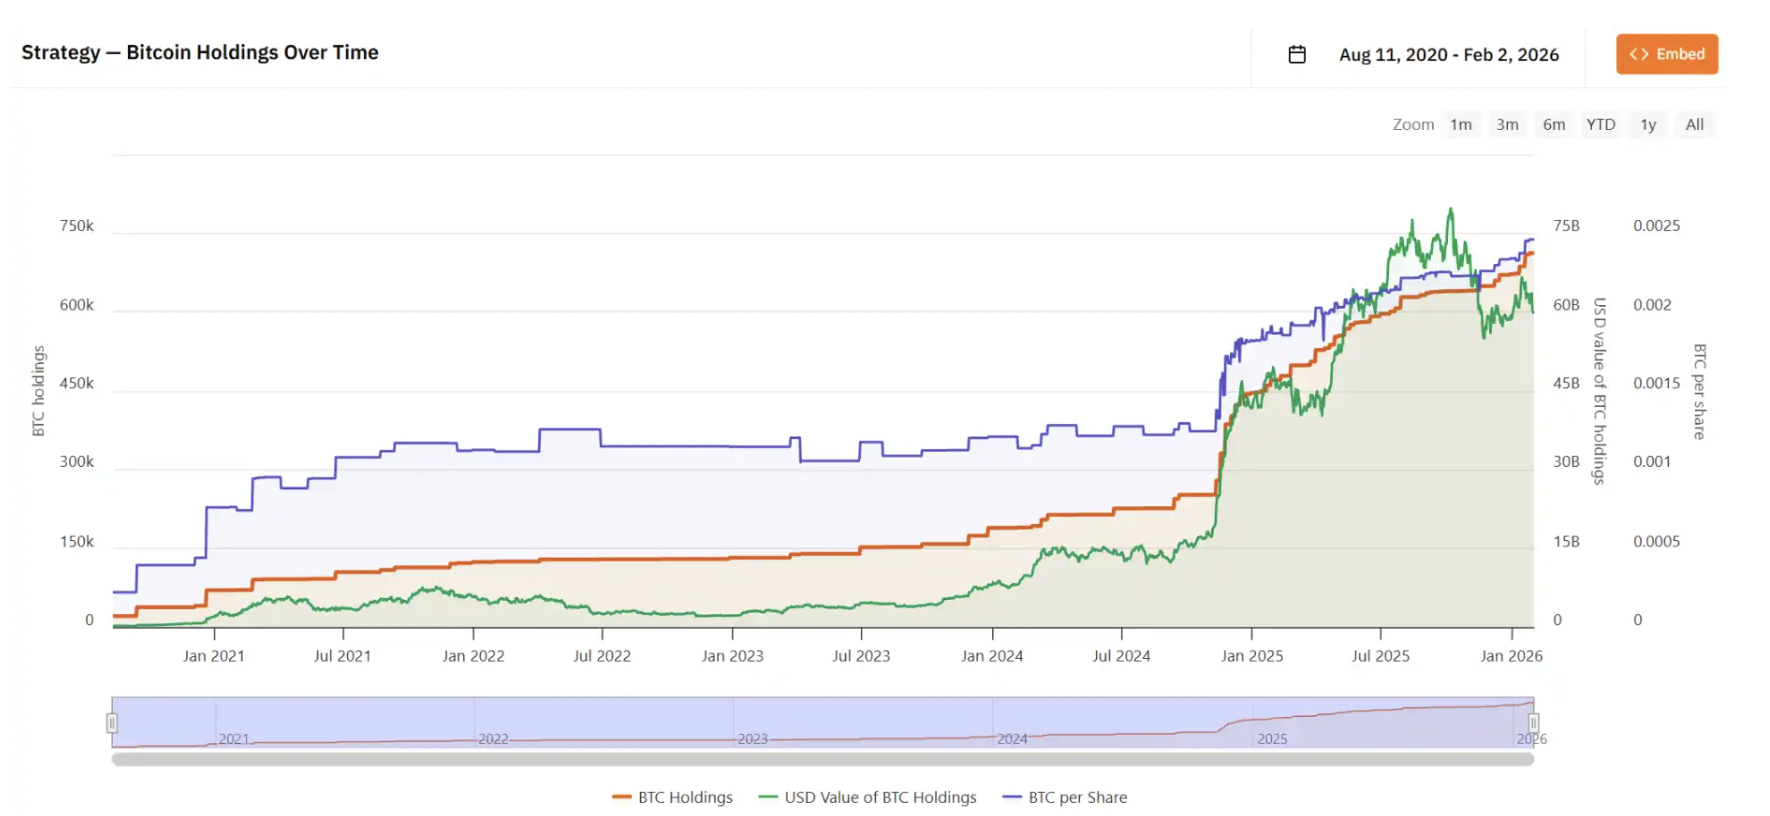
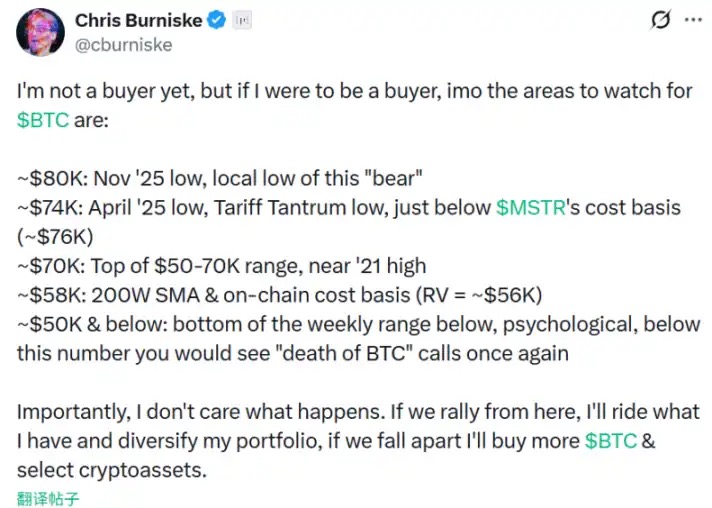
Исторически его средняя себестоимость является нижней границей диапазона дна. Партнер Placeholder Крис ранее заявлял, что уровень 74-76 тысяч долларов является очень важной ценовой линией.
Twitter:https://twitter.com/BitpushNewsCN
Группа общения比推 TG:https://t.me/BitPushCommunity
Подписка比推 TG: https://t.me/bitpush