Эфириум стоит на техническом распутье после падения ниже ближайшей зоны поддержки и повторного тестирования долгосрочной трендовой структуры, которая, по мнению многих аналитиков, может определить следующий серьезный рыночный ход. Хотя после недавнего отката страх быстро распространился по криптотрейдерским кругам, один известный рыночный наблюдатель утверждает, что текущая ситуация может на самом деле напоминать фундамент, с которого начался более ранний восстановительный ралли Эфириума.
Решающая зона для Эфириума
Последний график, которым поделился криптоаналитик BladeDefi, указывает на долгосрочную восходящую линию тренда, которая тихо поддерживала структуру Эфириума в течение нескольких месяцев. Согласно графику, ETH теперь вернулся непосредственно в этот регион после того, как не смог удержаться выше ключевой зоны сопротивления вблизи верхней части своего недавнего диапазона.
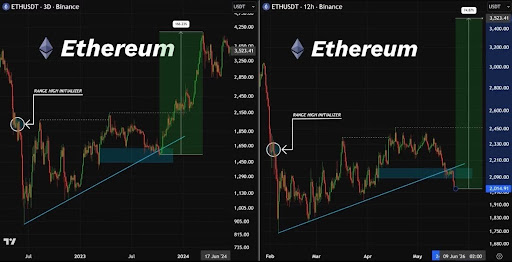
Это падение вызвало новую волну медвежьих комментариев на рынке, особенно после того, как Эфириум потерял импульс в районе $2,700. Однако более широкая структура, показанная на графике, рассказывает более сложную историю. Вместо полного обвала движение цены по-прежнему происходит в пределах того же макро-восстановительного канала, который помог Эфириуму отскочить ранее в этом году.
На графике выделены множественные взаимодействия с этой растущей линией поддержки, показывающие, что предыдущие тесты той же структуры в конечном итоге вызывали сильные восходящие развороты. В то же время более широкая структура графика предполагает, что Эфириум еще не аннулировал свою более широкую бычью структуру, несмотря на резкую реакцию рынка на недавний откат.
Это различие важно, потому что потеря краткосрочной поддержки не всегда эквивалентна разрушению долгосрочной структуры. В предыдущих циклах ETH переживал аналогичные периоды, когда доверие испарялось вблизи зон поддержки незадолго до агрессивного возвращения импульса.
Дорога назад к $3,000
Теперь, когда Эфириум тестирует этот критический трендовый регион, аналитики считают, что устойчивое удержание выше восходящей поддержки может снова открыть путь к повторному завоеванию более высоких зон сопротивления, особенно по мере того, как трейдеры начинают возвращать капитал в крупнокапитализированные цифровые активы.
Уровень $3,000 стал психологически важным, поскольку он находится вблизи зоны, где участие рынка ранее ускорялось во время более ранних попыток пробоя Эфириума. Возвращение этой территории, скорее всего, резко изменит настроения после дней повышенной неопределенности.
Рыночные наблюдатели также следят за тем, сможет ли Эфириум восстановить импульс, формируя более высокие минимумы на меньших таймфреймах. Если этот процесс разовьется, пока более широкий тренд остается неповрежденным, уверенность в продолжении движения к $3,000 может значительно укрепиться.
Окружение более широкого крипторынка также может сыграть свою роль. Относительная стабильность Биткойна помогла предотвратить более серьезный ущерб по крупным альткойнам, в то время как институциональное внимание к цифровым активам продолжает расширяться через потоки спотовых ETF и нарративы более широкого принятия. Этот фон придает дополнительный вес текущей технической позиции ETH.
На данный момент рынок, по-видимому, замер в напряженном противостоянии между страхом и структурой. График, предоставленный BladeDefi, предполагает, что Эфириум не просто возвращается к очередному случайному уровню поддержки. Вместо этого, он может тестировать именно тот фундамент, который способен определить, будет ли следующий серьезный ход направлен обратно к $3,000 или к значительно более глубокой коррекции.