Centrifuge [CFG] подскочила на 39,52% до $0,165, в то время как объем торгов взлетел на 16 780% за 24 часа, что отражает высокую активность и участие на рынке.
Расширение цен ускорилось стремительно, и трейдеры отреагировали агрессивным позиционированием как на спотовых, так и на срочных рынках.
Резкий рост участия говорит о том, что ликвидность вернулась в CFG после длительной тихой фазы.
Кроме того, волатильность значительно расширилась, что часто привлекает краткосрочные спекулятивные потоки.
Однако такое быстрое расширение также поднимает вопросы об устойчивости, особенно когда вместе с ценой начинает нарастать леверидж.
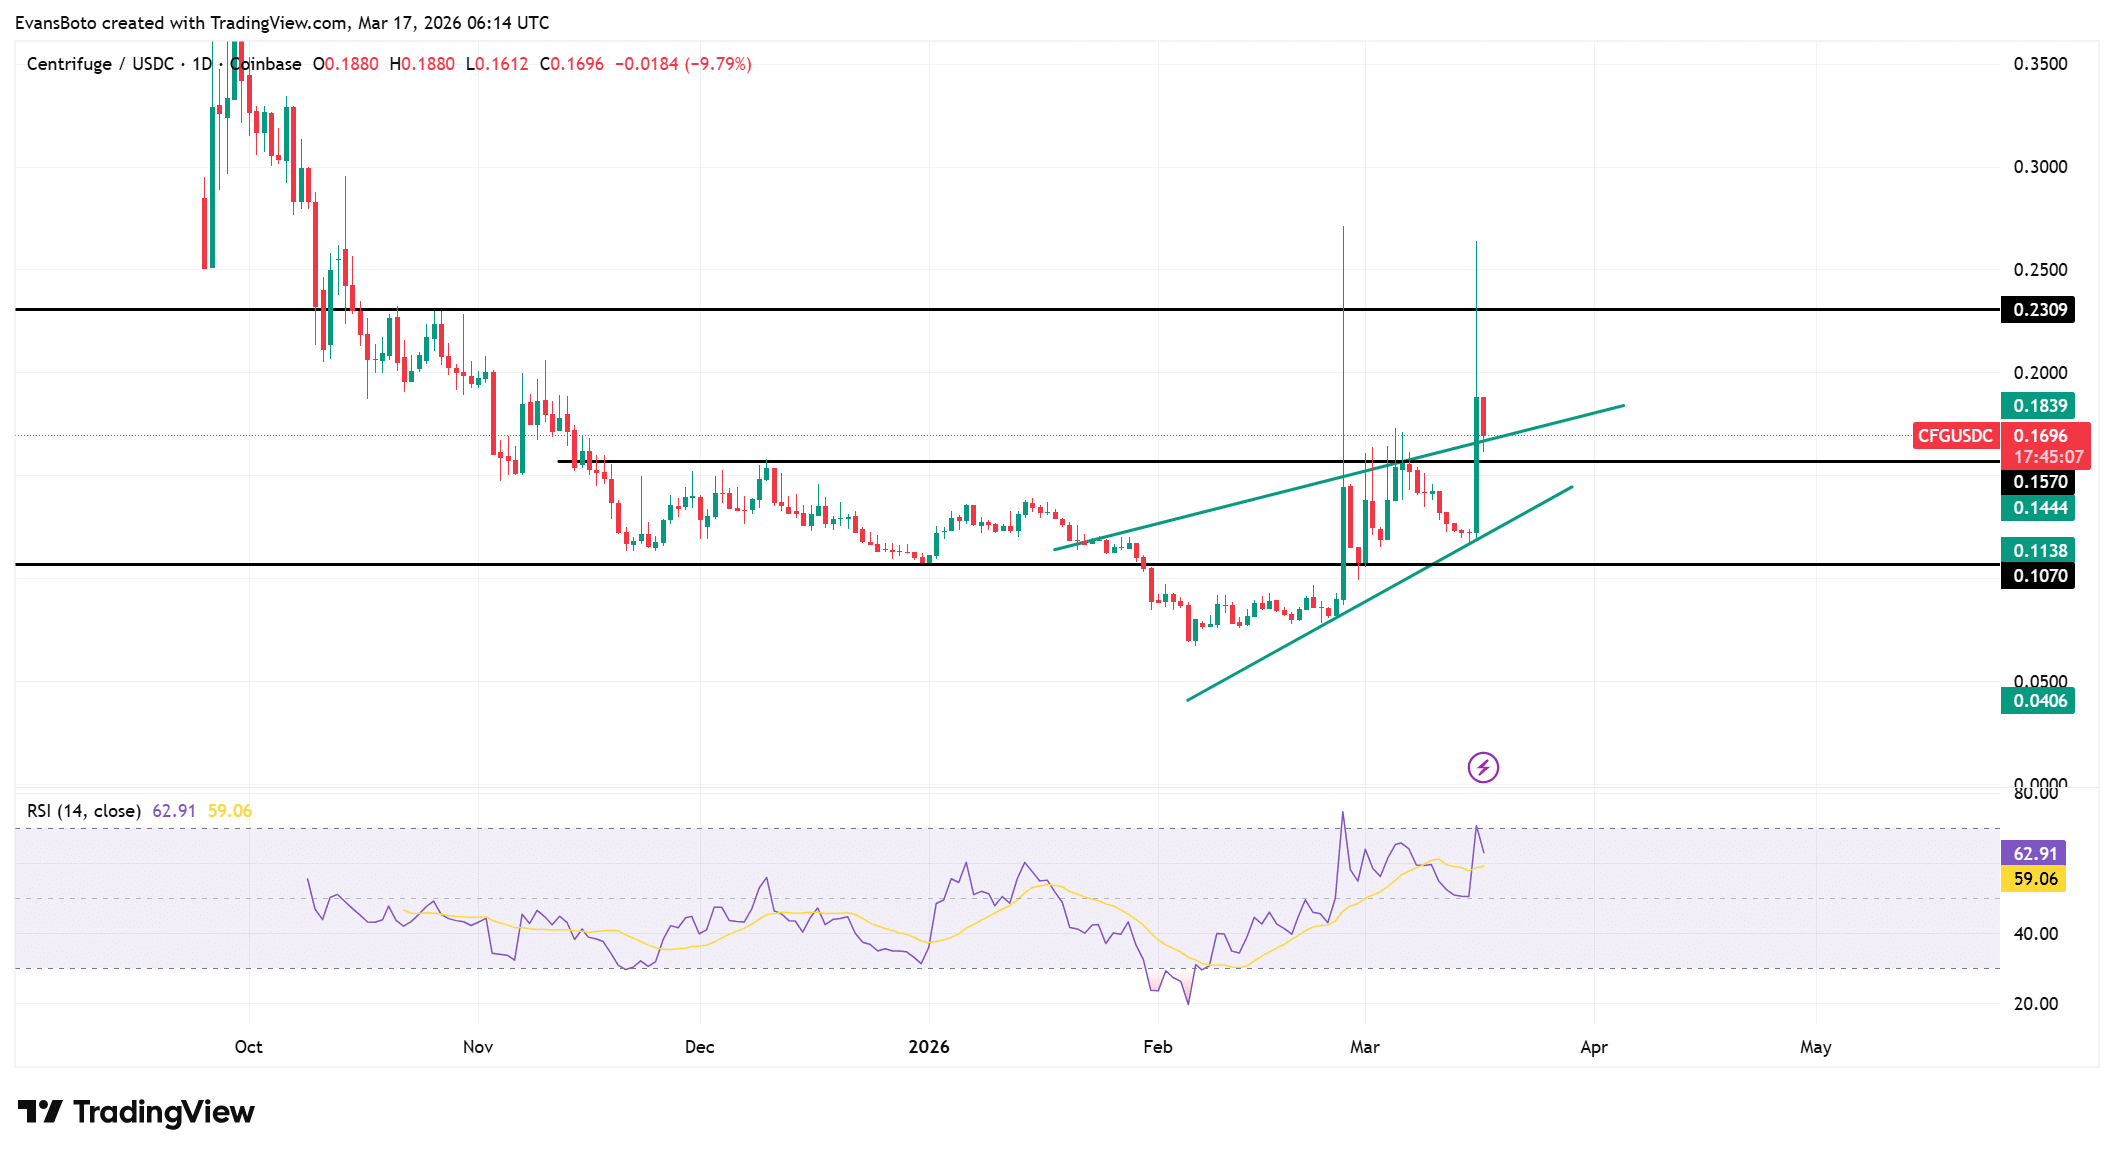
Застопорился ли пробой CFG около сопротивления?
CFG вышел из восходящего клина, что обычно сигнализирует о сдвиге в структуре тренда в сторону расширения.
Цена двинулась к зоне сопротивления $0,18, однако около этого уровня возник отскок, замедливший восходящее движение.
Пробой остается действительным, хотя цена теперь проверяет, могут ли покупатели поддерживать давление выше предыдущей структуры.
Однако отскок предполагает, что продавцы начали активнее защищать более высокие уровни. Такое поведение указывает на то, что фазе пробоя может потребоваться консолидация перед продолжением.
RSI удерживался выше уровня 60, слегка остыв от недавних максимумов, что указывает на то, что давление покупателей остается доминирующим, несмотря на откат.
Индикатор избежал резкого обвала, что говорит о том, что покупатели сохранили контроль над более широкой структурой.
Однако небольшое снижение показывает, что рынок вошел в фазу охлаждения после быстрого расширения.
Структура по-прежнему отражает более высокие минимумы, что поддерживает бычьи намерения, однако неспособность вернуть $0,18 может внести краткосрочную нестабильность.
Таким образом, текущая setup показывает силу, но также выделяет ключевую точку принятия решения для продолжения.

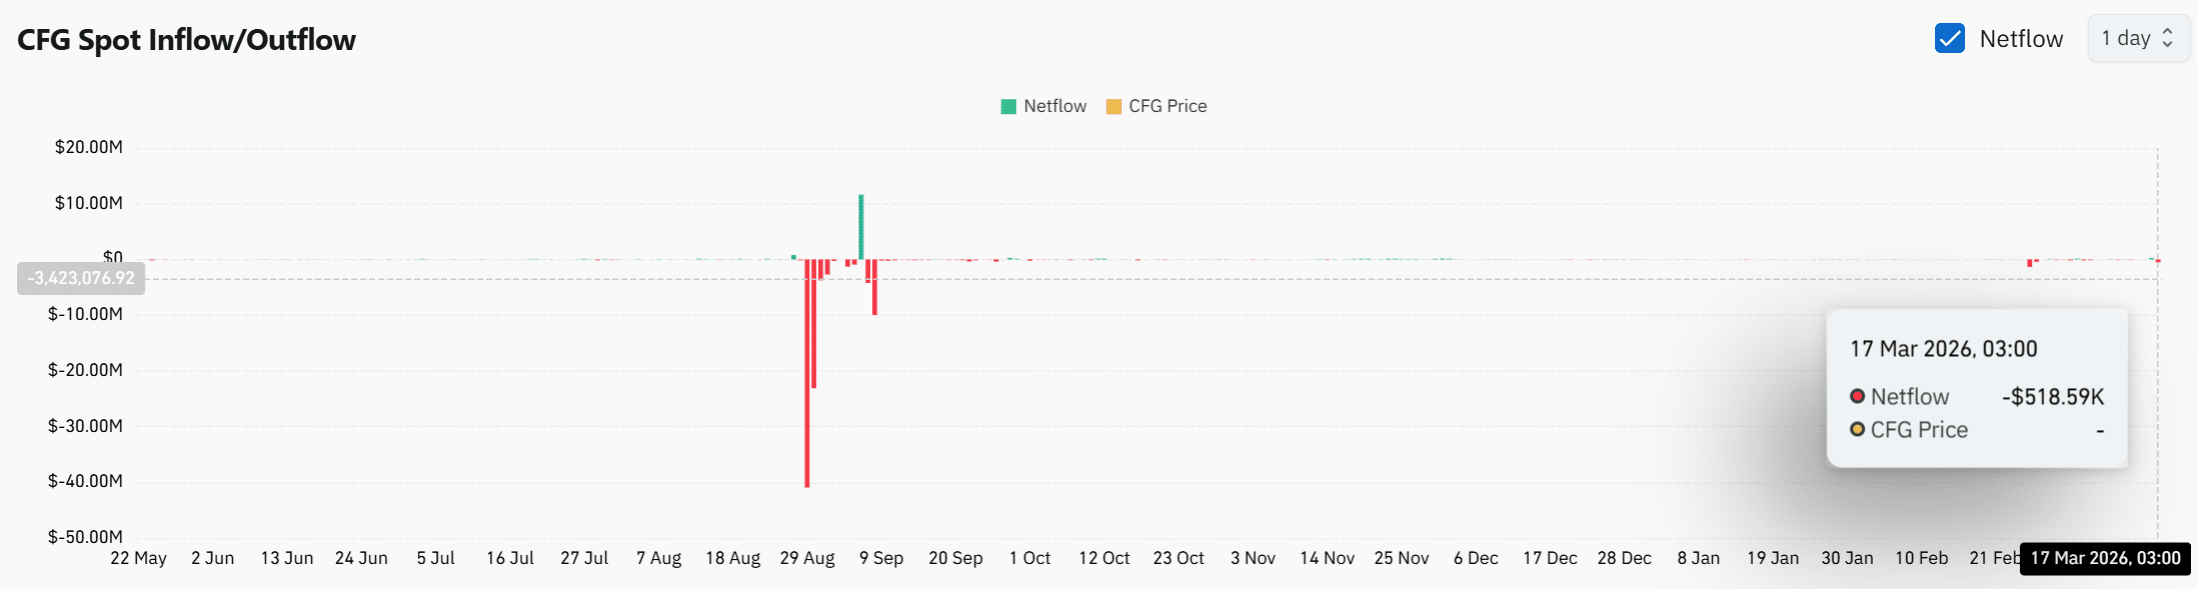
Оттоки намекают на тренд тихого накопления
Чистые потоки на споте оставались слегка отрицательными на уровне около -$518K, что указывает на то, что с бирж вышло больше CFG, чем поступило.
Такая модель часто отражает поведение холдинга, когда участники выводят активы вместо подготовки к продаже.
Однако масштаб оттоков остается относительно modest, что говорит о том, что накопление еще не достигло агрессивных уровней.
Продолжающийся отрицательный чистый поток поддерживает более широкую бычью структуру, поскольку сокращение предложения на биржах tends to limit немедленное давление продаж.
Более того, отсутствие крупных оттоков показывает, что накопление остается постепенным, а не взрывным.

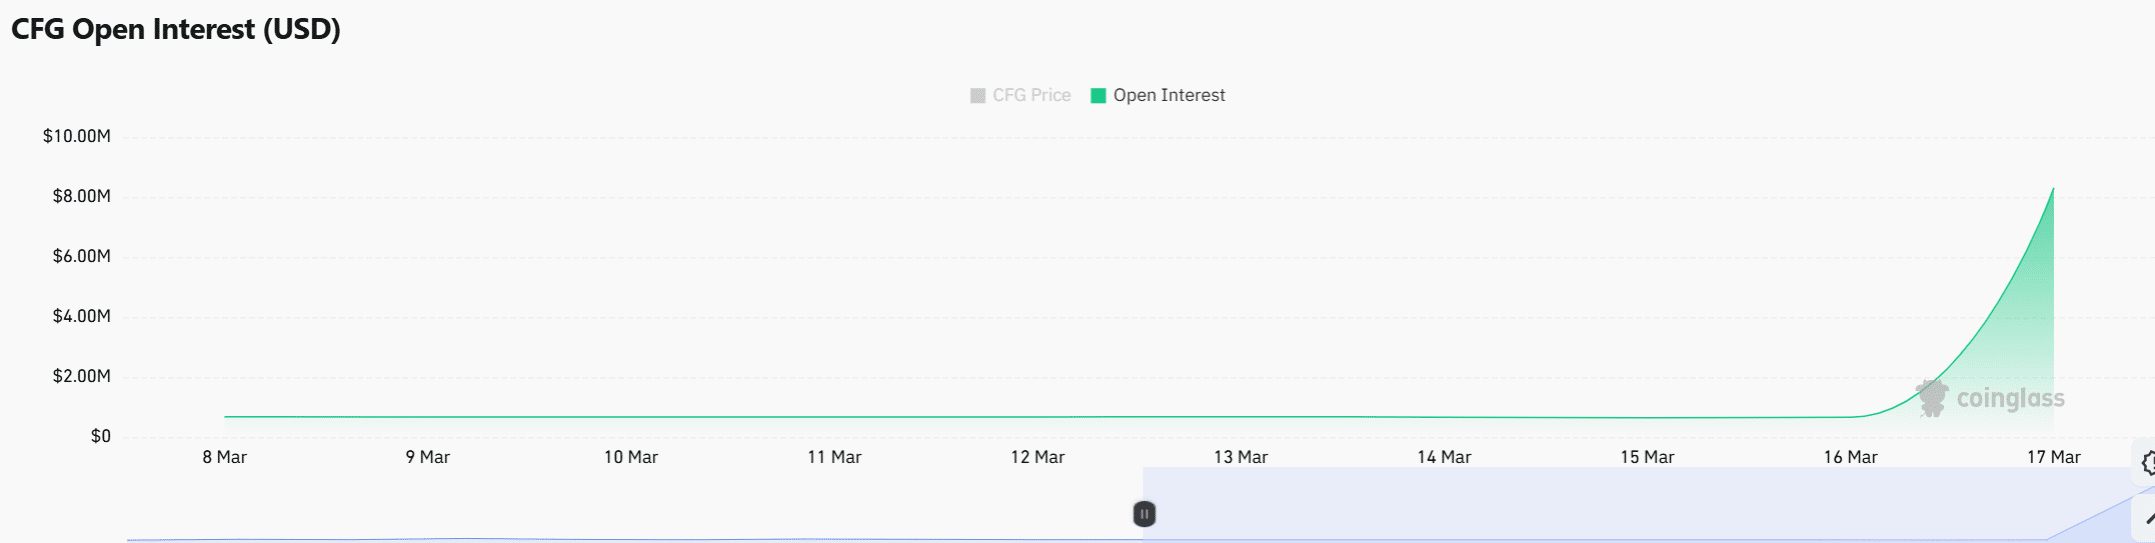
Всплеск левериджа стимулирует расширение срочного рынка
Открытый интерес взлетел более чем на 1 595%, достигнув $11,2 млн, что подчеркивает резкое увеличение leveraged позиционирования на срочных рынках.
Это расширение показывает, что трейдеры вошли агрессивно, вероятно, реагируя на быстрое движение цены.
Однако такой крутой рост открытого интереса также introduces risk, поскольку crowded позиционирование может привести к резким ликвидациям.
Совпадение роста цены и наращивания левериджа suggests, что спекулятивная активность значительно усилилась.
Кроме того, растущий открытый интерес во время фазы пробоя often amplifies волатильность в обоих направлениях.
В результате текущая структура срочного рынка поддерживает continued activity, но также увеличивает вероятность внезапных ценовых колебаний.

Может ли CFG поддерживать этот пробой?
CFG в настоящее время обладает сильной структурой, поддерживаемой расширением цены, стабильной силой RSI и consistent оттоками.
Однако растущий леверидж вносит нестабильность. Если покупатели сохранят контроль над ключевыми уровнями, продолжение остается вероятным.
Тем не менее, crowded позиционирование на срочном рынке может спровоцировать резкую волатильность, что означает, что устойчивость зависит от controlled expansion, а не от агрессивных спекуляций.
Итоговое резюме
- CFG демонстрирует сильный структурный сдвиг, но растущий леверидж suggests, что волатильность может усилиться до того, как появится какой-либо устойчивый тренд на продолжение.
- Сила цены остается intact выше ключевых зон, однако отскок от сопротивления signals, что рынку нужна консолидация, прежде чем подтвердить дальнейшее направление роста.


