BTC Thrice Rejected at $80,000 Threshold, HYPE Reaches New Highs Signaling Opportunity | Guest Analysis

marsbitОпубликовано 2026-05-26Обновлено 2026-05-26

Введение

**Bitcoin (BTC) Struggles at $80k; HYPE Reaches New Highs | Key Analysis & Strategy** Bitcoin faces continued resistance in the $78.5k - $79.5k zone after failing to sustain a break above its daily chart rising channel. It has retreated to the channel's midline. A failure to hold here could see a test of the $73.5k - $75k support area. The 4-hour chart shows a complex corrective structure. The strategy is neutral for mid-term positions. For short-term trading, two scenarios are outlined: **A)** Selling on a failed rally into the $78.5k-$79.5k resistance, and **B)** Selling on a confirmed breakdown below the $73.5k-$75k support, both with tight risk management. Meanwhile, **HYPE** has posted consecutive highs. The 4-hour chart indicates its current uptrend may be weakening near $65, with models showing potential bearish divergence. The view is that a short-term top could be forming. The strategy advises against chasing the rally and instead looking for a potential long entry on a pullback to the $47.5 - $50 support zone, provided clear reversal signals appear. Last week, a disciplined short BTC trade based on model signals yielded a 2.78% profit. The article emphasizes that all analysis is for informational purposes only and not investment advice, highlighting the importance of strict stop-loss discipline and dynamic position management in a volatile market. *(Note: The text references proprietary models like the "Price Difference Trading Model" and "Momentum Quantificatio...

Continuing our consistent structured analysis framework this week, we focus on two key assets, Bitcoin and HYPE, dissecting the current price action across multiple timeframes. We will examine the ongoing battle between bulls and bears at critical resistance and support zones and formulate specific, actionable operational plans accordingly.

Last week's short position successfully realized a gain of 2.78%, once again validating the trading logic of "signal-driven, disciplined execution." However, a single profitable trade never implies the market direction is definitively correct—the market always retains the potential to move beyond expectations.

The core variable for this week remains the struggle between the resistance zone of $78,500~$79,500 and the support zone of $73,500~$75,000. The outcome will be left for the market to decide.

Summary of This Week's Core Trading Views:

• Analysis of BTC's Multi-Timeframe Price Structure. (Detailed in Part 1)

• BTC Market Forecast and Medium-/Short-Term Trading Strategies for This Week. (Detailed in Part 2)

• Analysis of HYPE's Hourly Chart Price Structure. (Detailed in Part 3)

• HYPE Market Forecast and Short-Term Trading Strategy for This Week. (Detailed in Part 4)

Verification of Last Week's Trading Strategy and Core Views:

• BTC Short-Term Trade Performance: Bitcoin executed one short-term short trade last week (1x leverage), successfully achieving a return of approximately 2.78%. (Detailed in Table 1)

• Market Verification of BTC Trend Forecast: In last week's article, we stated: If the price effectively breaks below the support zone of $78,500~$79,500, it will test the support strength near $75,000. The current market movement has verified our previous forecast.

1. Analysis of Bitcoin's Multi-Timeframe Price Structure

1.1 BTC Daily Chart Structure Analysis

Bitcoin _ Daily Chart:
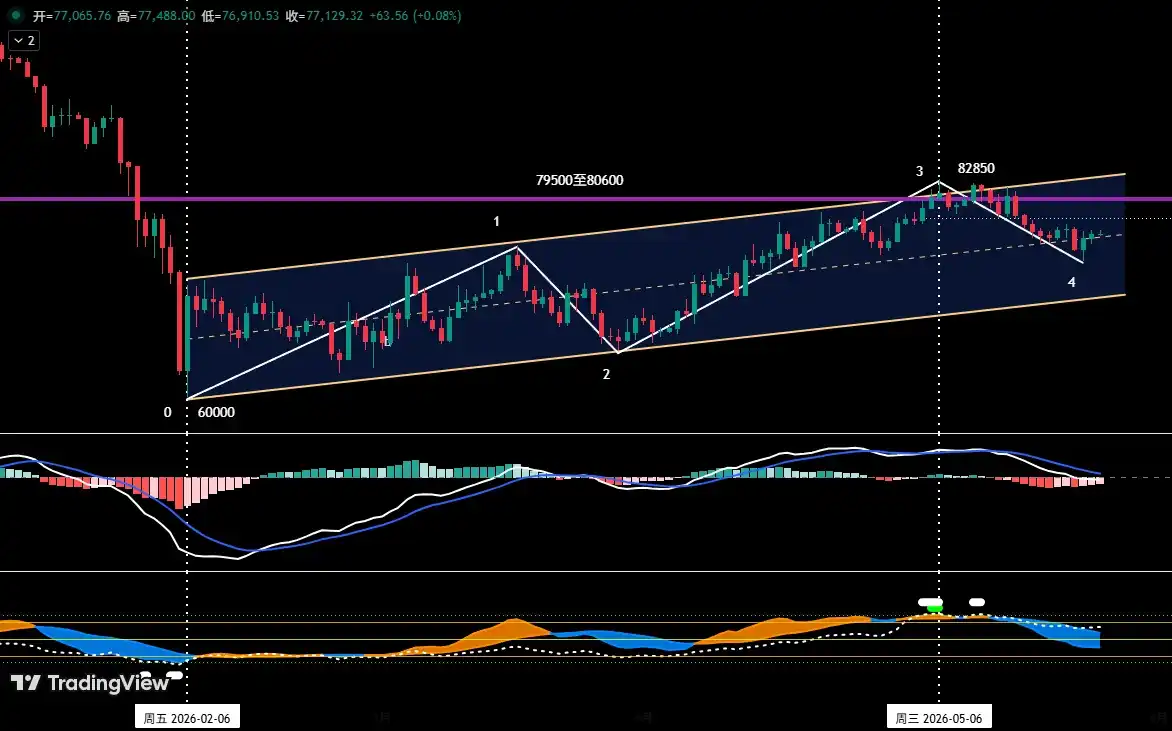
Figure 1

• As shown in (Figure 1), since establishing a significant low near $60,000 on February 6, 2026, Bitcoin's daily chart has constructed and maintained a clearly defined ascending channel: its lower boundary is formed by connecting the lows of February 6 and March 29, while the upper boundary is drawn parallel to the lower boundary through the high of March 17.

• In our weekly review on April 27, we pointed out: "The current price is facing dual resistance from the channel's upper boundary and the $79,500 to $80,600 resistance zone. A breakout is expected to be difficult." Subsequent market action validated this view. After nearly 20 days of struggle between bulls and bears, although a new rebound high of $82,850 was reached on May 6, the price failed to decisively break above this resistance area and subsequently began a corrective pullback.

From the current structure, the price has retraced from near the channel's upper boundary to the mid-channel area. If the price fails to find effective support near the mid-channel and resume its uptrend, the probability of it seeking support at the channel's lower boundary increases.

1.2 In-Depth Analysis of BTC's Hourly Chart Structure

Bitcoin _ 4-Hour Chart
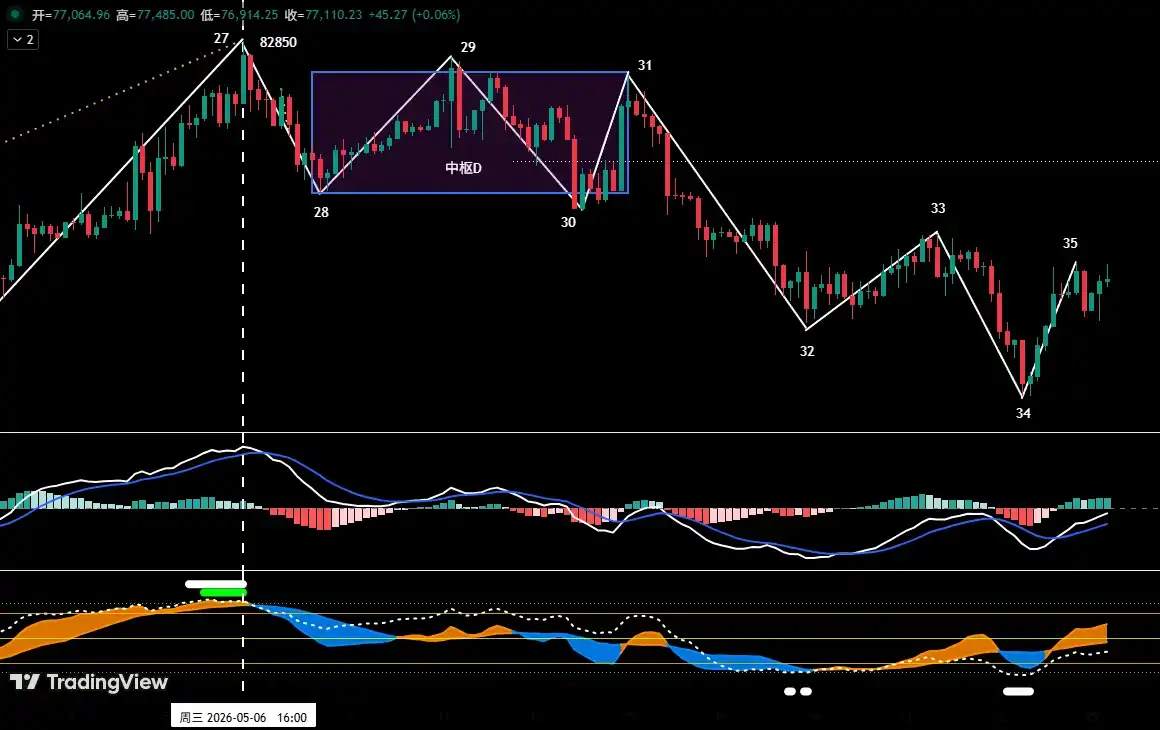
Figure 2

As shown in (Figure 2), from the high of $82,850 on May 6 to the present correction:

• The 4-hour chart shows it can be subdivided into an 8-segment corrective structure: "segment 27-28" to "segment 34-35". Center D: Segments 28-29, 29-30, and 30-31 overlap, constituting Center D.

• From the 4-hour price structure, segment 34-35 is about to rebound to the $78,500~$79,500 zone. If the rebound faces rejection upon reaching this area and fails to form a decisive breakout, the market is likely to continue its current corrective consolidation pattern and test the core support band of $73,500~$75,000 again.

2. Bitcoin Market Forecast and Trading Strategy for This Week

2.1 BTC Market Trend Forecast for This Week:

This week's core view: Focus on the outcome of the battle between bulls and bears over the $78,500~$79,500 resistance zone and the $73,500~$75,000 support zone.

2.2 Core Resistance Levels:

• Primary Resistance Zone: $78,500~$79,500 area (near the boundaries of two centers)

• Secondary Resistance Zone: $83,500~$84,500 area (previous high-volume trading congestion zone)

2.3 Core Support Levels:

• Primary Support Zone: $73,500~$75,000 area (previous significant support level)

• Secondary Support Zone: $69,500~$70,500 area (previous significant support level)

2.4 Trading Strategy for This Week (Excluding Impact of Sudden News)

1. Medium-Term Strategy:

Bitcoin _ Daily Chart: (Position Monitoring Model)
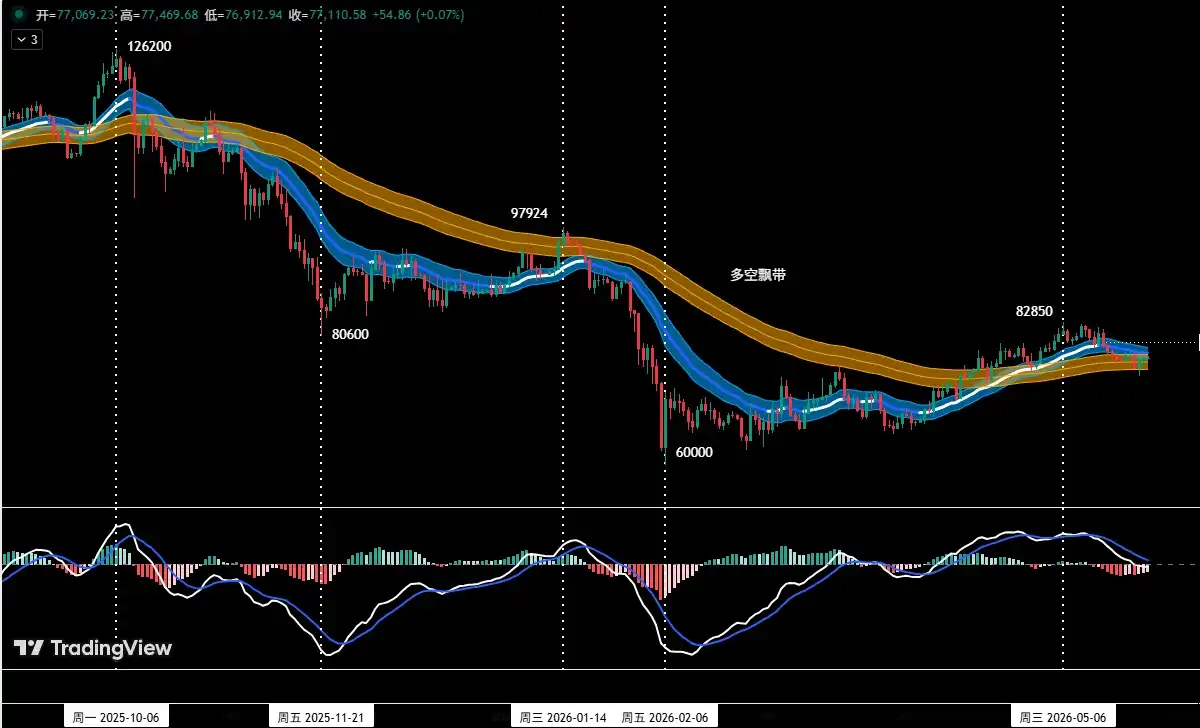
Figure 3

Position Monitoring Model: As shown in (Figure 3), based on trading rules, the medium-term market direction is not yet clear. Maintain a neutral/观望 stance for medium-term positions this week.

2. Short-Term Strategy: Utilize 30% of capital, set stop-losses, and look for "spread" trading opportunities based on support and resistance levels. (Using 30-minute/60-minute charts as the operational timeframe).

3. For short-term operations, to dynamically adapt to the market's complex evolution, we have pre-formulated two specific operational plans: A/B.

Plan A: Rebound Faces Resistance, Sell High.

• Entry: When the price rebounds to the $78,500~$79,500 zone and encounters resistance, combined with a top signal from the quantitative model, a short position of less than 30% can be established.

• Risk Control: Initial stop-loss set above $80,600.

• Exit: When the correction approaches important support levels combined with model signals, gradually close the position to take profits.

Plan B: Support Breached Effectively, Follow the Trend Short.

• Entry: When the price effectively breaks below the $73,500~$75,000 support zone combined with a model top signal, a short position of less than 30% can be established.

• Risk Control: Initial stop-loss set above $76,500.

• Exit: When the decline reaches important support levels combined with model signals, gradually close the position to take profits.

3. Analysis of HYPE's Price Structure

HYPE_4-Hour Chart
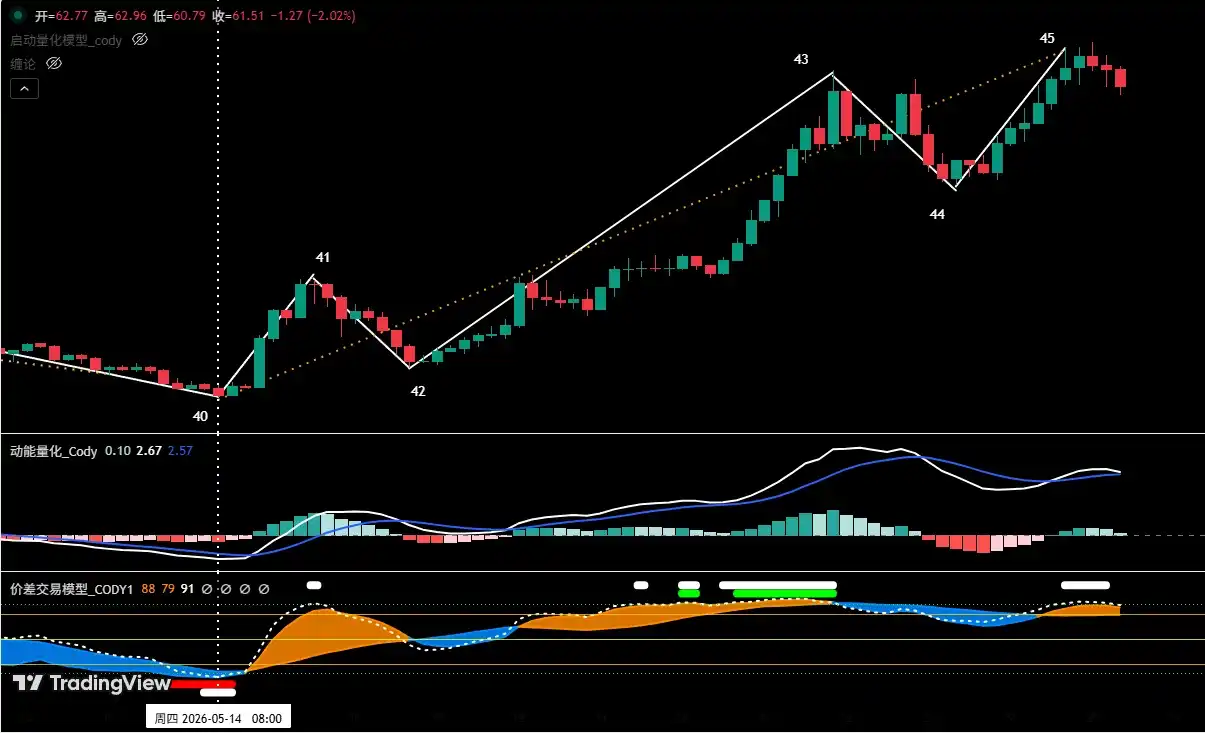
Figure 4

1. As shown in (Figure 4), the rally in HYPE from the low of $38.14 on May 14, on the 4-hour chart, can be divided into a five-segment structure: 40-41, 41-42, 42-43, 43-44, 44-45.

2. Our proprietary "Spread Trading Model" shows that near endpoint 45, a top warning signal (white dot) has been triggered.

3. From the perspective of the "Momentum Quantitative Model," the rising segment (44-45) near $65 has shown signs of waning upward momentum.

4. If a bearish momentum divergence forms at the "endpoint 45" position, overlapping with the top warning signal from the "Spread Trading Model," creating a共振 (resonance), the probability of the price forming a short-term high here increases significantly.

4. HYPE Market Forecast and Short-Term Trading Strategy for This Week

4.1 HYPE Market Trend Forecast for This Week:

This week's core HYPE view:

• Observe whether "endpoint 45" can form a short-term high since the rally began on May 14.

• If a short-term high forms, subsequently look for short-term long opportunities after the price pulls back to a key support area (e.g., $47.5 to $50) and shows clear signs of stabilization.

4.2 HYPE Short-Term Trading Strategy for This Week: (Buy on Support)

Currently, adhere to the strategy of "avoid盲目追涨 (blindly chasing rallies), buy on dips." If the price corrects to the $47.5 to $50 zone, finds support, and shows stabilization signals, combined with bottom signals triggered by both models, consider a light long position. Position size must be controlled below 30%, with strict stop-loss discipline.

5. Trade Review

5.1 Short-Term Trade Review:(See Table 1)

Strictly following the operational plan, based on trading signals from our proprietary "Spread Trading Model" and "Momentum Quantitative Model," we completed one short-term (short) trade last week, achieving a profit of 2.78%.

5.1 Bitcoin Short-Term Trade Details Summary: (Leverage*1x)
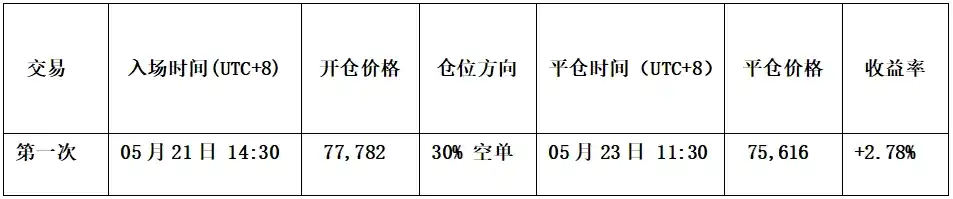
Table 1

5.2 Short-Term Trade Review: (See Figure 5)

• Entry Strategy:

a. When the price rebounded to near $78,500, encountered resistance, and showed bearish pressure signals, with the candlestick forming a "top reversal" bearish signal;

b. The "Spread Trading Model" triggered a top warning signal (white dot), and the "Momentum Quantitative Model" formed a bearish momentum divergence signal.

Therefore, we established a 30% short position at $77,782.

• Exit Strategy:

a. When the price fell to near $75,000 and found support, with the candlestick forming a "bottom reversal" signal;

b. The "Spread Trading Model" triggered a strong bottom warning signal (red dot + white dot), forming a bottom共振 (resonance) signal with the "Momentum Quantitative Model."

Therefore, we closed the entire position near $75,616.

• Summary: This trade successfully realized a profit of approximately 2.78%.

BTC_30 Minute Chart: (Momentum Quantitative Model + Spread Trading Model)
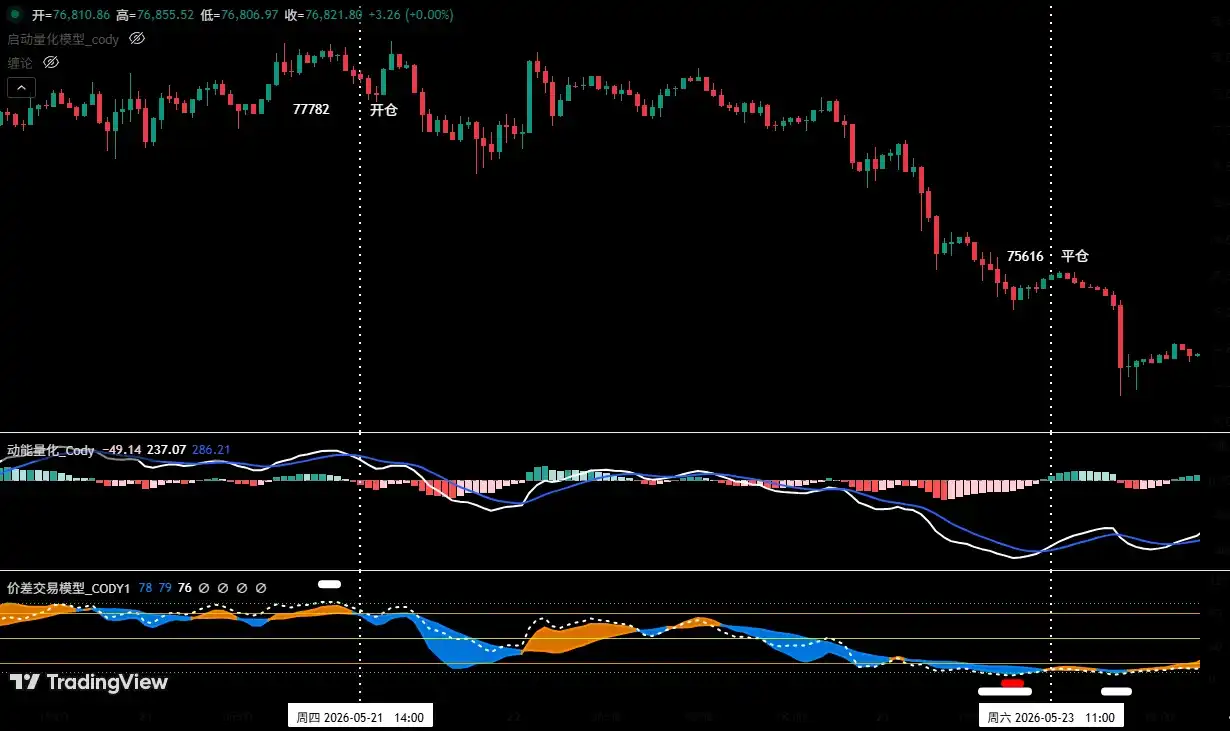
Figure 5 (Short-Term Trade Illustration)

6. Special Reminders:

1. Upon Entry: Immediately set the initial stop-loss.

2. When Profit Reaches 1%: Move the stop-loss to the entry price (breakeven point) to ensure principal safety.

3. When Profit Reaches 2%: Move the stop-loss to the 1% profit level.

4. Continuous Tracking: Thereafter, for every additional 1% profit, move the stop-loss up by 1%, dynamically protecting and locking in profits.

Financial markets are瞬息万变 (constantly changing). All market analysis and trading strategies require dynamic adjustment. All views, analytical models, and operational strategies mentioned in this article are derived from personal technical analysis, intended solely for personal trading journal purposes. They do not constitute any investment advice or operational basis. The market involves risks; invest with caution. Do not make decisions based solely on this content.


Трендовые криптовалюты

Связанные с этим вопросы

QWhat is the core resistance zone that Bitcoin (BTC) is struggling to break through according to the article?

AAccording to the article, Bitcoin (BTC) is struggling to break through the core resistance zone of $78,500 to $79,500. This area has acted as a key barrier, with BTC facing it three times already.

QWhat are the two specific short-term operation plans outlined for Bitcoin in the article?

AThe article outlines two short-term operation plans for Bitcoin (BTC): Plan A: 'Rebound meets resistance, sell high' - open a short position if the price rebounds to the $78,500-$79,500 resistance zone and shows signs of pressure. Plan B: 'Effectively breaks support, follow the trend to sell short' - open a short position if the price effectively breaks below the $73,500-$75,000 support zone.

QWhat is the key support area to watch for HYPE according to the analysis?

AThe key support area to watch for HYPE, as per the article, is the $47.5 to $50 region. The strategy suggests looking for short-term buying opportunities if the price falls back to this zone, shows signs of stabilization, and is accompanied by bottom signals from their trading models.

QWhat trading models does the article mention were used for the successful short-term BTC trade last week?

AThe article mentions that last week's successful short-term BTC trade was executed based on signals from two proprietary models: the 'Price Difference Trading Model' and the 'Dynamic Energy Quantification Model'.

QWhat is the overall stance for Bitcoin's medium-term strategy this week according to the 'Position Monitoring Model'?

AAccording to the 'Position Monitoring Model' shown in the article, the medium-term strategy for Bitcoin (BTC) this week is to maintain an empty position and adopt a wait-and-see approach, as the medium-term market direction is not yet clear.

Похожее

Свадебное дело Чхве Тхэвона закрыто: раскрывая скрытые линии наследования за триллионной империей SK Hynix

Дело о разводе главы SK Group Чхве Тхэвона завершилось, раскрывая сложные сценарии наследования в конгломерате, стоящем за SK Hynix, чья капитализация превысила 1000 трлн вон. В отличие от традиционных сценариев наследования в чеблях, где ключевую роль играют первенец, доли, брачные связи и отцовское признание, трое детей Чхве Тхэвона от бывшей жены Но Соён — дочь Чхве Юнджон (1989 г.р.), дочь Чхве Минджон (1991 г.р.) и сын Чхве Ингын (1995 г.р.) — следуют разными путями. Чхве Юнджон, названная СМИ «наиболее очевидным кандидатом», занимает руководящую должность в SK Inc. и работает над стратегией развития в области биотехнологий и точной медицины, сочетая научную подготовку с бизнес-опытом. Её брак с основателем ИИ-стартапа символизирует новый тип элитных союзов. Чхве Минджон, добровольно служившая в ВМС Республики Корея и работавшая в сфере международной политики в SK Hynix в США, сейчас является основателем ИИ-стартапа в сфере здравоохранения. Её брак с бывшим офицером морской пехоты США подчёркивает связь с геополитическим контекстом, в котором теперь существует полупроводниковый гигант. Чхве Ингын, единственный сын и, казалось бы, естественный наследник по старой логике, сохраняет молчание. Имея образование в области физики, он покинул SK E&S, чтобы присоединиться к McKinsey, что рассматривается как стандартная внешняя стажировка, но без явных сигналов о наследовании. Громкое судебное разбирательство по разводу родителей, связанное с разделом активов на триллионы вон, стало фоном для их путей. По мере того как SK Hynix становится глобальным геополитическим активом в эпоху ИИ, наследование в SK перестаёт быть семейным делом, превращаясь в публичный экзамен на легитимность в новой, сложной реальности. Наследникам предстоит найти свои собственные ответы на вызовы эпохи.

marsbit20 ч. назад

Свадебное дело Чхве Тхэвона закрыто: раскрывая скрытые линии наследования за триллионной империей SK Hynix

marsbit20 ч. назад

Банки выступают против компромисса по доходности стейблкоинов – Найдёт ли закон CLARITY 60 голосов?

Американский Банковский институт политики выступил против нового проекта закона CLARITY Act, указав на пробелы в регулировании доходности стейблкоинов и мерах по борьбе с незаконными финансами. Банковский сектор добивается полного запрета любых форм вознаграждений по стейблкоинам и лоббирует сенаторов, что снижает поддержку со стороны республиканцев. Из-за смерти сенатора Грэма и болезни Макконнелла у республиканцев стало 51 голос. Если сенаторы Кёртис и Корнин откажут в поддержке, эта цифра упадет до 49, а для принятия закона потребуется 60 голосов. Необходимость заручиться поддержкой 11 демократов осложняется тем, что некоторые про-крипто демократы также выступают против законопроекта. Сроки ограничены: до августовских каникул Сената осталось две недели. Лидер большинства Джон Тюн сомневается в успехе до перерыва. Советник Белого дома по криптовалютам Патрик Уитт призывает провести голосование, утверждая, что новые этические нормы устраняют возражения демократов. Вероятность принятия закона в 2026 году, по рыночным оценкам, упала до 32%.

ambcrypto20 ч. назад

Банки выступают против компромисса по доходности стейблкоинов – Найдёт ли закон CLARITY 60 голосов?

ambcrypto20 ч. назад

За 2 месяца оценка выросла с 8,8 до 68 млрд юаней! Крупнейший AI-хаб OpenRouter может быть куплен

Stripe ведет переговоры о приобретении стартапа OpenRouter, агрегатора API крупных языковых моделей, за сумму около 100 миллиардов долларов. Это представляет собой семикратный рост по сравнению с оценкой OpenRouter в 13 миллиардов долларов двумя месяцами ранее. OpenRouter выступает в качестве «маршрутизатора» или агрегатора для более чем 400 AI-моделей (таких как GPT, Claude и множество открытых), позволяя разработчикам через единый API выбирать наиболее подходящую модель для каждой задачи на основе стоимости, скорости и сложности. Это помогает приложениям снижать расходы, автоматически направляя простые запросы к более дешевым моделям. Компания, основанная соучредителем OpenSea Алексом Аталлой, демонстрирует быстрый рост: ее ежегодный доход достиг 50 миллионов долларов, увеличившись в пять раз за полгода. Для Stripe, крупнейшего процессора онлайн-платежей, это вторая крупная сделка в сфере AI-инфраструктуры после приобретения платформы биллинга Metronome в 2025 году. Стратегия Stripe заключается в создании комплексного предложения для AI-экономики: OpenRouter будет «выбирать модель», Metronome — «подсчитывать потребление», а существующие платежные сервисы Stripe — «обрабатывать оплату». Таким образом, Stripe стремится контролировать ключевой уровень инфраструктуры, который определяет распределение трафика между моделями и формирует счета для конечных предприятий. Сделка подчеркивает растущую важность промежуточного слоя, который управляет стоимостью и выбором моделей для миллионов пользователей AI-приложений.

链捕手20 ч. назад

За 2 месяца оценка выросла с 8,8 до 68 млрд юаней! Крупнейший AI-хаб OpenRouter может быть куплен

链捕手20 ч. назад

От OpenSea до OpenRouter: Алекс Аталлах повторяет сценарий «ухода на пике»?

Автор: Нэнси, PANews Алекс Аталла, соучредитель NFT-платформы OpenSea, покинул компанию на пике пузыря NFT четыре года назад. Сейчас он снова оказывается в центре внимания на волне бума ИИ, готовясь продать созданную им агрегирующую платформу AI-моделей OpenRouter по высокой цене. По данным The Wall Street Journal от 23 июля, платежный гигант Stripe ведет переговоры о приобретении OpenRouter, при этом потенциальная оценка сделки может приблизиться к 100 миллиардам долларов. Если сделка состоится, это станет еще одним успехом Аталлы в создании компании на уровне ста миллиардов долларов после OpenSea. Ранее в этом месяце появились сообщения о том, что OpenRouter получил предложения о покупке от нескольких крупных технологических компаний. Потенциальная сделка со Stripe рассматривается как важный шаг для инфраструктурного гиганта в сфере платежей по расширению своего присутствия в области инфраструктуры ИИ. По данным информированных источников, если сделка будет заключена, оценка OpenRouter может приблизиться к 100 миллиардам долларов, что значительно превышает его предыдущие оценки при финансировании. Всего за три года компания добилась быстрого роста благодаря буму больших моделей. Это не первая компания Аталлы стоимостью в сто миллиардов. Ранее он был соучредителем OpenSea, ведущей мировой платформы для торговли NFT, пиковая оценка которой превысила 130 миллиардов долларов. Его уход с OpenSea до серьезного спада на рынке NFT рассматривался как знаковый сигнал. OpenRouter стала крупнейшим хабом в эпоху ИИ, подключившись к более чем 400 AI-моделям, имея около 10 миллионов пользователей и обрабатывая более 200 триллионов токенов в месяц. Однако, несмотря на быстрый рост, это бизнес с большими объемами, но ограниченной рентабельностью. Его основная бизнес-модель заключается в взимании комиссии за платформу (около 5-5,5%) при вызове разработчиками AI-моделей. Конкуренция на рынке агрегации AI-моделей также обостряется. Высокая оценка OpenRouter, возможно, больше отражает его будущий потенциал, чем текущую прибыльность. Для потенциальных покупателей наиболее ценным активом могут быть не текущие доходы, а накопленные реальные данные об использовании ИИ, которые трудно быстро воспроизвести. От NFT к ИИ Алекс Аталла дважды поймал волну технологического бума. Если продажа OpenRouter состоится с оценкой в 100 миллиардов долларов, это может означать либо переоценку стоимости инфраструктуры ИИ, либо сигнал о новом пике цикла. Ответ на этот вопрос даст только время.

链捕手21 ч. назад

От OpenSea до OpenRouter: Алекс Аталлах повторяет сценарий «ухода на пике»?

链捕手21 ч. назад

Приближается ли Биткойн к очередной зоне накопления? ЭТОТ сигнал говорит «да»

Аналитики отмечают, что Bitcoin (BTC) переживает один из самых длительных медвежьих периодов, охватывающий три квартала и два календарных года, при этом его динамика отклонилась от рынка акций. Однако сохраняется корреляция с акциями Apple (AAPL). График соотношения BTC/AAPL с 2017 года движется в восходящем канале, где его нижняя граница традиционно сигнализирует о зоне недооценки (накопления) для Bitcoin, а верхняя — о перекупленности. В настоящее время соотношение приближается к линии поддержки, что, по историческим данным, может предшествовать новой фазе роста BTC. При этом в 2025 году нарушилась многолетняя корреляция годовой доходности Bitcoin с индексами S&P 500 и Nasdaq 100, что объясняется его более резкой реакцией на макроэкономические потрясения. В качестве подтверждающего сигнала для разворота рассматриваются поступления стейблкоинов на криптобиржи, которые указывают на готовность капитала к реинвестированию. За последние семь дней чистый приток составил $1,42 млрд, что значительно меньше оттока в $10 млрд за предыдущие 30 дней и пока недостаточно для уверенного старта ралли. Таким образом, соотношение BTC/AAPL указывает на возможное приближение к зоне накопления, но для подтверждения тренда необходимы более значительные притоки стейблкоинов.

ambcrypto21 ч. назад

Приближается ли Биткойн к очередной зоне накопления? ЭТОТ сигнал говорит «да»

ambcrypto21 ч. назад

Торговля

Спот

Популярные статьи

Как купить HYPE

Добро пожаловать на HTX.com! Мы сделали приобретение Hyperliquid (HYPE) простым и удобным. Следуйте нашему пошаговому руководству и отправляйтесь в свое крипто-путешествие.Шаг 1: Создайте аккаунт на HTXИспользуйте свой адрес электронной почты или номер телефона, чтобы зарегистрироваться и бесплатно создать аккаунт на HTX. Пройдите удобную регистрацию и откройте для себя весь функционал.Создать аккаунтШаг 2: Перейдите в Купить криптовалюту и выберите свой способ оплатыКредитная/Дебетовая Карта: Используйте свою карту Visa или Mastercard для мгновенной покупки Hyperliquid (HYPE).Баланс: Используйте средства с баланса вашего аккаунта HTX для простой торговли.Третьи Лица: Мы добавили популярные способы оплаты, такие как Google Pay и Apple Pay, для повышения удобства.P2P: Торгуйте напрямую с другими пользователями на HTX.Внебиржевая Торговля (OTC): Мы предлагаем индивидуальные услуги и конкурентоспособные обменные курсы для трейдеров.Шаг 3: Хранение Hyperliquid (HYPE)После приобретения вами Hyperliquid (HYPE) храните их в своем аккаунте на HTX. В качестве альтернативы вы можете отправить их куда-либо с помощью перевода в блокчейне или использовать для торговли с другими криптовалютами.Шаг 4: Торговля Hyperliquid (HYPE)С легкостью торгуйте Hyperliquid (HYPE) на спотовом рынке HTX. Просто зайдите в свой аккаунт, выберите торговую пару, совершайте сделки и следите за ними в режиме реального времени. Мы предлагаем удобный интерфейс как для начинающих, так и для опытных трейдеров.

663 просмотров всегоОпубликовано 2024.12.11Обновлено 2026.06.02

Как купить HYPE

Обсуждения

Добро пожаловать в Сообщество HTX. Здесь вы сможете быть в курсе последних новостей о развитии платформы и получить доступ к профессиональной аналитической информации о рынке. Мнения пользователей о цене на HYPE (HYPE) представлены ниже.

活动图片