As the Strait of Hormuz Reopens, What Trades Is the Market Betting On?

marsbitОпубликовано 2026-06-15Обновлено 2026-06-15

Введение

As the possibility of a US-Iran agreement and the reopening of the Strait of Hormuz emerges, financial markets are rapidly pricing out the geopolitical risk premium built over the past three months. Following announcements from US and Iranian officials, Asian markets rallied and oil prices (Brent crude fell to around $84) dropped significantly. Analysts highlight several potential trades: shorting crude oil's risk premium (with Brent potentially falling to $80), buying airline and cruise stocks (like DAL, UAL, CCL) due to lower fuel costs, favoring Asian energy-importing economies (Japan, South Korea), and extending bond duration while selling inflation expectations as energy-driven price pressures ease. Other beneficiaries include LNG, fertilizer, and chemical chains. However, risks remain as the formal signing is set for June 19th, with implementation and shipping logistics taking time. Key signals to watch are oil prices sustaining below key levels, the performance of transportation stocks, and prediction market probabilities for the deal. The market is betting on de-escalation but remains cautious of execution risks.

This is the 40th time Trump has said a U.S.-Iran deal is about to happen.

While we've largely become immune to Trump's statements, this time the progress is more concrete than ever before.

On June 14th, Pakistani Prime Minister Shehbaz Sharif announced a U.S.-Iran peace agreement. Trump subsequently confirmed, stating the maritime blockade would be lifted, allowing "free passage" through the Strait of Hormuz. Iran's Deputy Foreign Minister also said the text of the agreement is complete, with an immediate end to war and military operations, including actions towards Lebanon.

Asian markets gave the answer directly at Monday's open. Major indices in Tokyo and Seoul surged over 5% at one point, oil prices fell $3 per barrel, with Brent dropping to around $84. The logic is straightforward: the geopolitical risk premium that has been weighing on energy prices for the past three and a half months is being squeezed out by the market in a rush.

Although this is not yet a finalized peace agreement. The crucial signing is scheduled for June 19th in Switzerland, and the American and Iranian understandings of the deal differ. The U.S. speaks of a free and open strait, while Iranian media reports say maritime traffic will be coordinated and managed by Iran and Oman, resuming within 30 days according to "Iranian arrangements." Israel was still striking Beirut around the time of the announcement. The tough issues—nuclear matters, uranium enrichment, sanctions relief—have all been pushed into a 60-day negotiation window.

But we can more accurately say that the war and conflict have essentially shifted completely from the military level to the bargaining table.

The importance of the Strait of Hormuz needs little explanation. Before the war, about one-fifth of the world's oil and significant volumes of LNG passed through this waterway. Following U.S.-Israeli strikes on Iran on February 28th, Iran retaliated with missiles, drones, and maritime restrictions, gradually turning the strait from a "risk corridor" to a "de facto impeded corridor." Over the past three-plus months, the market feared a triple lock: Iran using the strait as a bargaining chip, the U.S. blockading Iranian ports, and the Israeli-Hezbollah front making it politically difficult for Iran to concede domestically. These three lines were twisted together, leaving no room for movement.

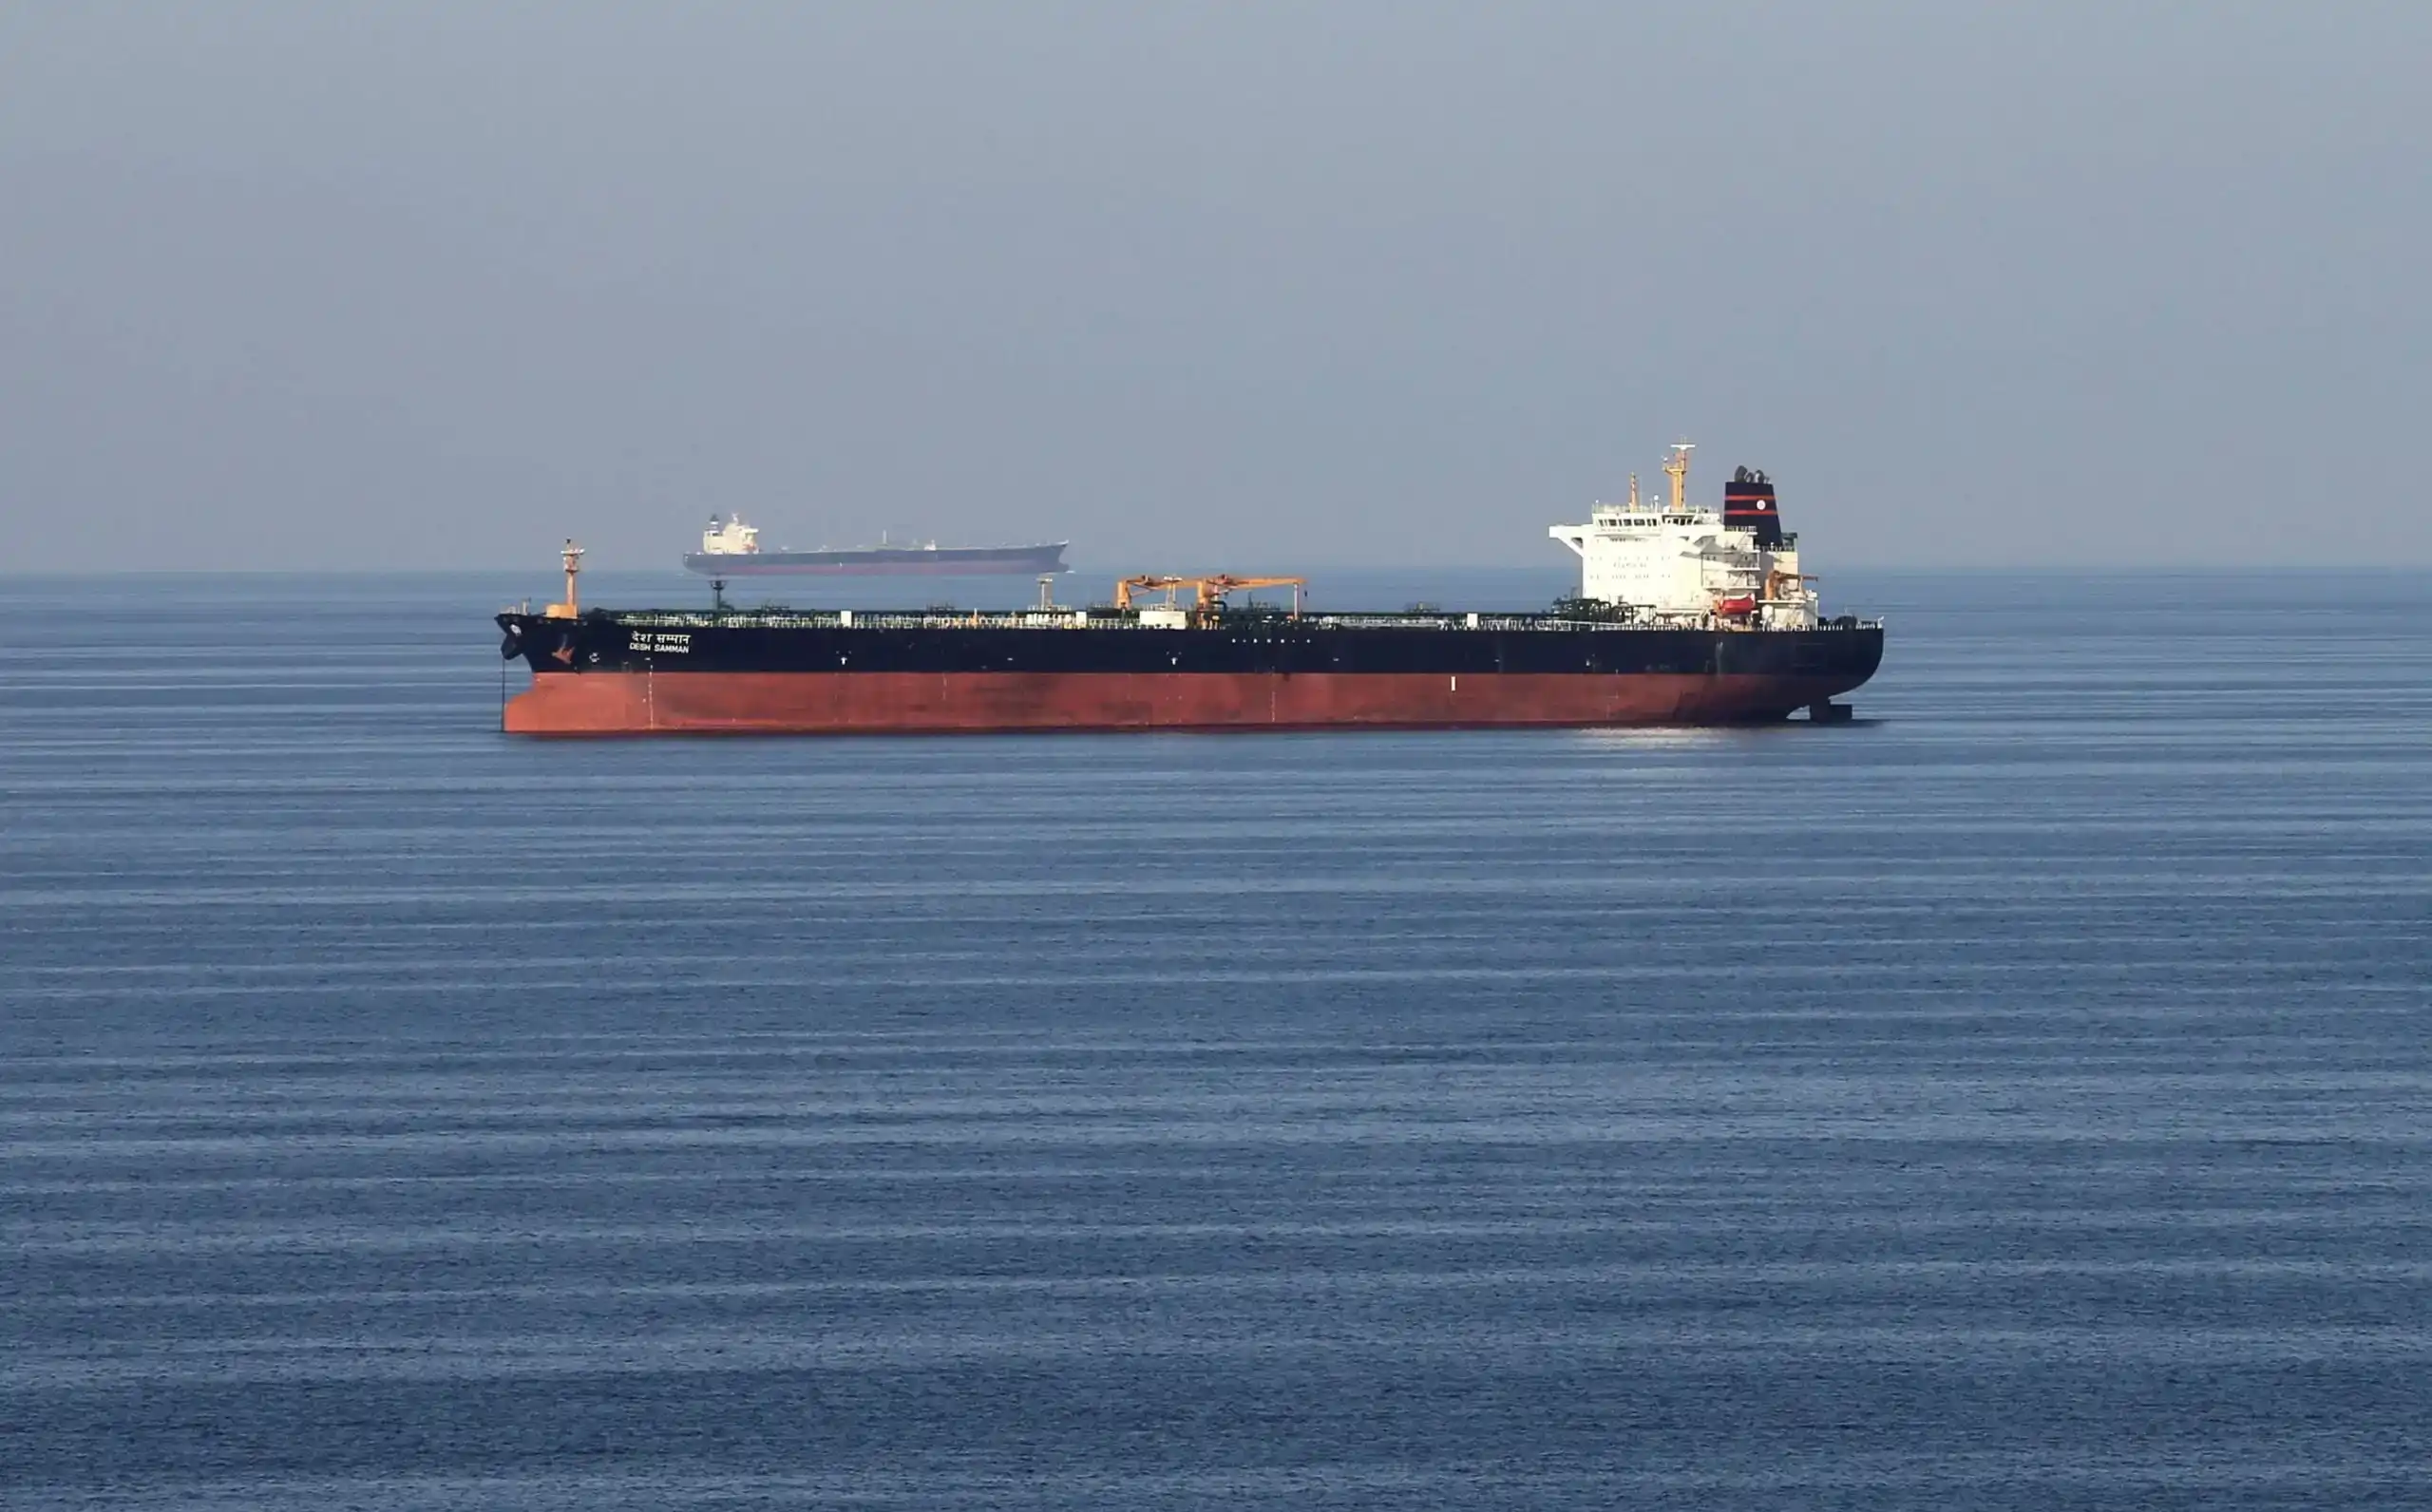
Now the strait has officially entered the reopening process. AP, citing energy experts, assesses that even if the agreement takes effect, it could take months for oil and gas supplies to normalize, as time is needed for vessels, insurance, refineries, mine clearance, and security arrangements. Tankers stranded in the Persian Gulf won't set sail based on a statement alone, and insurers and shipowners won't reset their risk assumptions to pre-war levels overnight.

For us investors, the most important question is: which financial products can we trade now?

What Is the Market Trading After the Strait Reopens?

Over the past few months, crude oil, natural gas, shipping insurance, jet fuel, fertilizers, and inflation expectations have all been layered with a Middle East risk premium. Now, if the agreement is signed as planned on June 19th and ship passage gradually resumes, these assets will be the first affected.

Some price reactions have been extremely swift. MarketWatch reported that following the deal news, Dow futures rose over 350 points, S&P 500 futures gained about 1%, and Nasdaq 100 futures increased roughly 1.6%. WTI fell below $81, with Brent dropping to around $83.5. Axios reported Brent at about $84.21, and U.S. gasoline prices also retreated from around $4.56/gallon in May to about $4.07.

To discuss more specifically, what other assets can we trade?

First, shorting the crude oil risk premium. CBA commodity analyst Vivek Dhar, in a report cited by WSJ, offered a judgment: if the Strait of Hormuz remains open, Brent could fall back to around $80 by year-end. His key assumption is that as long as oil product flows through the strait recover to 60-70% of pre-war levels, combined with non-OPEC+ supply growth and the existence of some alternative pipelines, the market could return to pricing that is relatively supply-loose. What does $80 Brent signify? It means the $15 to $20 premium added over the past three months due to the war will be systematically squeezed out.

Second, going long on airlines, cruise lines, and the travel chain. Lower fuel costs directly improve profit margins; this line is the most straightforward. IATA recently slashed its 2026 global airline industry net profit forecast from $41 billion to $23 billion, citing soaring jet fuel prices. Barron's reported IATA expects total aviation fuel costs to reach $350 billion this year. With oil dropping from the $90-$100 range to the low $80s, airline stocks have the greatest elasticity. Key names to watch include the airline ETF JETS, as well as DAL (Delta Air Lines), UAL (United Airlines), AAL (American Airlines), and LUV (Southwest Airlines). For cruise lines: CCL (Carnival Corporation), RCL (Royal Caribbean Group), NCLH (Norwegian Cruise Line Holdings). As of the close on June 12th, DAL was at $83.06, UAL at $115.52, AAL at $14.98, LUV at $45.47, CCL at $29.18, and NCLH at $19.43. If oil prices remain low ahead of the U.S. market open, airlines and cruise lines are likely the first place pre-market funds will flow.

Third, going long on Asian energy-importing countries. Japan, South Korea, India, China are direct beneficiaries of lower Middle Eastern oil and gas prices. Commerzbank Research, mentioned in a WSJ report, noted Asian currencies generally strengthened in early trading, with USD/JPY falling to about 159.93, USD/KRW to about 1505.60, and AUD rising to about 0.7079. NAB chief economist Sally Auld's view is that falling oil prices ease inflationary pressures for energy importers like Japan, leading to a rise in Japanese 10-year government bond futures. Trades could include going long on Japanese, Korean, or Indian stock indices, or going long on the currencies and bonds of Asian importing nations.

Fourth, going long on bond duration, shorting inflation expectations. Falling oil prices directly lower costs for gasoline, aviation, logistics, and some food items, also reducing market worries about central banks maintaining high interest rates. Watch TLT, the U.S. 10-year Treasury yield, TIPS breakevens, and gold. Gold is special here: if the market believes the strait reopening is real, both gold and oil's safe-haven premiums will recede; if the June 19th signing fails, both will rebound simultaneously. Gold acts as a hedge indicator in this trade, not a directional one.

Fifth, the repricing of the LNG, fertilizer, and chemical chains. Qatari LNG transits the Strait of Hormuz; its reopening will lower the risk premium for LNG in Asia and Europe, benefiting gas-consuming companies, chemical firms, and some power-cost-sensitive industries. The Middle East is also a major supplier of fertilizers like urea and ammonia; resumed navigation means reduced price pressure on agricultural inputs. This line is more macro-chain oriented, favorable for downstream chemical and agricultural cost sides, not necessarily specific stocks.

Polymarket's prediction markets can serve as a "probability thermometer." The "Yes" price for "US-Iran nuclear deal by June 30" is around 0.84, implying an 84% market-assigned probability. "US-Iran nuclear deal before 2027" Yes is about 0.945. "Will the U.S. invade Iran before 2027" Yes is only about 0.115. "Iran Nuke before 2027" is about 0.0735. "Will the Iranian regime fall by June 30" is about 0.0065. These numbers mean: the probability of a near-term deal is high, but longer-term tail risks remain. The market is betting on de-escalation, but not going all-in.

For a U.S. pre-market watchlist, the editor has compiled some:

Tier 1, most direct beneficiaries of lower fuel costs: JETS, DAL, UAL, AAL, LUV, CCL, RCL, NCLH.

Tier 2, beneficiaries of recovering risk appetite, especially small-caps and cyclicals: SPY (S&P 500 ETF), QQQ (Nasdaq-100 ETF), IWM (Russell 2000 small-cap ETF).

Tier 3, companies benefiting from lower costs but with slower elasticity: FDX (FedEx), UPS (United Parcel Service), DOW (Dow Inc.), LYB (LyondellBasell).

Conversely, XOM (Exxon Mobil), CVX (Chevron), SLB, HAL (Halliburton), XLE (Energy Select Sector SPDR Fund)—these upstream energy and oil services stocks are more likely to face near-term pressure. They were beneficiaries of high oil prices and the war premium; as that premium is squeezed out, their investment thesis needs recalculation.

Finally, risks. The biggest fear in this trade isn't "oil prices have already fallen," but "the agreement hasn't truly been implemented." The June 19th signing, maritime mine clearance, falling insurance rates, shipowners resuming passage, the implementation of the Iran-Oman coordination mechanism—these steps need verification one by one. Key signals to track: whether Brent can break below $80, WTI below $78, whether airline and cruise stocks can hold their gains after opening higher, and whether Polymarket's Iran deal contracts stay above 80%.

If these conditions hold simultaneously, it indicates the market is switching from "war shock" to "supply recovery."

If oil prices rebound to $88-$90, or if Polymarket deal probabilities drop rapidly, it's time to reduce exposure on this reopening trade.

Связанные с этим вопросы

QAccording to the article, what are the three types of assets most directly impacted by the removal of Middle East risk premiums after the announcement of the Strait of Hormuz reopening?

AThe three most directly impacted asset types are: 1) Crude oil and natural gas (specifically their risk premiums), 2) Aviation fuel, shipping insurance, and related sectors like airlines and cruise lines, and 3) Inflation expectations, which influence bond markets (like US Treasuries and TIPS).

QWhat are the two primary trade ideas suggested for benefiting from falling oil prices due to the Hormuz reopening?

AThe two primary trade ideas are: 1) Shorting the crude oil risk premium, anticipating a systematic squeeze of the $15-$20 per barrel premium added during the conflict. 2) Going long on airline, cruise line, and tourism-related stocks (e.g., via ETF JETS, or stocks like DAL, UAL, CCL, RCL) as their fuel costs decline and profit margins improve.

QWhich Asian economies are highlighted as direct beneficiaries of cheaper Middle Eastern oil and gas imports?

AThe article highlights Japan, South Korea, India, and China as the primary Asian beneficiaries of cheaper oil and gas imports. It notes their currencies strengthened and their bond markets reacted positively to reduced inflationary pressures.

QWhat role does Polymarket's prediction market data play in the analysis, and what probability does it assign to a US-Iran nuclear deal by June 30?

APolymarket's data serves as a 'probability thermometer' for market sentiment on geopolitical risks. It assigns an 84% probability (Yes price ~0.84) to a US-Iran nuclear deal being reached by June 30, indicating high short-term confidence in the deal but not a complete elimination of long-term tail risks.

QAccording to the article, what are the key signals to watch to confirm the market is transitioning from 'war shock' to 'supply recovery' mode?

AThe key confirming signals are: 1) Brent crude oil price breaking below $80 per barrel and WTI below $78. 2) Airline and cruise stocks maintaining their gains after an initial rally. 3) Polymarket's probability for the Iran deal remaining above 80%. If these occur simultaneously, it signals the transition.

Похожее

How Will the Price Move Before SpaceX's Next Share Unlock?

TL;DR Investors buying SPCX after SpaceX's IPO are not simply investing in a typical tech stock. It’s a high-valuation asset driven by Musk's narrative, Starlink, and space transport potential, but with a key twist: a very small initial float of ~4% has led to significant post-listing price appreciation. The current price action reflects a timing gap. Before the first lock-up expiration (estimated around August, subject to official confirmation), scarcity and high demand could continue to push prices up. Short-term bulls focus on low float, FOMO, and potential index inclusion. However, bears point to the supply dynamics that will change post-lockup. Existing shareholders still hold over 95% of shares, which will be released in stages starting from the first unlock window. This introduces future selling pressure from low-cost holders. The upcoming Q2 earnings report is a critical catalyst before the unlock. It will test whether the company's fundamentals can justify the current ~$2.1T valuation. Strong results could support the pre-unlock momentum, while weak figures could amplify concerns about future supply. The trading thesis is shifting from immediate scarcity ("can't buy enough") to evaluating future absorption capacity ("who will buy when more supply hits"). The path ahead hinges on the specifics of the unlock schedule, Q2 earnings performance, and whether anticipated passive index buying materializes.

marsbit20 мин. назад

How Will the Price Move Before SpaceX's Next Share Unlock?

marsbit20 мин. назад

Bitcoin Short-Term Bullish Structure Validated, HYPE Low-Entry Window Opens | Guest Analysis

**Market Analysis Summary (Week of June 2026)** **Overall Market Context:** The market environment is exceptionally complex, with the unexpected US-Iran agreement and the reopening of the Strait of Hormuz triggering a global asset repricing and significant volatility. This heightened noise underscores the importance of a structured analytical framework. **Bitcoin (BTC) Analysis & Strategy:** * **Current Status:** The price has climbed above $65,000, currently in a rebound phase (segment 38-39) following a complex 12-segment correction from the May high of $82,850. * **Key Levels:** * **Primary Resistance:** $69,500–$70,500. A successful breakout above $65,000 targets this zone. * **Primary Support:** $65,000 (immediate), followed by $59,000–$60,000 and $55,000. * **Weekly Outlook & Strategy:** The focus is on the confirmation of the $65,000 level. * **Bullish Scenario (Hold $65K):** A move toward the $69.5K–$70.5K resistance zone is anticipated, which is a potential area for initiating medium-term short positions. * **Bearish Scenario (Break below $65K):** A retest of the $60,000–$62,000 support range is likely. * **Medium-Term Strategy:** Currently neutral. Plan to establish short positions (up to 60% allocation) either in the $69.5K–$70.5K resistance zone upon signs of rejection, or on a confirmed breakdown below $65,000 and further below $59K–$60K. * **Short-Term Strategy:** Utilize 30% capital for scalping opportunities based on support/resistance levels, using 30/60-minute charts. **HYPE Analysis & Strategy:** * **Current Status:** The price has stabilized around $52 after a four-segment decline from the June high of $75.87 and is now in a rebound (segment 50-51). * **Key Levels:** * **Primary Resistance:** $62.50–$64.57. Watch for potential rejection here to form a lower high. * **Primary Support:** $52–$55.50, followed by $47–$49. * **Weekly Outlook & Strategy:** Adopt a "buy on dips, avoid chasing rallies" approach. * **Core View:** Monitor the price action and potential formation of a lower high ("endpoint 51") in the $62.50–$64.57 resistance zone. * **Short-Term Strategy:** Consider light long positions (max 30% allocation) if the price finds support and shows reversal signals in the $52–$54.50 or deeper $47–$49 support zones, confirmed by proprietary quantitative bottom signals. **Trade Review:** Last week's HYPE short-term long trade, executed based on proprietary "Price Difference" and "Momentum" model signals, yielded a profit of approximately 11.88%. The entry was near $54.39 and exit near $60.85. **Risk Management Reminder:** Always set an initial stop-loss upon entry. Move stop-loss to breakeven at +1% profit, then trail it upwards to lock in gains as the trade progresses. *Disclaimer: All analysis, models, and strategies are based on personal technical analysis for educational purposes only, not investment advice. The market carries inherent risk.*

Odaily星球日报24 мин. назад

Bitcoin Short-Term Bullish Structure Validated, HYPE Low-Entry Window Opens | Guest Analysis

Odaily星球日报24 мин. назад

Bitcoin Short-Term Bullish Structure Validated, HYPE Accumulation Window Opens | Guest Analysis

**Bitcoin and HYPE Market Analysis: Short-Term Outlook and Trading Strategies** This market analysis examines Bitcoin (BTC) and HYPE amid volatile conditions, providing short-term outlooks and specific trading strategies. **Key Outlooks:** * **Bitcoin (BTC):** Focus is on whether BTC's recent move above $65,000 holds. A successful breakout could lead to a test of the $69,500-$70,500 resistance zone, where medium-term short positions are considered. A failure, breaking below $65,000, may trigger a decline towards the $59,000-$60,000 support area. * **HYPE:** The token completed a four-wave correction and is now rebounding. The key resistance zone is $62.5-$64.57. The trading strategy is "buy on dips," looking for entry opportunities near the $52-$54.5 or deeper $47-$49 support zones, pending confirmation from proprietary models. **BTC Trading Strategy:** * **Medium-term:** Primarily looking to establish short positions (up to 60% allocated capital) if price rallies to the $69,500-$70,500 resistance area and shows signs of reversal. Alternative plans involve initiating shorts on a breakdown below $65,000. * **Short-term:** Allocate up to 30% capital for intraday "spread" trades based on support/resistance levels on 30/60-minute charts. **HYPE Trading Strategy:** * **Short-term:** Adopt a dip-buying approach. Consider light long positions (under 30% capital) when price tests key support levels ($52-$54.5 or $47-$49) and shows stabilization, confirmed by proprietary "Price Spread" and "Momentum Quant" models. **Trade Recap:** The analysis reviews a successful HYPE long trade from the previous week, executed at ~$54.39 and closed at ~$60.85 for an ~11.88% gain, based on signals from the aforementioned models. **Risk Management Emphasis:** The article stresses strict capital allocation (under 30-60%), immediate initial stop-loss placement, and a trailing stop-loss protocol to lock in profits as trades move favorably. ***Disclaimer:** All analysis, models, and strategies are for educational purposes based on technical analysis, not investment advice. Markets are volatile; trade with caution.*

marsbit27 мин. назад

Bitcoin Short-Term Bullish Structure Validated, HYPE Accumulation Window Opens | Guest Analysis

marsbit27 мин. назад

Торговля

Спот
Фьючерсы
活动图片