Expanding Cost Basis Distribution (CBD) Coverage: ETH, ERC20, and SPL Now Included

insights.glassnodeОпубликовано 2025-02-23Обновлено 2025-03-03

In our ongoing mission to push the boundaries of on‑chain analytics, we are excited to announce the expansion of Cost Basis Distribution (CBD) coverage beyond Bitcoin – now incorporating Ethereum (ETH), ERC‑20 tokens, and SPL tokens.

This marks a significant leap in visibility over how investors position themselves across multiple asset classes – shedding light on market conviction, capitulation, and the evolving cost basis of investors.

Below, we revisit what CBD is, why it is such a powerful analytical framework, and how these newly released datasets can deepen your understanding of on‑chain dynamics for a variety of assets.

Recap: What is the Cost Basis Distribution (CBD)?

Cost Basis Distribution maps out at what price levels the current supply of a given asset was last transacted on‑chain. In simpler terms, it shows how many tokens (the supply) changed hands at each price point throughout history, overlaying that information with the current market price.

  • Investor Positioning and Market Structure: CBD captures investor behavior, revealing how many coins have a ‘cost basis’ around each price level. By doing so, it provides a transparent view of where key support/resistance clusters might form.
  • Confidence and Capitulation: CBD can help identify when investors are accumulating coins on the way up (increasing cost basis), or averaging down when prices slide (decreasing cost basis). Such patterns can highlight confidence (buying despite lower prices) or capitulation (when we see drastic changes in supply at certain price level).
💡
Our Heatmap Dashboard now provides in-depth insights across hundreds of tokens. Access it here.

Reading the CBD Heatmaps

The CBD Heatmaps are your key to understanding where and when investors are positioned in the market. Here's how to understand the data:

  • Color Intensity (Supply Distribution): The color scale – from cooler shades (lower supply) to warmer shades (higher supply) – shows where the token supply is concentrated. A red “band” signals high supply at that particular price range. A green or blue band indicates lesser supply.
  • Vertical Axis (Cost Basis): Each “horizontal slice” corresponds to a price range at which some portion of the token supply last moved.

Example below: In October 2024, there was a significant accumulation of Bitcoin between $60K and $65K, represented by deep orange shades indicating a high supply concentration. As the price began rising in November, these shades gradually shifted from orange to yellow and then to green, signaling that investors who purchased at $65K were taking profits and distributing their holdings as the price moved upward.
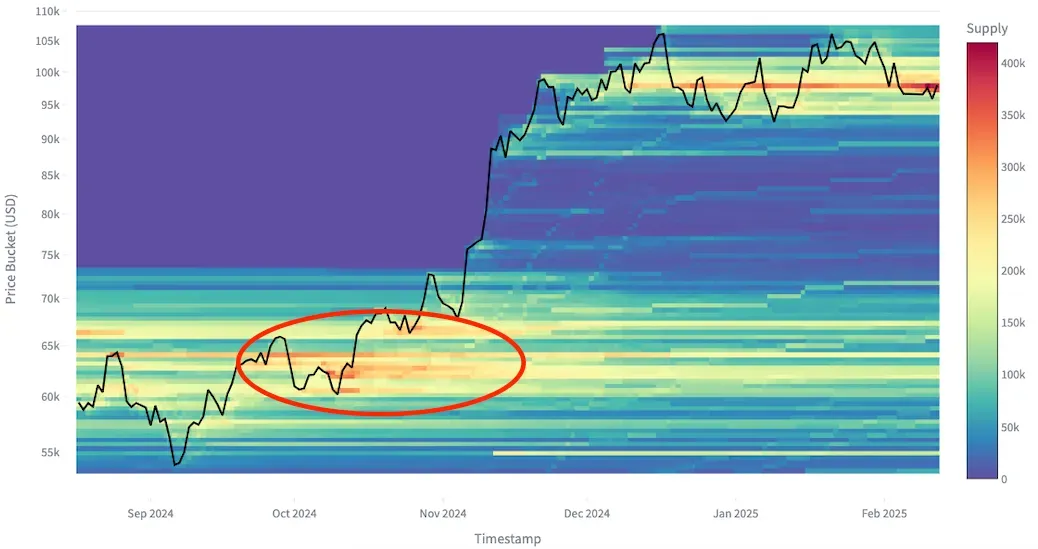
Fading color intensity showing distribution from investors bought at $65K
  • Cost Basis Lines: Cost basis lines represent how much, on average, investors have paid for their holdings over time. When these “stair-step” lines move up, it generally indicates that market participants are buying an asset as prices rise, thereby increasing their average cost basis. This often signals strong conviction or a belief that the asset is not yet overpriced - investors are willing to keep accumulating despite higher prices. See the Bitcoin example below:
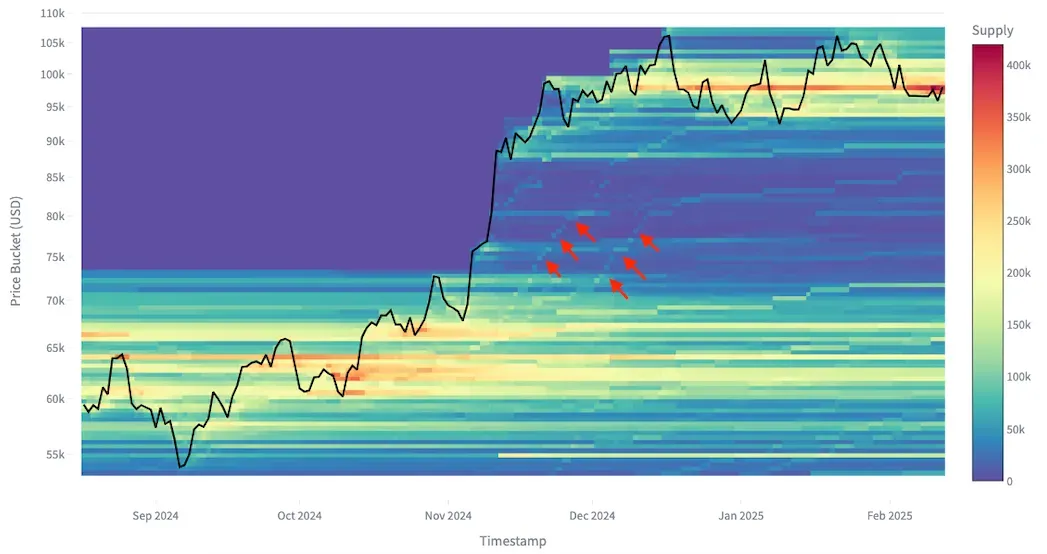
The cost basis lines moving up show investor conviction

Conversely, when the lines move down, it means that investors are buying while prices decline, effectively lowering their average purchase price. This behavior can reflect a “buy-the-dip” or DCA mindset: market participants see value in adding to their positions even as the market moves lower, suggesting they believe the asset remains fundamentally strong or undervalued. See the example below with Maker:

Cost basis trending down over time suggests investors buying the dip

Why This Framework Matters and How to Use It

Cost basis behavior offers a window into the collective mindset of investors, showing how they adjust and reaffirm their convictions as the market moves. Tracking these upward and downward shifts helps us understand not only the sentiment behind buying and selling decisions, but also potential inflection points, where the market might pivot.

Here are specific use cases that make this framework a powerful and versatile tool in an investor's toolkit - now applicable across assets at different points on the risk spectrum.

Gauging Investor Sentiment

Changes in cost basis help illustrate broader market psychology. A rising cost basis during a rally often signals optimism; if investors continue buying despite higher prices, it underscores confidence in the asset.

Assessing Conviction

When you see investors continuously lowering their cost basis on a declining price trend, it suggests a high level of conviction; they are willing to commit additional capital despite short-term negative price action. Conversely, if cost basis stays flat or does not increase significantly during a price uptrend, it can indicate a more cautious stance from the market.

Risk Management

For traders and analysts, monitoring cost basis can help gauge where the bulk of the market sits in terms of unrealized gains or losses. Knowing whether most investors are “in profit” or “underwater” can inform decisions about potential selling pressure or accumulation points.

Access the Data via API

We’ve made these expanded datasets easily available through the Glassnode API, allowing you to integrate Cost Basis Distribution directly into your own research platforms and dashboards. Whether you prefer Python, R, or building a web application, direct API access ensures data timeliness and flexibility.

Stay Tuned for More CBD Updates!

In the next article, we will showcase practical examples of metrics built directly from the raw CBD data. You’ll see how to craft visualizations and create proprietary indicators that speak to your specific trading or investment thesis.

Похожее

Huawei's "Tao Law": A Comprehensive Overview of Core Companies

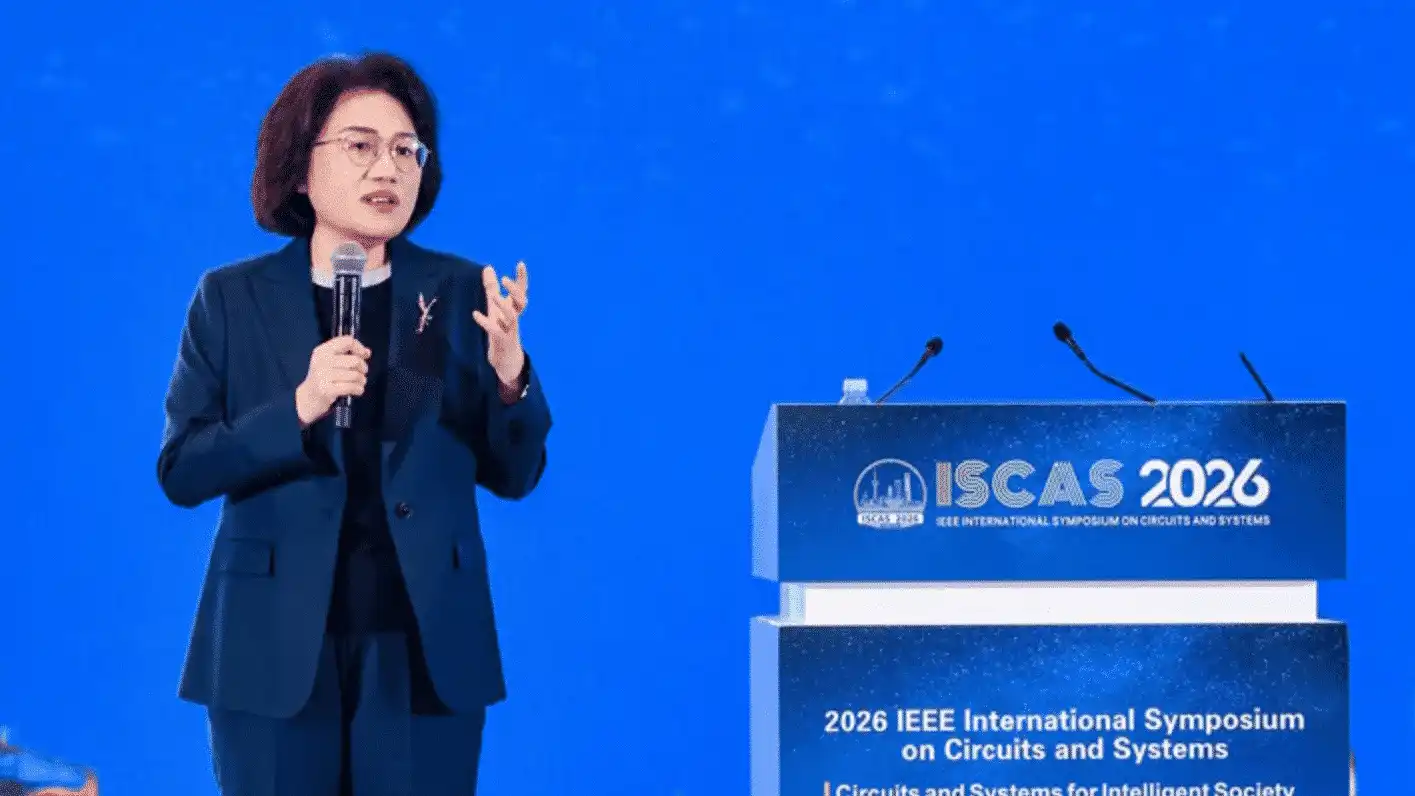
Huawei's "Tau Law": Core Companies Overview On May 25, 2026, Huawei's Director and President of the Semiconductor Business Division, He Tingbo, formally introduced the "Tau (τ) Law" at ISCAS 2026, marking a significant principle guiding industry development in the global semiconductor field from China. The Tau Law shifts focus from traditional Moore's Law, which pursues geometric transistor scaling, to "time scaling"—continuously compressing signal propagation delay (time constant τ) without solely relying on extreme feature size reduction. The core implementation path is "logic folding." This technique transforms circuit layouts from two-dimensional planes to multi-layer 3D stacks, using short vertical interconnects to replace long horizontal wiring, thereby drastically reducing τ. Huawei has already designed and mass-produced 381 chips following this principle over the past six years, with plans to launch a Kirin chip utilizing logic folding in Fall 2026. By 2031, high-end chips based on the Tau Law are expected to achieve performance levels equivalent to a 1.4nm process node. This development impacts several key industry segments, with related Chinese companies poised to benefit: 1. **EDA Design Software**: Essential for circuit-level optimization. Key players include: * **Empyrean Technology** (Huada Jiutian): China's largest full-flow EDA provider. * **Primarius Technologies** (Gailun Dianzi): Specializes in device modeling and verification. * **Semitronix** (Guangliwei): Focuses on yield enhancement and test chip EDA. 2. **Chiplet & Advanced Packaging**: Logic folding's 3D stacking necessitates advanced packaging (e.g., TSV, hybrid bonding). Core participants are: * **Tongfu Microelectronics**: A leader in advanced packaging and a key partner for AMD's Chiplet products. * **JCET Group** (Changdian Keji) & **Tianshui Huatian Technology**: Major OSATs with advanced packaging capabilities. * **VeriSilicon** (Xinyuan Gufen): Provides Chiplet-based design platforms and IP. 3. **Foundry Manufacturing**: Optimization must be implemented in transistor structures and process parameters. Potential foundries for Huawei's future chips include: * **SMIC**: China's leading foundry with advanced FinFET capabilities, the most likely candidate for next-gen Kirin chips. * **Hua Hong Semiconductor** (Huahong Gongsi): A leader in specialty processes (power, embedded memory). * **Nexchip Semiconductor** (Jinghe Jicheng): Major foundry for display driver ICs and MCUs. The Tau Law represents a strategic move towards architectural innovation and design-process co-optimization, driving demand across the domestic semiconductor supply chain.

marsbit36 мин. назад

Huawei's "Tao Law": A Comprehensive Overview of Core Companies

marsbit36 мин. назад

TechFlow Intelligence Report: Huawei Unveils "Tao" Law, Semiconductor Sector Surges; Meta Cuts 10% of Workforce

"TechFlow Intelligence Brief": Huawei's new "Tau Law" in semiconductors and Meta's 10% layoffs headline today's tech landscape. In AI, breakthroughs include an AI solving 9 high-difficulty pure math problems for just a few hundred dollars each, and DeepSeek's new Reasonix programming agent challenging commercial models. However, research highlights a "constraint decay" issue in LLM-generated backend code. Open-source model Qwen 3.6 27B achieves high speeds on older GPUs, sparking debate on NVIDIA's future dominance. In Crypto/Web3, Ethereum Foundation plans to downsize, possibly reducing ETH selling pressure. Fake news about CZ ignited a meme coin frenzy, showing the market's sensitivity to celebrity narratives. DeFi sees a new trend in HELOC-backed Real World Asset (RWA) pools. The chip sector is stirred by Huawei's proposed "Tau (τ) Law," aiming for 1.4nm-equivalent performance by 2031 through architectural innovation, causing related stocks to surge. A report notes memory now constitutes nearly two-thirds of AI chip cost. Meanwhile, executives at 7 Chinese semiconductor firms sold shares after price peaks. Meta announces 10% layoffs as it pivots to AI. Google's CEO faced student protests over AI ethics during a speech, and the company controversially published a Chromium exploit before patching was complete. Xiaomi permanently banned installers for AC installation fraud. In US stocks, AMD is seen as a potential challenger to NVIDIA, while a survey reveals 99% of CEOs expect AI-driven layoffs within two years. Palantir secured a government contract for employee monitoring, raising privacy concerns. Macro developments include a 6% drop in WTI crude oil on hopes for reopened Hormuz Strait, and silver prices rising over 4%. Global oil inventories are nearing critical lows. New trends highlight a "audio prompt injection" attack targeting AI voice assistants via hidden commands, and CBS pausing takedowns of pirated Stephen Colbert episodes after public pushback. The underlying narrative connects AI's cost-effective problem-solving, widespread planned job displacement, and Huawei's challenge to Western tech hegemony, framing the AI and chip race as a broader contest over employment, geopolitics, and the very definition of intelligence.

marsbit1 ч. назад

TechFlow Intelligence Report: Huawei Unveils "Tao" Law, Semiconductor Sector Surges; Meta Cuts 10% of Workforce

marsbit1 ч. назад

Торговля

Спот
Фьючерсы

Популярные статьи

Manyu: восходящая мем-звезда на Ethereum, готовая открыть новую эру культуры Shiba

Manyu - это мемтокен на Ethereum, который приносит децентрализованную культурную и развлекательную ценность через вирусное влияние в соцсетях и вовлечённость сообщества.

1.9k просмотров всегоОпубликовано 2025.11.27Обновлено 2025.11.27

Manyu: восходящая мем-звезда на Ethereum, готовая открыть новую эру культуры Shiba

Неделя обучения по популярным токенам 14: Glamsterdam — самое ожидаемое обновление Ethereum в 2026 году

Ordinals/Runes по-прежнему стимулируют доходы от комиссий за блоки и активность разработчиков, рассматриваются как отправная точка «нативной эмиссии активов» в сети.

1.4k просмотров всегоОпубликовано 2026.04.29Обновлено 2026.04.29

Неделя обучения по популярным токенам 14: Glamsterdam — самое ожидаемое обновление Ethereum в 2026 году

Обсуждения

Добро пожаловать в Сообщество HTX. Здесь вы сможете быть в курсе последних новостей о развитии платформы и получить доступ к профессиональной аналитической информации о рынке. Мнения пользователей о цене на ETH (ETH) представлены ниже.

活动图片