Range Judgment Realized, Strategy Fully Executed | Guest Analysis

marsbitPublished on 2026-01-09Last updated on 2026-01-09

Abstract

In his weekly analysis, Cody Feng, a quantitative trading expert, reviews Bitcoin's price action from January 5 to 11. BTC movement aligned closely with his initial forecast, trading within a range of $84,000 to $94,500. The price faced strong resistance at the $93,000–$94,500 zone and later pulled back toward the mid-to-lower part of the range. A short position was executed near $94,000 based on signals from momentum and spread trading models, and the trade was closed around $90,584, capturing a profit of approximately 3.4%. The strategy emphasized pre-planned execution and disciplined risk management. Currently, Bitcoin has found support around $86,500, with technical indicators suggesting oversold conditions and a potential bounce. However, the overall structure remains a broad consolidation. A rebound toward $92,000–$93,000 is anticipated, where renewed selling pressure may emerge. A break above $94,500 would require a reassessment of the market outlook. Feng concludes that in a ranging market, executing well-defined strategies with strict risk controls is more critical than predicting directional moves.

Odaily guest market analyst Cody Feng, Master of Financial Statistics from Columbia University, has focused on quantitative trading of US stocks since college and gradually expanded to digital assets such as Bitcoin. He has built a systematic quantitative trading model and risk control system through practical experience; possesses keen data insight into market fluctuations, and is committed to continuous growth in the professional trading field, pursuing stable returns. He will delve into BTC technical, macroeconomic, and capital flow changes weekly, review and showcase practical strategies, and preview noteworthy upcoming developments for reference.

Bitcoin Mid-Week Review(01.05~01.11)

Conclusion First:

This week, Bitcoin's overall price action largely operated within the 84,000~94,500 USD oscillation range we provided at the beginning of the week. The price precisely encountered resistance in the 93,000~94,500 USD pressure zone and subsequently fell back to the middle-lower part of the range. Our core level judgments were verified by actual market performance.

In this trade, we established short positions near 94,000 USD and exited all positions near 91,000 USD, capturing approximately 3.4% profit (spot) from the range, completing a high-probability, low-drawdown profit realization in a ranging market.

I. Validation of This Week's Core Range and Key Levels

At the beginning of the week, we clearly stated that this week required close attention to the battle between bulls and bears at the upper and lower boundaries of the 84,000~94,500 USD range.

The actual movement showed that Bitcoin clearly met resistance after rebounding to the 93,000~94,500 USD pressure zone, with multiple failed attempts to break higher, subsequently leading to a pullback under pressure, validating the effectiveness of this area as a阶段性 "ceiling".

Regarding support levels, the price showed clear signs of stopping declines and stabilizing after falling to the 86,000~86,500 USD area, where buying interest began to emerge. The more critical support level at 84,000 USD has not been touched yet, and the overall structure remains within the wide-range oscillation framework.

II. Execution of Plan A (From Entry to Exit)

Based on the range oscillation judgment, our Plan A formulated at the start of the week was effectively executed.

When the price rebounded to the 93,000~94,500 USD zone showing signs of upward exhaustion, and both the (momentum, spread trading) models simultaneously issued top signals, we immediately established short positions at 93,771 USD. The market subsequently declined as expected.

When the "Spread Trading" model issued a bottom signal, we finally exited all positions at 90,584 USD, completing a full, emotion-free short trade. The entire trading process was not "hindsight analysis" but involved pre-planning, in-execution, and post-verification.

III. Operational Thoughts for the Latter Half of the Week

Bitcoin 4-Hour Chart: (Momentum Quantitative Model + Spread Trading Model)

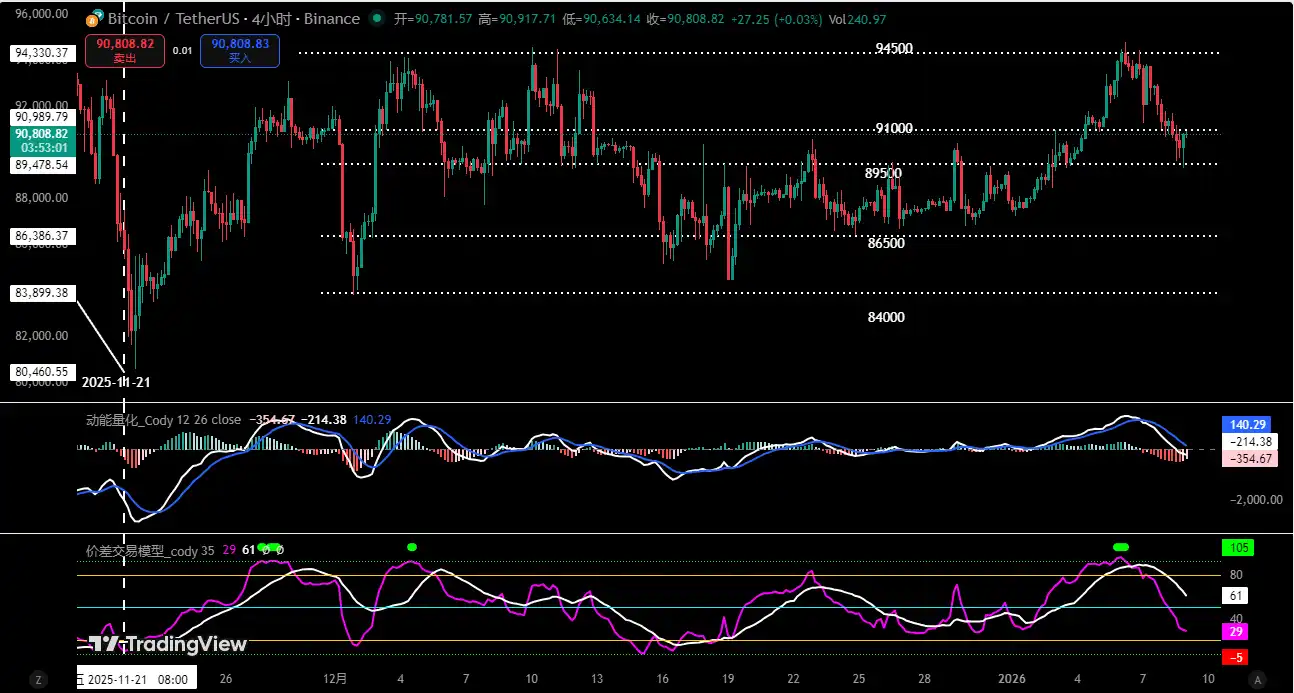
From the 4-hour technical structure (see chart above), Bitcoin has currently found effective support near 86,500 USD. Multiple technical indicators have entered oversold territory, indicating short-term selling pressure has been released. The market has a demand for a technical rebound correction (oscillatory rebound), but this is not yet sufficient to confirm a reversal of the downtrend.

Based on this, we anticipate the price may first rebound to test the 92,000~93,000 USD area. This level also coincides with the middle-upper part of the previous oscillation range and is expected to form resistance again.

For short-term operations, maintain a range-trading mindset: if the price reaches this zone and shows signs of momentum exhaustion or failed breakouts, consider building short positions on rallies; if it effectively breaks above 94,500 USD, stop loss decisively and reassess the market structure.

IV. Summary

Overall, Bitcoin continues to operate within the wide-range oscillation pattern defined at the beginning of the week: lower support provides room for rebounds, while upper resistance limits the upside. At present, rather than betting on a unilateral trend, it is more important to respect the range structure, focus on high-probability levels, and maintain strict risk control.

In ranging markets, formulating flexible response strategies and achieving stable profits is far more important than predicting direction.

Disclaimer: The above content is solely personal market opinion sharing and does not constitute any investment advice. Cryptocurrencies are highly volatile; please make independent judgments and strictly control risks.

Related Questions

QWhat was the price range for Bitcoin's consolidation as predicted by analyst Cody Feng at the beginning of the week?

AThe predicted consolidation range for Bitcoin was between $84,000 and $94,500.

QAt what price level did the analyst establish a short position and what was the profit from this trade?

AA short position was established near $94,000 and closed near $91,000, capturing a profit of approximately 3.4%.

QWhat are the two technical models mentioned that provided signals for the trade execution?

AThe two technical models mentioned are the Momentum Quant Model and the Spread Trading Model.

QAccording to the 4-hour chart analysis, what is the expected next move for Bitcoin's price and the key resistance area to watch?

AA technical rebound or震荡反弹 (oscillatory rebound) is expected to test the $92,000 to $93,000 area.

QWhat is the overarching trading philosophy emphasized for the current market conditions described in the article?

AThe philosophy is to focus on high-probability price points and strict risk control within the range-bound structure, rather than betting on a one-directional trend, as formulating flexible strategies for stable profits is more important than predicting direction.

Related Reads

GitHub, Transfixed by AI

On the night of February 9th, GitHub suffered a major outage caused by a simple configuration change—reducing a cache refresh interval from 12 to 2 hours—that triggered a cascade of failures. This was not an isolated event, but part of a broader pattern. In early 2026, GitHub experienced at least 8 major incidents, failing to meet its promised 99.9% availability. These outages stemmed from structural issues: explosive growth in load, tight service coupling, and insufficient protection against abnormal traffic. This unprecedented load is driven by AI Agents. In 2025, GitHub handled ~1 billion commits. By 2026, weekly commits reached 275 million, projecting to ~14 billion for the year—a 14x increase. AI tools like Claude Code now contribute 4.5% of all public repository commits, with weekly submissions surging 25x in just three months. AI-generated pull requests jumped from 4 million to 17 million per month in half a year. Unlike human developers, AI Agents work continuously, generating commits at a scale that overwhelms infrastructure designed for human rhythms. The surge also shattered GitHub's business model. Copilot's flat-rate pricing, based on assisting human developers, became unsustainable as Agentic AI sessions consumed resources worth hundreds of dollars for a few dollars in fees. In response, GitHub imposed usage limits and, by June 1st, shifted to a pay-per-use "AI Credits" system. Facing this new reality, GitHub realized a 10x scaling plan was insufficient. It announced a need to *redesign* its architecture for 30x current scale—decoupling services, adding fault isolation, and improving change management to prevent cascading failures. Other platforms like Stripe and AWS are facing similar challenges with AI Agents. Fundamentally, GitHub is transitioning from a human collaboration platform to an "exhaust pipe" for automated AI workflows. Its detailed post-mortem reports aim to maintain trust during this turbulent rebuild. The February outage was not just a technical glitch, but a signal of the software industry's entry into a new, AI-driven era.

marsbit25m ago

GitHub, Transfixed by AI

marsbit25m ago

Both Suffer Massive Losses Exceeding $90 Billion, Which Is in Greater Peril: Strategy or Bitmine?

Facing massive paper losses exceeding $90 billion each amidst a sharp market downturn, "Digital Asset Treasury" (DAT) giants Strategy and Bitmine find themselves in a precarious position, but with different underlying risks. Strategy, heavily invested in Bitcoin (BTC), faces significant financial strain. Its strategy relies heavily on debt, including convertible notes and preferred stock (STRC) requiring substantial dividend payments. With its cash reserves dwindling and BTC offering no staking yield for cash flow, Strategy's high leverage makes it vulnerable. A continued price decline could force asset sales to meet obligations, potentially creating a negative feedback loop. Its market value has already fallen sharply. In contrast, Bitmine, an Ethereum (ETH) holder, appears on firmer financial ground. It primarily funds its purchases through equity offerings (like ATM programs), avoiding debt pressure. It also generates income by staking a large portion of its ETH holdings. While not immune to market drops and shareholder dilution concerns, Bitmine maintains more flexibility, recently announcing a new preferred share offering to raise further capital. The core divergence lies in their financing: Bitmine uses equity (investor money), while Strategy uses debt (borrowed money). Consequently, Bitmine currently faces less immediate liquidity pressure than Strategy, which must navigate the dual challenge of servicing debt/dividends and a declining core asset (BTC) price.

marsbit32m ago

Both Suffer Massive Losses Exceeding $90 Billion, Which Is in Greater Peril: Strategy or Bitmine?

marsbit32m ago

Trading

Spot
Futures
活动图片