在上周的周报结束没多久后,比特币一度下跌至 6 万美元附近,不少小伙伴给我发来私信,表达了对比特币的未来走势感到担心。对于此前在 8 万美元或更早一带布局的投资者而言,账面回撤带来的压力不言而喻,这种情绪我完全能够理解——我们都曾在不同周期中,或多或少经历过相似的时刻。焦虑、无助甚至选择放弃。
但恰恰是在这种阶段,情绪比方向更容易成为风险来源。与其被短期波动牵着走,不如先稳住心态、重新审视仓位与节奏。因为接下来,市场并不排除出现阶段性反弹的可能,而这类波动本身,也往往为投资者提供了主动调整的窗口:通过分步降低风险敞口,或者借助更灵活、快速的波段操作,逐步摊薄成本、缓解压力,以更从容的姿态应对接下来的不确定性。
希望我的文章可以在大家感到困惑和迷茫的时候提供一些新的思路:

交易周报核心摘要:
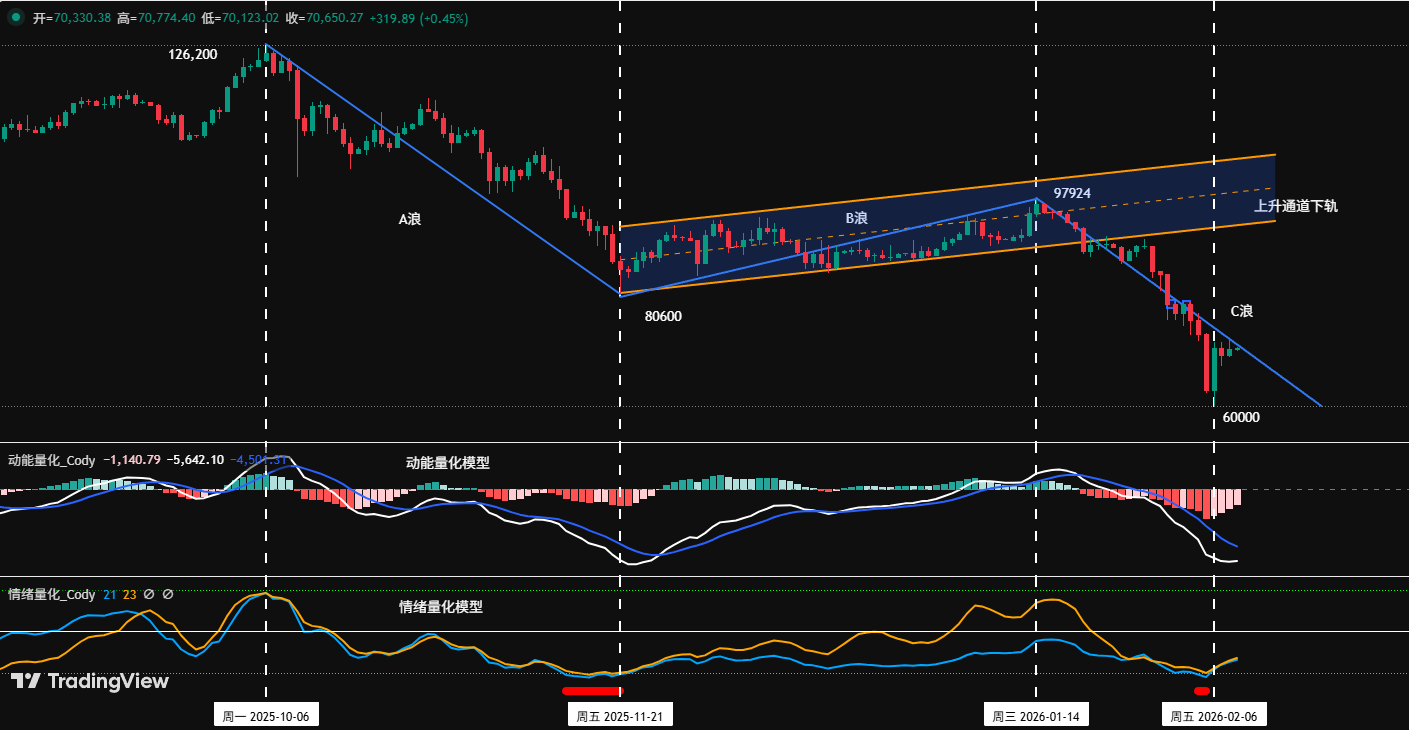
• 比特币自 1 月 14 日引发的下跌 C 浪内部结构划分推演。(详解见图一)
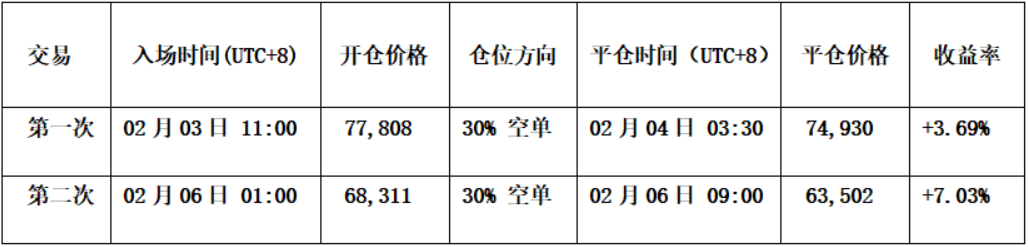
• 策略执行(短期)成效验证:上周交易遵循既定短线策略执行,完成二次短线操作(1 倍杠杆),成功实现累计收益约 10.72%。
• 策略执行(中期)成效验证:上周遵循既定中线策略,继续持有于 89,000 美元(1 倍杠杆)建仓的空单,截止上周收盘盈利约 20.97%,期间最大盈利约 32.58%。
• 核心观点(短期)验证:上周,在周线及日线熊市共振的格局下,币价连续跌穿多个支撑位,最终于 60,000 美元附近获得支撑。市场走势符合我们之前对 C 浪调整预期。
下文将详细回顾行情预判、策略执行与具体交易过程。
一、比特币调整结构剖析及 C 浪未来走势结构推演
比特币日 K 线图:
图一
1、主结构分析:
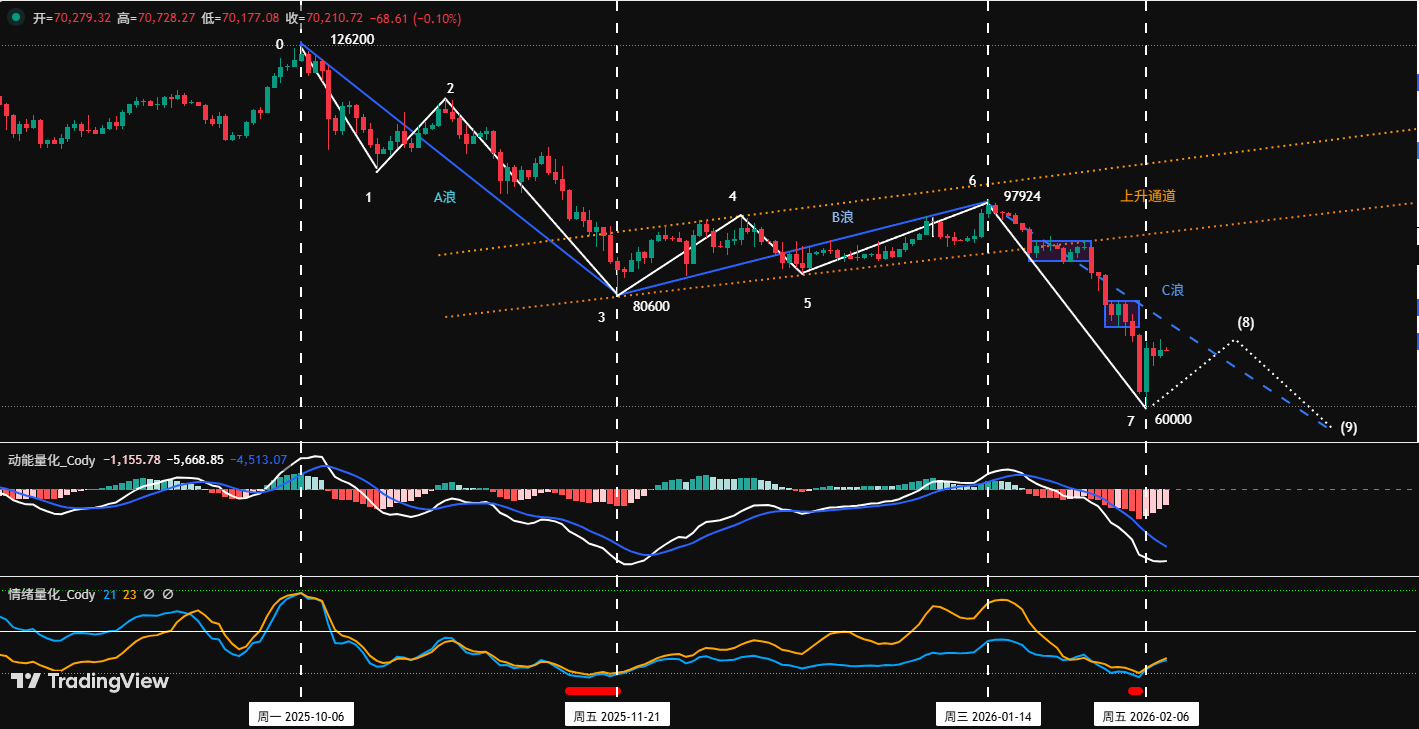
目前来看,自 2025 年 10 月高点 12,6200 美元开始的本轮调整呈现A-B-C 三浪结构:
• A 浪(驱动下跌浪):126,200 美元(2025-10-06)至 80,600 美元(2025-11-21),历时 46 天,最大跌幅达 36%。
• B 浪(反弹修正浪):80,600 美元(2025-11-21)至 97,924 美元(2026-01-14),历时 54 天,最大涨幅 21.5%。
• C 浪(主跌浪):97,924 美元(1 月 14 日)至今,历时 25 天,最大跌幅 38.7%。
2、次结构分析:推动浪与调整浪的精细剖析
1、A 浪内部可分解为 3 段式结构,即 0-1 段,1-2 段,2-3 段:
• 0-1 段:126,200 美元(2025-10-06)至 103,528 美元(2025-10-17),历时 11 天。
• 1-2 段:103,528 美元(2025-10-17)至 116,400 美元(2025-10-27),历时 10 天。
• 2-3 段:116,400 美元(2025-11-21)至 80,600 美元(2025-11-21),历时 25 天。
2、B 浪内部可分解为 3 段式结构。即 3-4 段,4-5 段,5-6 段:
• 3-4 段:80,600 美元(2025-11-21)至 94,589 美元(2025-12-09),历时 18 天。
• 4-5 段:94,589 美元(2025-12-09)至 84,450 美元(2025-12-18),历时 9 天。
• 5-6 段:84,450 美元(2025-12-18)至 97,924 美元(2026-01-14),历时 17 天。
3、C 浪内部走势结构推演,分为以下三种形式:
第一种走势结构推演(概率极大):C 浪内部呈现 3 段式结构
• 6-7 段(首轮驱动下跌),目标已完成:97,924 美元(2026-01-14)至 60,000 美元(2026-02-06),历时 23 天,最大跌幅 38.7%。(根据调整时间及跌幅判断,60,000 美元是 C 浪内部第一段调整低点的概率大)
• 7-8 段(预期反弹):图中虚线部分,即将或已开始的反弹段。反弹高度难以超越 97,924 美元(即 B 浪顶点),其关键阻力区可关注 72,000-74,500 美元及更上方的 80,000-80,600 美元区域。
• 8-9 段(最终下跌段):图中虚线部分,将启动最后一跌,其理论目标区间可通过测量 A 浪幅度进行投射,未来 60,000 美元将被跌穿,币价将会测试更低的技术支撑位。
第二种走势结构推演(概率小):C 浪内部呈 5 段式或更复杂结构
此情景建立在第一种 3 段式完成后,市场仍未出现明确的底部反转信号之上,需要依据当时调整力度及走势结构类型再做判断。它意味着调整时间将大幅延长,后续可能演变成“下降楔形”或“多重三浪”等复杂结构。这种路径通常由宏观面持续恶化或市场流动性枯竭引发,在当前环境下发生概率相对较小,但不可完全排除。
第三种走势结构推演(概率极小):V 型反转,调整已结束,反转开启
• 67 段(首轮驱动下跌),目标已完成:97,450 美元(2026-01-14)至 60,000 美元(2026-02-06)。
• 78 段(V 型反转):图中虚线部分。 反弹异常强劲,不仅能有效突破 97,924 美元的前高,并能持续站稳其上,同时金融市场将出现重大利好消息配合。若此情况发生,则意味着自 126,200 美元开始的整个 A-B-C 三浪调整可能已经以“简化形态”结束于 60,000 美元。尽管概率极低,但其触发条件(强势突破 97,924 美元)清晰可辨,可作为趋势逆转的关键观察信号。
综上所述,上面三种走势仅为基于市场行为逻辑的推演,并非必然路径。无论行情如何演化,都应谨记:“市场永远是对的”之原则。
二、比特币上周操作策略及关键点位回顾:(02.02~02.08)
1、短线操作策略回顾:如(图二)所示
我们严格依据自主构建的价差交易模型与动能量化模型发出的交易信号,并结合对市场走势的预判,完成二次短线操作,交易累计盈利10.72%。
具体交易明细与复盘如下:
1、短线交易成果展示:(杠杆*1 倍)
图二
2、短线交易复盘:
• 第一次交易(盈利 3.69%):
• 开仓:反抽80,000 美元压力遇阻叠加两个模型沽空共振信号,于77,808 美元建立 30%空头仓位。
• 风控:空单初始止损位81,000 美元。
• 平仓:跌至 74,500 美元支撑位附近叠加价差模型底部信号(红点)及 K 线组合见底信号,与74,930 美元全部清仓。
• 第二次交易(盈利 7.03%):
• 开仓:反抽69,000 美元压力遇阻叠加两个模型沽空共振信号,于68,311 美元建立 30%空头仓位。
• 风控:空单初始止损位71,000美元。
• 平仓:跌至 63,000 美元支撑位附近叠加两个模型底部共振信号,于63,502 美元全部清仓。
比特币 30 分钟 K 线图:(动能量化模型+价差交易模型)
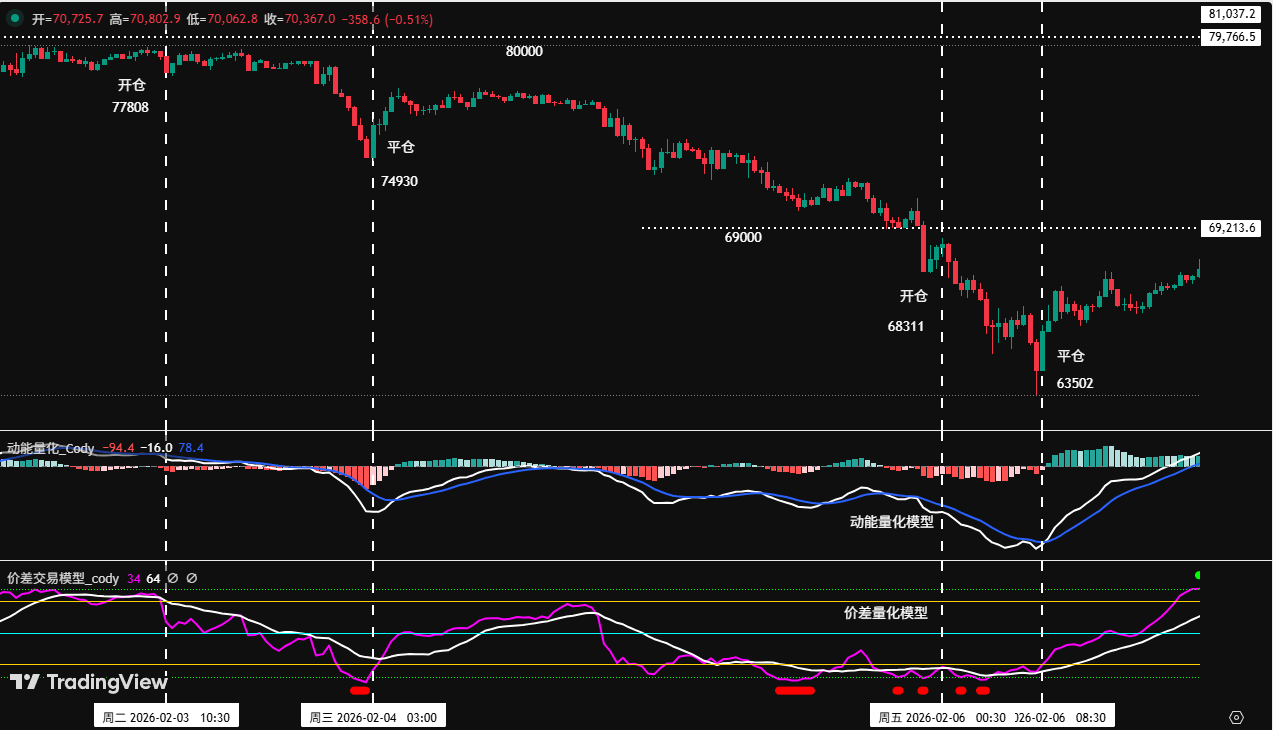
图三
2、 中线操作策略回顾:
中线策略:按照计划继续持有于89,000 美元附近建仓的60%空单。
3、 上周核心点位回顾:
压力位看80,000~80,600 美元区域;
第一支撑位看72,000-74,500 美元,第二支撑位看69,000-72,500 美元区域。
三、比特币本周走势技术指标分析:(02.09~02.15)
结合市场运行,笔者依据自主构建的交易体系,从多模型与多维度等层面,对比特币走势结构进行深度剖析。
1、如(图四)所示,从周线图分析:
比特币周 K 线图:(动能量化模型+情绪量化模型)
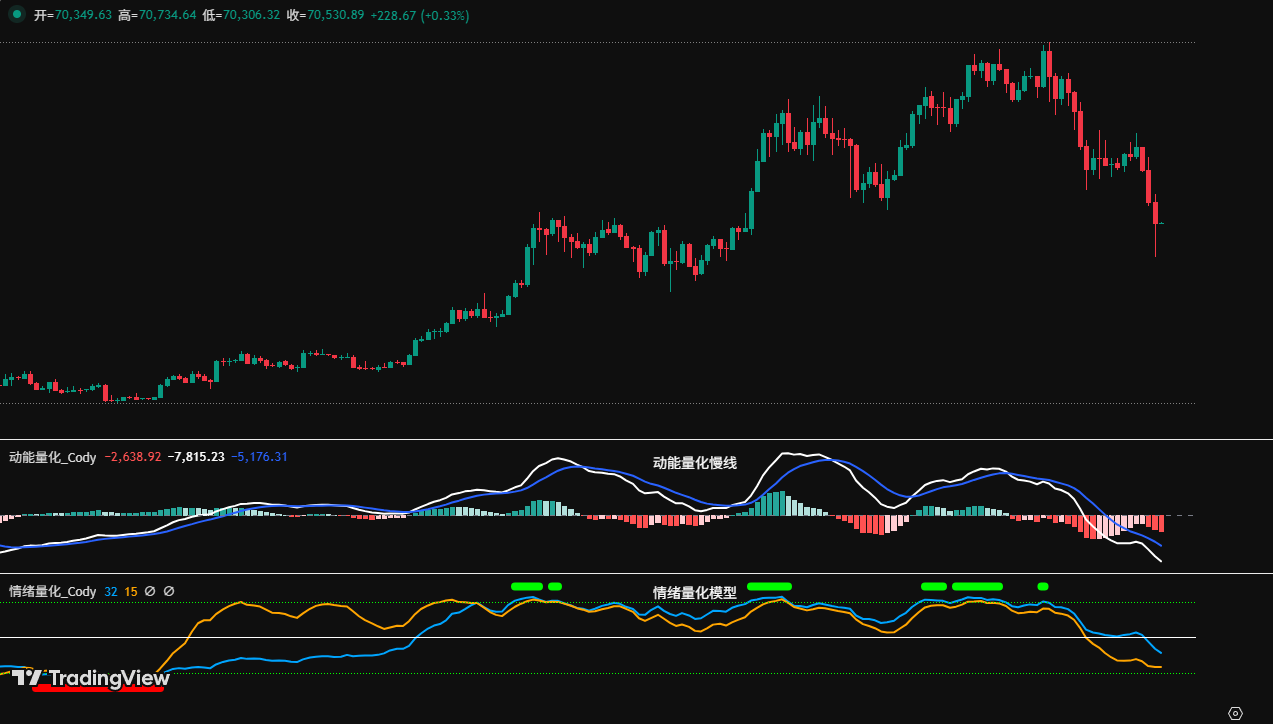
图四
• 动能量化模型:技术指标显示,上周做空动能进一步释放,两条动能线同步下行,负向能量柱逐步放大,呈现加速调整状态。
动能量化模型预示:币价下跌指数:高
• 情绪量化模型:蓝色情绪线数值 38,强度为零;黄色情绪线数值 11,强度为零,顶峰数值是 0。
情绪量化模型预示:币价底部支撑指数:中性
• 数字监测模型:监测(顶底部)数字信号未出现。
数字监测模型预示:底部信号未出现;周 K 线收带长下影大阴线,跌幅约 8.63%。
以上数据预示:比特币周线空头趋势,但是做空动能短期有衰退迹象。
2、如(图五)所示,从日线图分析:
比特币日 K 线图:(动能量化模型+情绪量化模型)
图五
• 动能量化模型:上周整体呈现“加速下跌-触底反弹”格局。周日盘后,白色动能线下行变缓,负向量能柱连续 3 天逐步萎缩。
动能量化模型预示:日线级别空头趋势,多头开始抵抗。
• 情绪量化模型:上周日收盘后,情绪模型触发底部预警信号(红点)之后,两条情绪线开始拐头向上运行。
情绪量化模型预示:支撑力度逐渐增强
以上数据提示:日线级别仍是空头趋势,但触发短期底部预警信号,短线反弹已开始。
四、本周行情预测:(02.09~02.15)
1、本周核心观点:观察上周低点60,000 美元是否被跌破,关注从此点位启动的超跌反弹力度。(若币价跌破 60,000 美元,则 C 浪细分6-7 段调整仍在延续,7 号点位引发的反弹还未开始)
2、核心压力位:
• 第一压力区:72,000-74,500 美元区域(去年 4 月低点附近)
• 第二压力区:80,000-80,600 美元区域(B 浪启动点附近)
3、核心支撑位:
• 第一支撑位:60,000-62,500 美元区域(近期调整低点附近)
• 第二支撑位:57,400美元附近(210 周均线附近)
• 重要支撑位:52,500 美元附近(1 倍 A 浪跌幅的对称点位附近)
五、本周操作策略(排除突发消息影响):(02.09~02.15)
1、 中线策略:保持60%空单。若反弹有效突破74,500 美元,可把仓位降至40%。
2、 短线策略:利用30%仓位,设置止损点,依据支撑及压力位,寻找做“价差”机会。(以 30 分钟/60 分钟作为操作周期)。
3、 操作上,为动态应对市场演变并结合实时模型信号,我们拟定A/B两套短线操作预案,:
• 方案 A:若币价反弹至74,500~75,200美元区域遇阻:
• 开仓:当反弹至该区域触发遇阻信号并结合模型顶部信号,可建立15%空头仓位。
• 风控:空单初始止损设于成本价上方1.5%附近(即 1.015*成本价)。
• 平仓:当跌至重要支撑位附近并结合模型信号,可逐步清仓获利了结。
• 方案 B:若币价反弹至80,000~80,600美元区域遇阻:
• 开仓:当反弹至该区域遇阻并结合模型顶部信号,可建立30%空头仓位。
• 风控:空单初始止损设于成本价上方1.5%附近(即 1.015*成本价)。
• 平仓:当下跌至支撑位并结合模型信号,可逐步清仓获利了结。
六、特别提示:
1. 开仓时:立即设置初始止损位。
2. 盈利达 1%时:将止损位移至开仓成本价(盈亏平衡点),确保本金安全。
3. 盈利达 2%时:将止损位移至盈利 1%的位置。
4. 持续跟踪:此后币价每再盈利 1%,止损位就同步移动 1%,动态保护并锁定。


