Tron traders on alert! THIS make-or-break level will decide TRX’s next move

ambcryptoPublished on 2026-06-26Last updated on 2026-06-26

Abstract

Tron (TRX) traders are watching a key support level as the cryptocurrency, which has gained 13.44% year-to-date, approaches a potential turning point. The asset is testing a crucial support zone between $0.318 and $0.320, a level that has previously initiated two rallies. A bounce from this support, followed by a close above $0.334, could propel TRX toward $0.353 and $0.377. Conversely, a break below $0.310 would signal a bearish shift, indicating a steeper decline. While the chart shows fading momentum into support, technical indicators offer a more bullish perspective. Bollinger Band analysis suggests the middle band has held as support on recent touches, and the Money Flow Index reading of 65 indicates continued capital inflow. The immediate price action at this make-or-break support level will determine TRX's next significant move.

While most major cryptocurrencies have suffered significant outflows this year, Tron [TRX] has held a largely bullish posture—the asset has booked a 13.44% gain year-to-date, and that resilience is now about to be tested.

TRX is approaching a decisive level on its price chart, and how it reacts there will determine whether it holds its place among the year’s bullish performers or breaks down into a far steeper decline.

TRX nears the support level that defines its trend

Chart analysis shows TRX bearing down on a key support level that will decide whether the asset can sustain its run. The token has shed 2% over the past day as it edges closer to that line.

This level has anchored two separate rallies, though the gains thinned noticeably as price ground back into support on the second attempt. Fading momentum into a level of this kind often signals that buying pressure there is weakening.

Source: TradingView

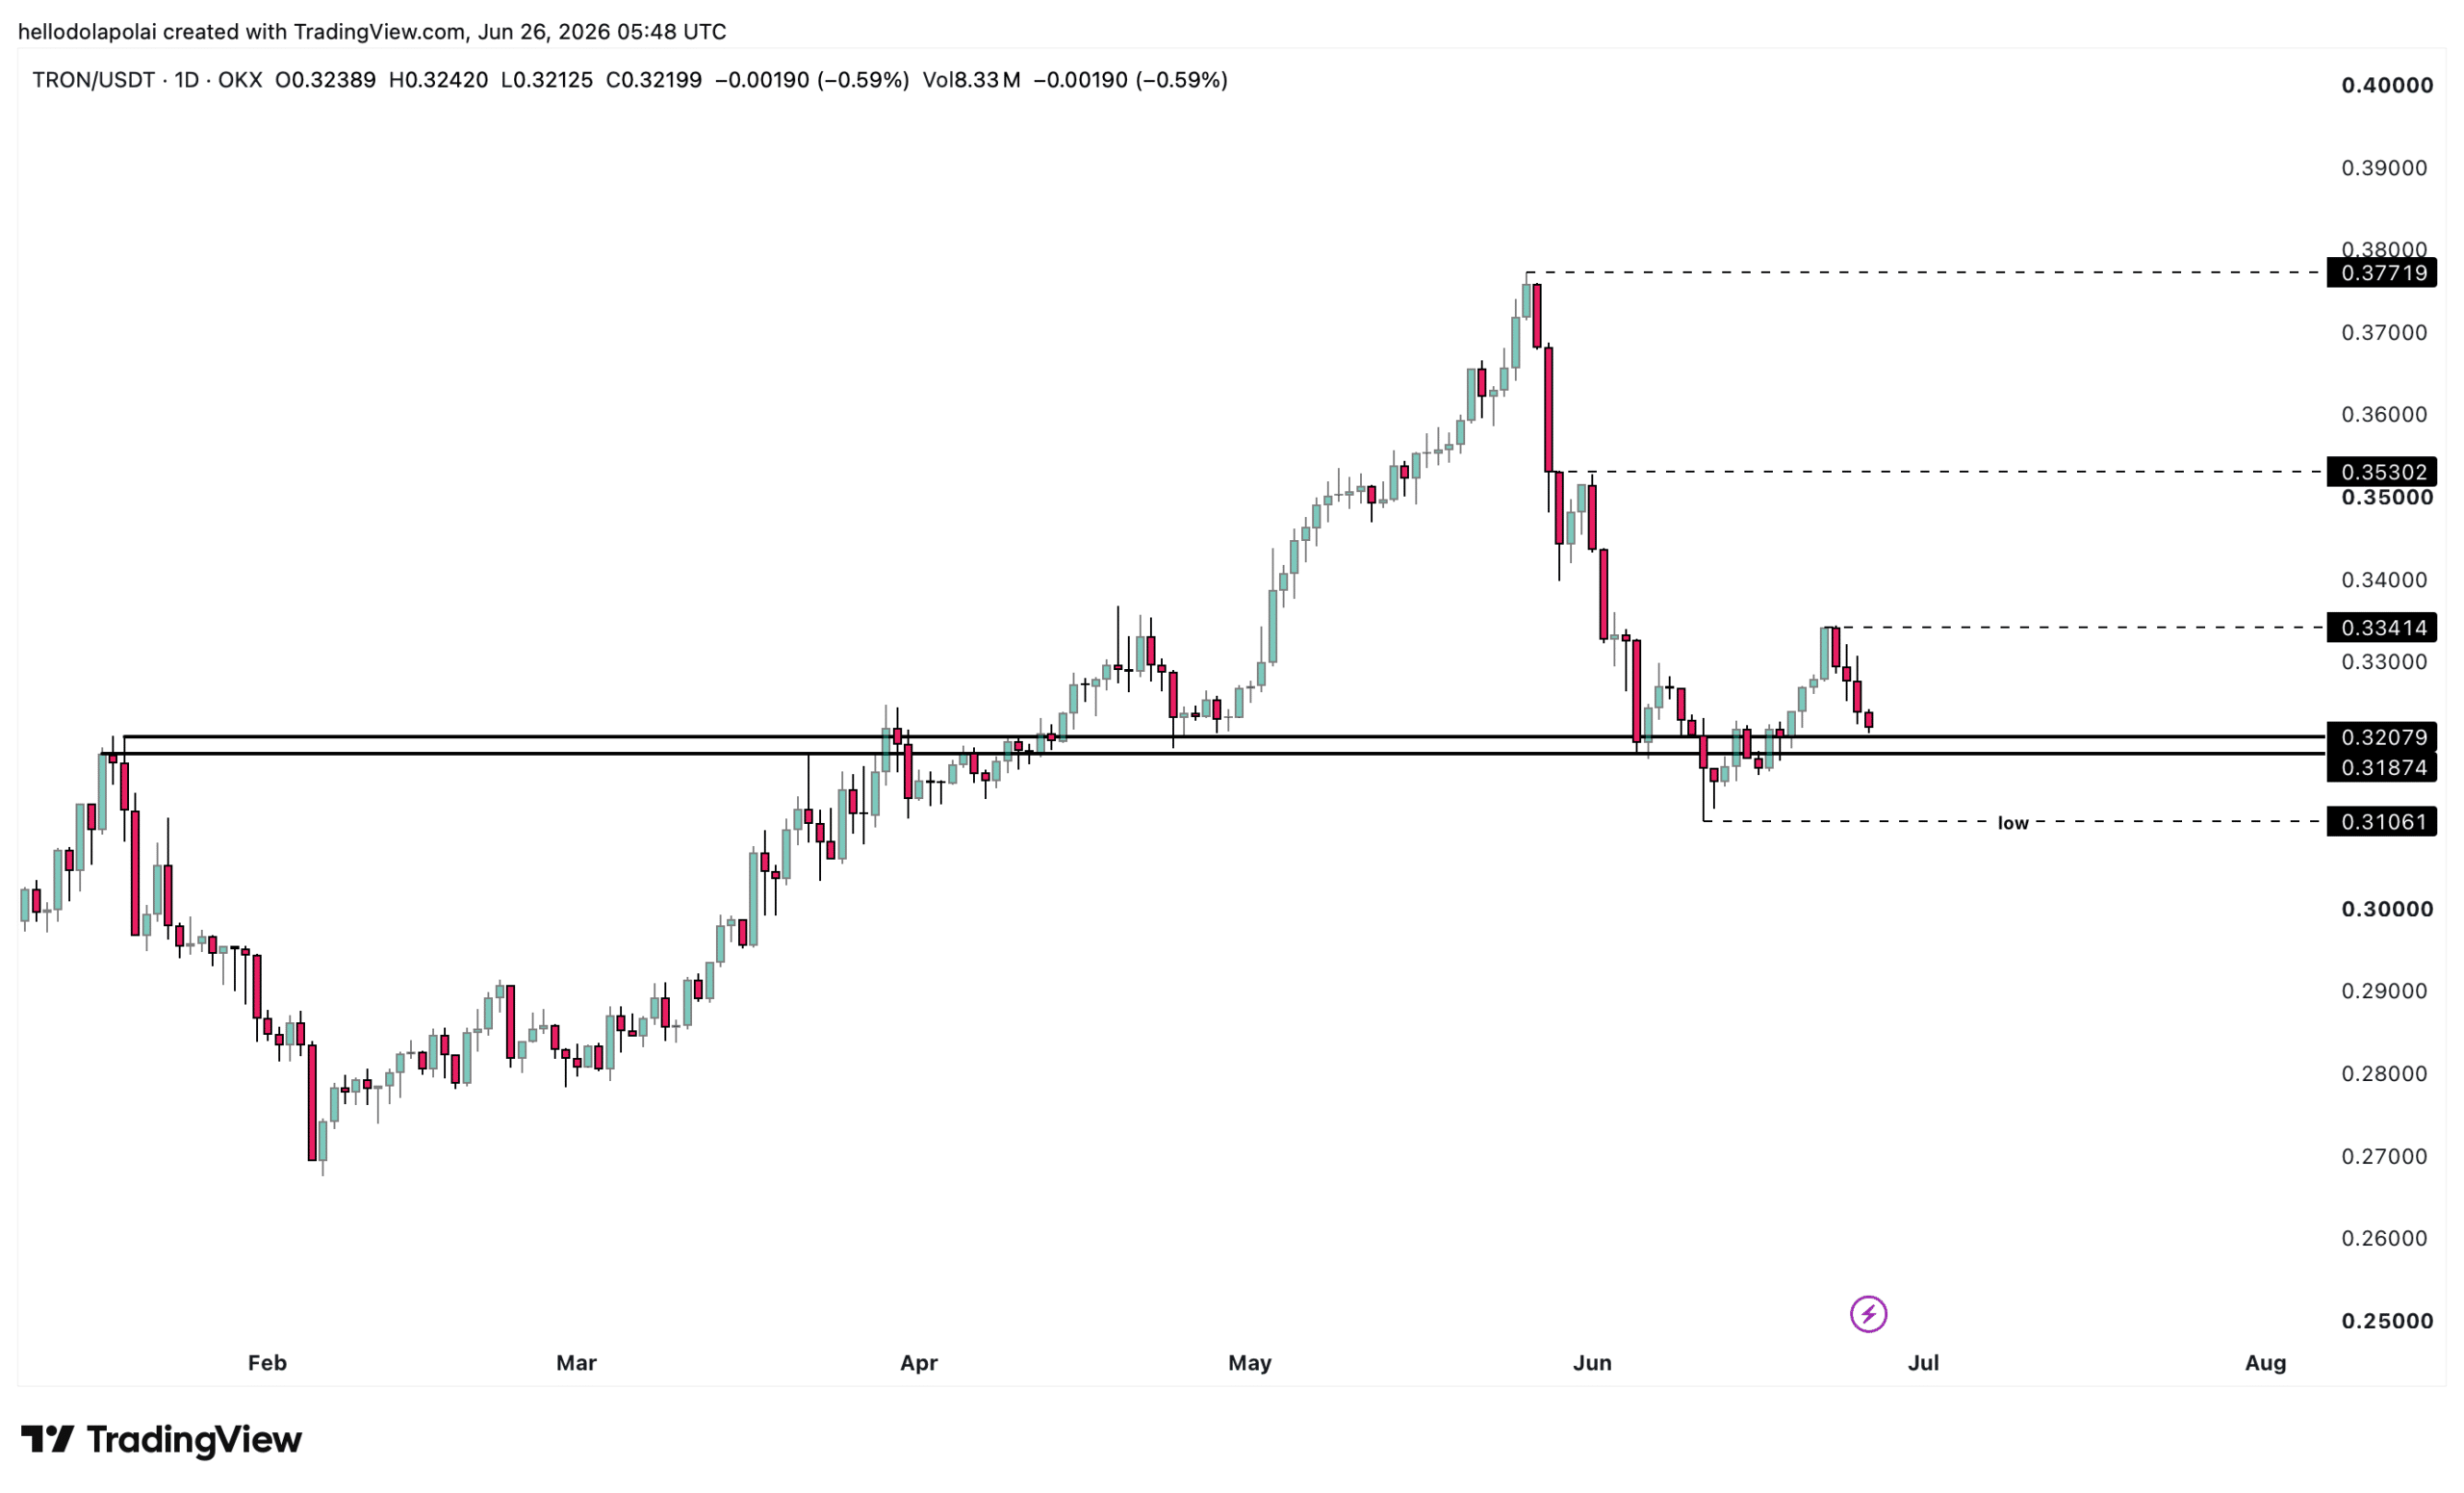
At the time of writing, the support sits between $0.318 and $0.320. Two scenarios flow from this chart pattern and frame the near-term bull and bear cases.

A bounce off support, a candle close above $0.334, and follow-through trade above it would confirm that bulls hold the upper hand, opening the path toward $0.353 and $0.377. A drop beneath $0.310—the marked low—would carve out a lower low and point to TRX extending its losses further.

TRX indicators lean bullish against the chart’s caution

The indicators paint a slightly different picture from the one the chart suggests.

Bollinger Band analysis points to price settling at its present level and attempting a move higher, provided the middle band (marked in blue) holds as support.

Source: TradingView

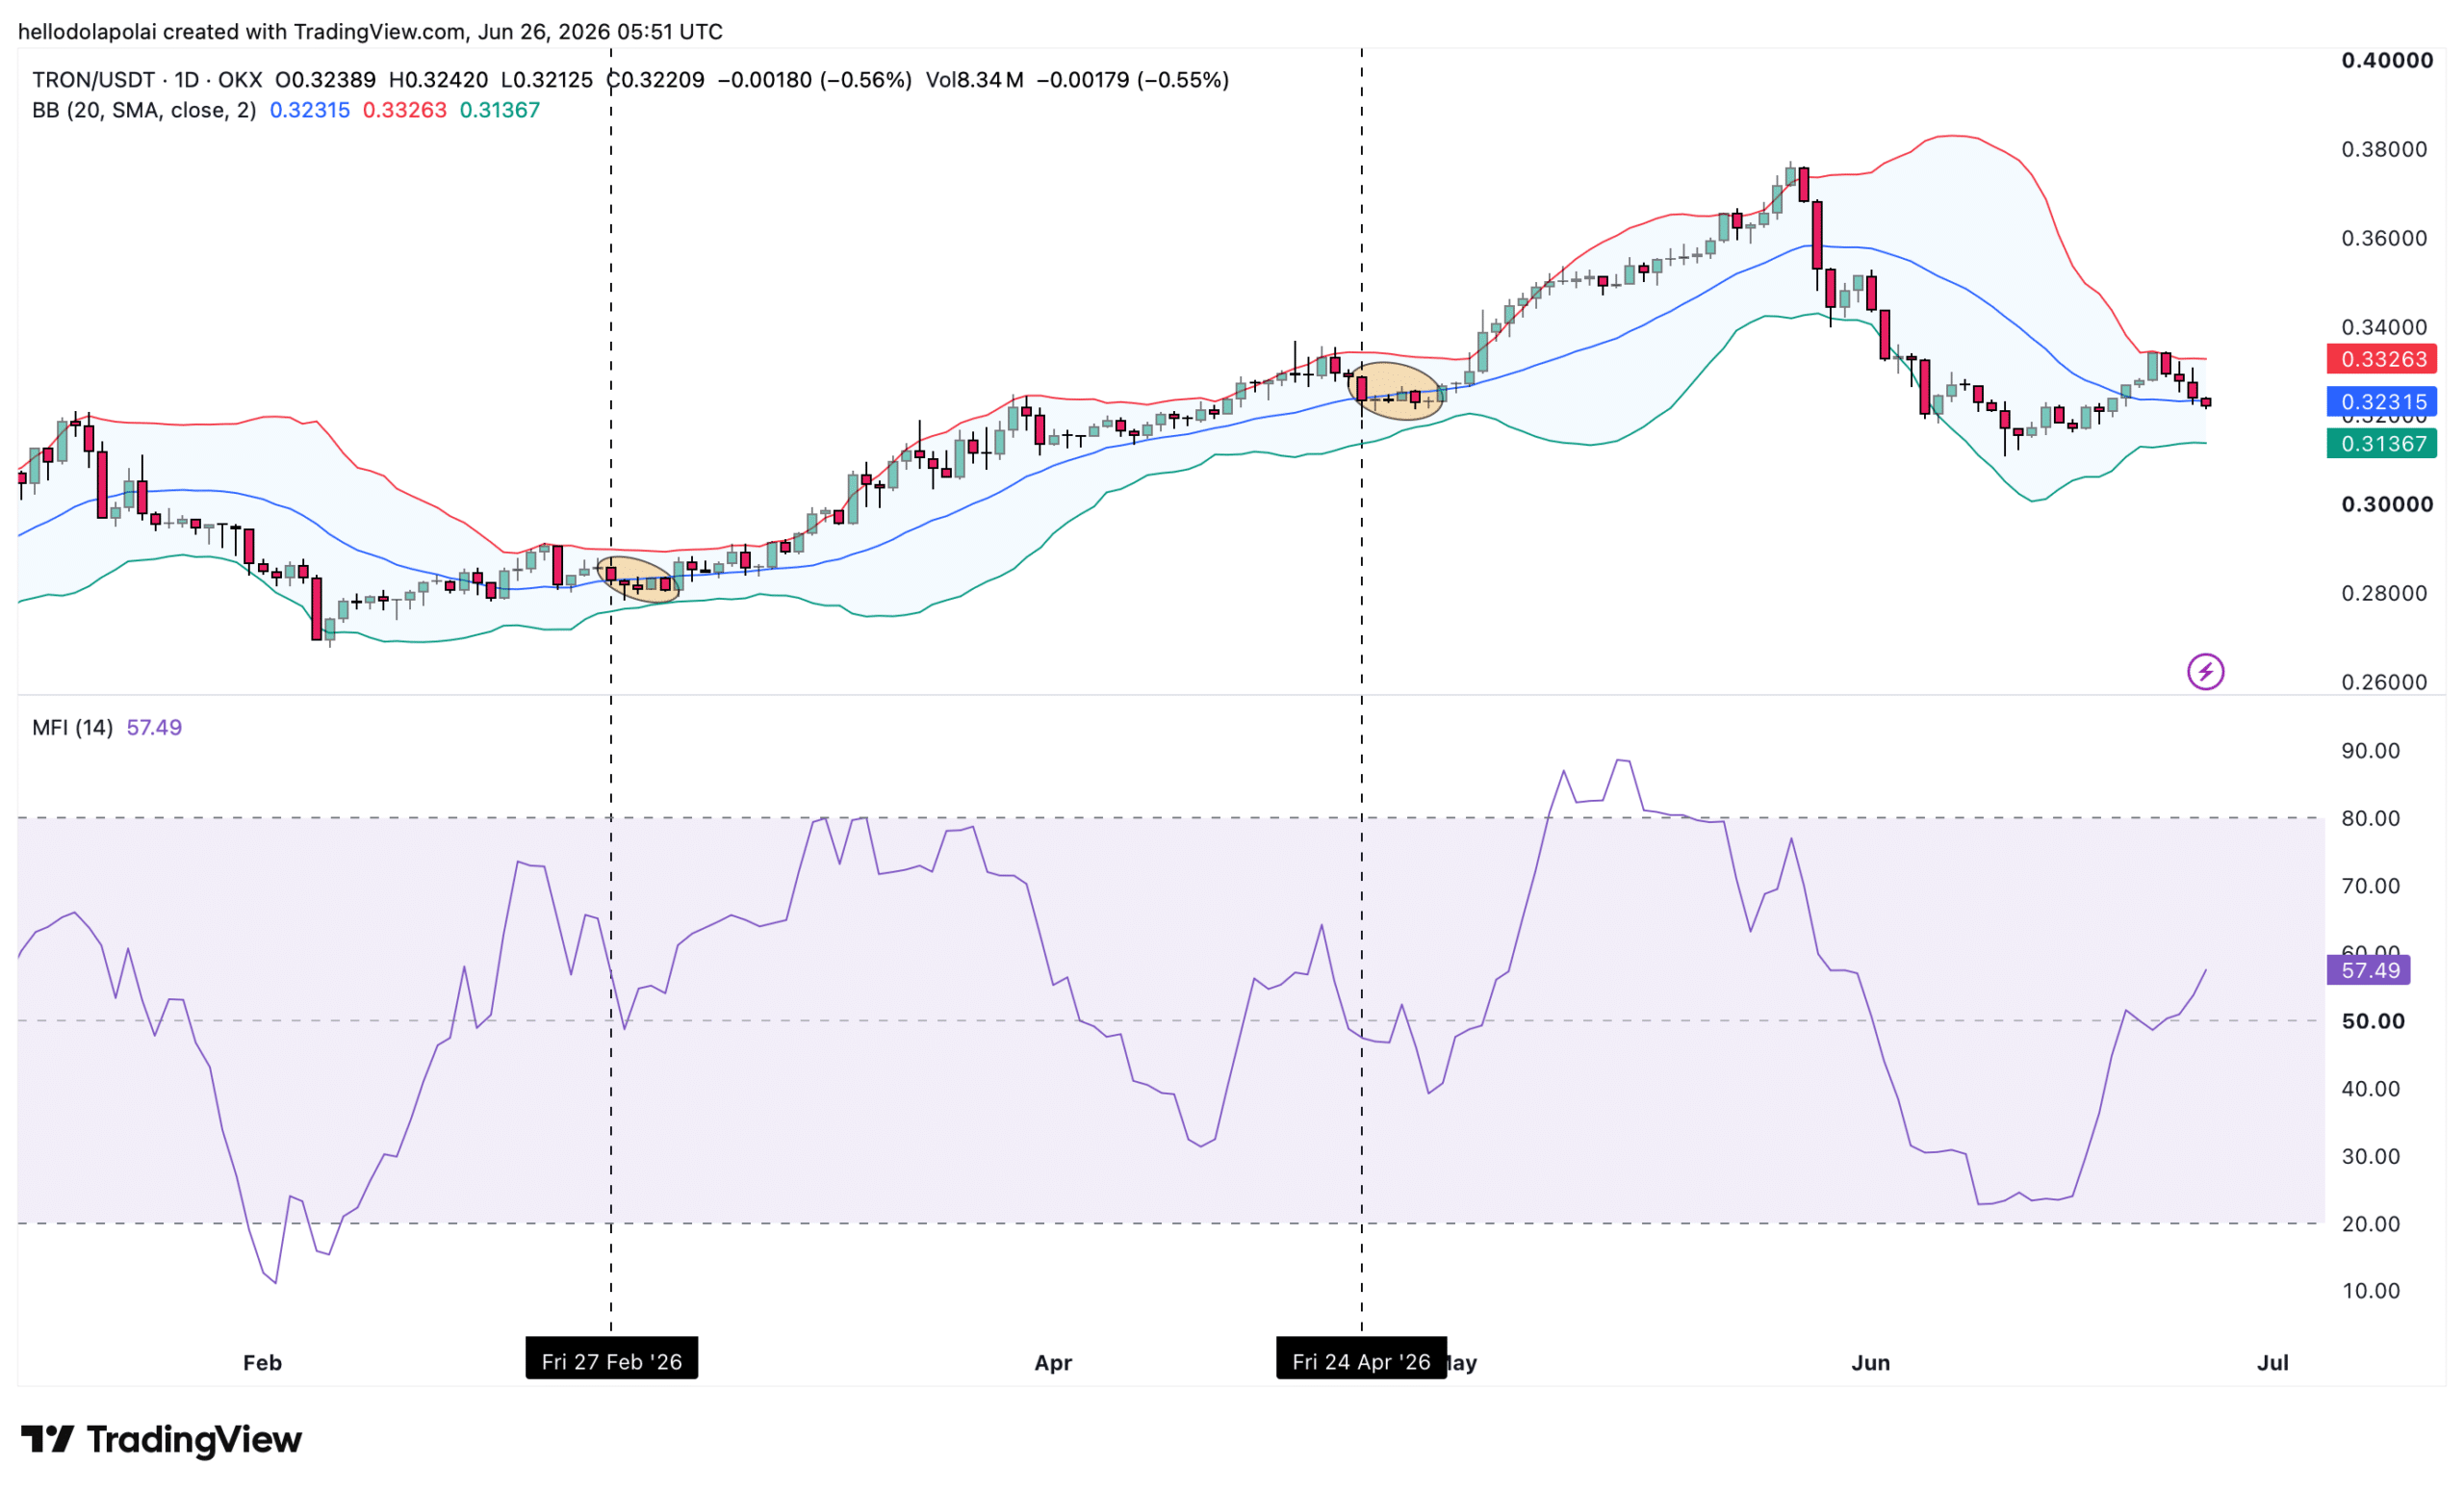
The middle band has done exactly that on the last two occasions the price dropped to it—and, notably, both touches landed on Fridays roughly two months apart, on the 27th of February and the 24th of April.

Now, at the time of writing, it is the 26th of June, another Friday.

There is no guarantee the fractal holds, but the Bollinger Band frames the worst case as a slide to $0.313. The Money Flow Index, which tracks capital moving into and out of an asset, reinforces the bullish read.

The MFI has kept climbing, with a current reading of 65 that sits firmly in the bullish zone (50–80), a sign that capital is flowing in and supporting the bullish case already in motion, and that the asset is likely to stay on that path.


Final Summary

  • TRX is holding just above a $0.318–$0.320 support zone that has sparked two rallies this year, and the reaction there decides whether its gains survive.
  • Momentum still leans bullish as capital flows in, but a break below $0.310 would flip the outlook bearish.

Trending Cryptos

Related Questions

QWhat is the critical support level that TRX is approaching, according to the article?

ATRX is approaching the critical support level between $0.318 and $0.320.

QWhat are the two possible price scenarios outlined for TRX based on its reaction to the support level?

AThe two scenarios are: 1) A bounce off support, a close above $0.334, and a move higher targeting $0.353 and $0.377. 2) A drop below $0.310, which would signal a lower low and extend losses.

QWhat bullish signal does the Money Flow Index (MFI) provide for TRX in the article?

AThe Money Flow Index has a reading of 65, which is in the bullish zone (50–80), indicating that capital is flowing into TRX and supporting the bullish case.

QAccording to the Bollinger Band analysis, what is the worst-case price target mentioned if TRX breaks down?

AAccording to the Bollinger Band analysis, the worst-case scenario is a slide down to $0.313.

QHow has Tron (TRX) performed year-to-date compared to other major cryptocurrencies, as stated in the article?

ATron (TRX) has gained 13.44% year-to-date, showing resilience while most other major cryptocurrencies have suffered significant outflows.

Related Reads

Google's 'Reasoning King' Also Departs for Meta, Originally Recruited by Fei-Fei Li

"Google's 'King of Reasoning' Leaves for Meta, Quietly Departing After Over Eight Years. Denny Zhou, a key figure behind Google's AI reasoning advancements including work showcased by CEO Sundar Pichai, has joined Meta's MSL as a research scientist. His low-profile move, discovered via a LinkedIn update, occurred months before the high-profile departures of Noam Shazeer to OpenAI and Nobel laureate John Jumper to Anthropic. Zhou was originally recruited to Google by Fei-Fei Li's China center initiative after nearly 11 years at Microsoft. This is part of a significant talent drain at Google, with top researchers like Shazeer (co-author of the Transformer paper) and Jumper (AlphaFold lead) recently leaving for rivals. Reports suggest internal friction is a contributing factor, particularly around Google's strategic shift. The company has reportedly formed a high-priority 'AI Coding Strike Team,' involving co-founder Sergey Brin, to urgently bridge the gap in AI coding agents, potentially reallocating resources and focus away from other research directions like DeepMind's 'world model' AGI approach. This pivot towards commercially-proven coding applications may have influenced departures, as hinted by Shazeer's comment about his compute allocation being given to another team. Meanwhile, Meta continues to bolster its team, also recently hiring UC Berkeley professor and 'security godmother' Dawn Song, along with her startup Virtue AI team, as a VP of AI research."

marsbit2h ago

Google's 'Reasoning King' Also Departs for Meta, Originally Recruited by Fei-Fei Li

marsbit2h ago

How Did Hundreds of Billions of Dollars Flow into SpaceX After Its Index Inclusion on June 26th? Will SpaceX Experience a Massive Price Surge?

Will SpaceX ($SPCX) stock surge when billions in passive index fund money flows in on the effective date? A common retail investor belief is that a massive wave of buying will hit on July 6th, when SpaceX joins the Nasdaq-100, potentially causing a huge price spike. However, the reality is far more complex and less dramatic. The anticipated billions are not controlled by a single entity but are spread across hundreds of passive fund managers (e.g., BlackRock, Vanguard) whose sole mandate is to minimize "tracking error." They aim to buy shares at prices as close as possible to the index's closing price on the effective date, not to aggressively drive the price up. There are two key index inclusion scripts: 1) For the Russell US Index (effective June 26th at close), buying is compressed into the final minutes via Market-On-Close (MOC) orders. 2) For the Nasdaq-100 (announced June 26th, effective July 6th), a 10-day window creates a layered game. Arbitrage funds buy early, betting on selling to passive funds later. Some index funds "front-run" by accumulating shares gradually before the deadline. The bulk of passive funds execute large MOC orders at the July 6th close, often trading directly with arbitrageurs. A critical wildcard is SpaceX's limited free float due to a standard 180-day post-IPO lockup. To avoid causing a massive price spike by competing for scarce shares on the open market, large funds will likely use off-exchange methods: 1) Negotiating large block trades (over-the-counter) with major holders. 2) Using derivatives like total return swaps with locked-up shareholders to gain economic exposure without physically buying the stock. Most of the index-driven buying will thus happen invisibly, not on public exchanges. For retail investors, trying to front-run these sophisticated flows is risky. More viable strategies include: waiting for post-inclusion volatility to subside before establishing a long-term position, or employing options strategies like selling strangles to profit from elevated, but potentially overstated, implied volatility around the event. In conclusion, while price appreciation may occur in the days following the announcement due to arbitrage and front-running activity, a single-day "explosive pump" on July 6th is highly unlikely. The major index fund buying will be executed efficiently and discreetly, often away from public markets, turning the anticipated climax into a well-orchestrated, anti-climactic settlement.

marsbit3h ago

How Did Hundreds of Billions of Dollars Flow into SpaceX After Its Index Inclusion on June 26th? Will SpaceX Experience a Massive Price Surge?

marsbit3h ago

Trading

Spot

Hot Articles

Discussions

Welcome to the HTX Community. Here, you can stay informed about the latest platform developments and gain access to professional market insights. Users' opinions on the price of S (S) are presented below.

活动图片