# Quantitative Related Articles

HTX News Center provides the latest articles and in-depth analysis on "Quantitative", covering market trends, project updates, tech developments, and regulatory policies in the crypto industry.

Bitcoin's Key Channel Broken? History Won't Simply Repeat Itself | Invited Analysis

This analysis by Odaily's guest market analyst Cody examines Bitcoin's recent price action and potential future trajectories. The key technical focus is the breach of Bitcoin's critical rising channel support, which had been acting as a "lifeline" for the market since the November 21, 2025, low of $80,600. The report compares the current market structure to the 2021 cycle, noting a similar three-wave corrective pattern (A-B-C) but cautioning that history does not simply repeat itself. The recent break below the $94,500-$95,000 support zone confirmed a return to a wider consolidation range between $84,000 and $94,500. Key scenarios are outlined: * If the price fails to reclaim the rising channel's support, a bearish C-wave could drive the price down towards key support levels at $84,000, $80,600 (the B-wave starting point), and potentially $75,200. * A recovery above the channel support could lead to a retest of the $94,500 resistance and the 21-week moving average, though this would require supportive macro conditions. The analyst details a successful short-term trade from the previous week, which yielded a 3.76% return using a quant model-based strategy. Current market structure is assessed as bearish on weekly and daily timeframes, with the daily momentum indicator dipping below zero. The upcoming week's strategy involves monitoring the confirmed break of the channel support. Operational plans include potential short positions (with a 60% allocation for mid-term and 30% for short-term trades) targeting the $84,000 support, with strict stop-loss and profit-taking rules based on quant model signals.

marsbit01/26 06:05

Bitcoin's Key Channel Broken? History Won't Simply Repeat Itself | Invited Analysis

marsbit01/26 06:05

Bitcoin's Short-Term Bear-to-Bull Transition: Will History Repeat Itself? | Invited Analysis

Summary of Bitcoin Market Analysis by Conaldo (Odaily Guest Analyst): This weekly trading report provides a technical analysis of Bitcoin's recent price action and outlines short-term trading strategies. The analyst, leveraging proprietary quantitative models (Momentum Quant, Sentiment Quant, and Spread Trading models), reviews the past week and forecasts the upcoming period. **Key Points & Performance:** * **Strategy Execution:** A single short-term, leveraged (1x) trade was executed last week, resulting in a -1.07% return. The trade was closed according to strict risk management rules after the market moved against the initial short signal. * **Price Validation:** The previous week's core prediction was validated as BTC's price successfully broke through the key resistance zone of $94,500-$95,000, reaching a high near $97,963. * **Current Market Structure:** The weekly chart analysis indicates the overall trend remains bearish, requiring caution. The daily chart shows a recent rebound with initial signs of bullish momentum, though its sustainability is not yet confirmed. **Technical Outlook & Key Levels (Jan 19-25):** * **Critical Zone:** The $94,500-$95,000 area is identified as the crucial level to watch for determining short-term direction. * **Resistance Levels:** Key resistance areas are $94,500-$95,000, $97,500-$99,500, and a major level near $102,000 (the 21-week moving average). * **Support Levels:** Key support areas are $89,500-$91,000, $86,000-$86,500, and a major level near $84,000. **Trading Strategy:** Two scenarios are proposed for the coming week using 30% capital: * **Scenario A (Bullish Break):** If BTC stabilizes above $94,500-$95,000, consider a long position with a stop-loss 1.5% below entry. * **Scenario B (Bearish Rejection):** If BTC is rejected at or falls below $94,500-$95,000, consider a short position with a stop-loss 1.5% above entry, targeting ~$86,500. **Historical Context & Broader Trend:** A comparison to a past market cycle (2021) suggests the 21-week moving average will be a critical multi-week bull/bear divider. A failure to break and hold above it could lead to further downside, potentially below $80,000. A true trend reversal to bullish would require the weekly MACD to show a clear bullish crossover. **Risk Management Emphasis:** The report strongly emphasizes disciplined risk management: setting stop-losses immediately upon entry and trailing them to protect capital and lock in gains as the trade moves favorably. *Disclaimer: This analysis is for informational purposes only and not investment advice. Markets are volatile; always conduct your own research (DYOR).*

Odaily星球日报01/19 05:21

Bitcoin's Short-Term Bear-to-Bull Transition: Will History Repeat Itself? | Invited Analysis

Odaily星球日报01/19 05:21

94,500 May Become the Pivot Point for Bitcoin Bulls and Bears, Daily Chart Structure Enters Critical Observation Zone | Guest Analysis

**Bitcoin Technical Analysis: Key $94,500 Level as Market Enters Critical Phase** This analysis, authored by Cody Feng, reviews Bitcoin's performance from January 5-11 and provides a forward-looking outlook. Last week, the market precisely followed the predicted range-bound movement between $84,000 and $94,500, with a high of $94,789 and a low of $89,311. A successful short trade was executed at the $94,500 resistance level, yielding a 3.4% return. **Key Technical Observations:** * **Weekly Chart:** Indicators suggest a bearish trend is still in place, with the market remaining in an "air pocket" below a key multi-week moving average. A recent rejection at this level confirms sellers are still in control. * **Daily Chart:** The market is at a critical juncture. Momentum indicators show a struggle between bulls and bears, with no clear directional bias confirmed yet. **This Week's Forecast (Jan 12-18):** The primary expectation is for Bitcoin to continue consolidating within the $84,000-$94,500 range. A decisive break above $94,500 could trigger a stronger technical rebound towards $97,500. Conversely, a break below $84,000 would likely target the $80,000 support level. **Trading Strategy:** * **Mid-term:** Maintain a 65% short position as long as price remains below $94,500. * **Short-term:** Use 30% of capital for tactical trades based on range-bound (Plan A), breakdown (Plan B), or breakout (Plan C) scenarios, using the defined support/resistance levels and a strict 1.5% stop-loss. **Macro Focus:** A series of speeches from various Federal Reserve officials this week will be crucial for recalibrating market expectations on monetary policy. Their commentary on inflation and the economic outlook will significantly influence medium-term liquidity expectations and risk asset valuations, including Bitcoin. **Risk Management is emphasized:** Always set an initial stop-loss immediately upon opening a position and use a dynamic trailing stop to protect capital and lock in gains as the trade moves favorably.

marsbit01/12 07:15

94,500 May Become the Pivot Point for Bitcoin Bulls and Bears, Daily Chart Structure Enters Critical Observation Zone | Guest Analysis

marsbit01/12 07:15

94,500 May Become the Bull-Bear Battle Line for Bitcoin, Daily Chart Structure Enters Key Observation Zone | Guest Analysis

Bitcoin Price Analysis: $94,500 as Key Pivot Level, Weekly Outlook and Trading Strategies In this weekly analysis, crypto market analyst Cody Feng reviews Bitcoin's performance and outlines key levels and strategies for the coming week. Last week, BTC traded within the predicted range of $84,000–$94,500, hitting a high of $94,789 and a low of $89,311. A short trade executed at the $94,500 resistance level yielded a 3.4% gain using a 1x leverage. The trade was based on a "short at resistance" strategy, supported by proprietary quantitative models for momentum and spread trading. Current model readings suggest mixed signals: - Weekly charts indicate a bearish trend with momentum below zero, though selling pressure is slowing. - Daily charts show consolidation near the zero line, indicating a battle between bulls and bears. This week (Jan 12–18), BTC is expected to continue trading between $84,000–$94,500. A break below $84,000 could lead to a test of $80,000, while a sustained move above $94,500 may signal a stronger rebound. Key resistance levels are $92k–$93k, $94.5k–$95k, and $97.5k–$99.5k. Support levels are $89.5k–$91k, $86k–$86.5k, $83.5k–$84.5k, and $80k. Trading strategies include: - Maintaining a 65% mid-term short position unless $94,500 is broken. - Using 30% capital for short-term trades based on range-bound (A), breakdown (B), or breakout (C) scenarios. Macro focus this week features multiple Fed speakers whose comments may influence liquidity expectations and medium-term market sentiment. Risk management is emphasized: set stop-losses at entry, move to breakeven at +1% profit, and trail stops thereafter. Disclaimer: This analysis is for informational purposes only and not investment advice. Trade with caution.

Odaily星球日报01/12 07:01

94,500 May Become the Bull-Bear Battle Line for Bitcoin, Daily Chart Structure Enters Key Observation Zone | Guest Analysis

Odaily星球日报01/12 07:01

Long-Short Showdown Imminent, Three Strategies to Help You Profit in the Short Term | Invited Analysis

Cody Feng, a quantitative trading analyst, provides a weekly Bitcoin market analysis and strategy report. Last week's short-term trades (1x leverage) yielded a net 0.62% return, successfully validating the forecast that BTC would consolidate between $86,500 and $91,000 if it held the $86,000-$86,500 support. The price action, with a high of $91,764 and a low of $86,675, matched this prediction. Technical analysis indicates the weekly chart remains in a downtrend with bearish momentum, while the daily chart shows the market is at a critical juncture, with momentum indicators approaching a key equilibrium point, suggesting a potential directional breakout. For the coming week (Jan 5-11), the primary trading range is projected to be $84,000 to $94,500. A breakdown below $84,000 could trigger a move toward $80,000, while a decisive break above $94,500 may signal the start of a stronger technical rebound. Three short-term trading plans are outlined: - **Plan A (Range-bound: $84k-$94.5k)**: Short 30% of capital at resistance ($93k-$94.5k), stop-loss above $95.5k, take profit near support levels. - **Plan B (Breakdown below $84k)**: Short on the break, stop-loss above $85k, target $80k. - **Plan C (Breakout above $94.5k)**: Go long on the break, stop-loss below $93k, target $97.5k. Key US macroeconomic events this week, including speeches from FOMC officials and critical employment data (ADP, Initial Jobless Claims, Non-Farm Payrolls), could significantly impact market expectations for Fed policy and influence Bitcoin's medium-term valuation. All strategies include strict risk management rules for dynamic stop-loss placement to protect capital and lock in profits. *Disclaimer: This is a personal trading log for educational purposes, not investment advice. DYOR.*

marsbit01/05 07:45

Long-Short Showdown Imminent, Three Strategies to Help You Profit in the Short Term | Invited Analysis

marsbit01/05 07:45

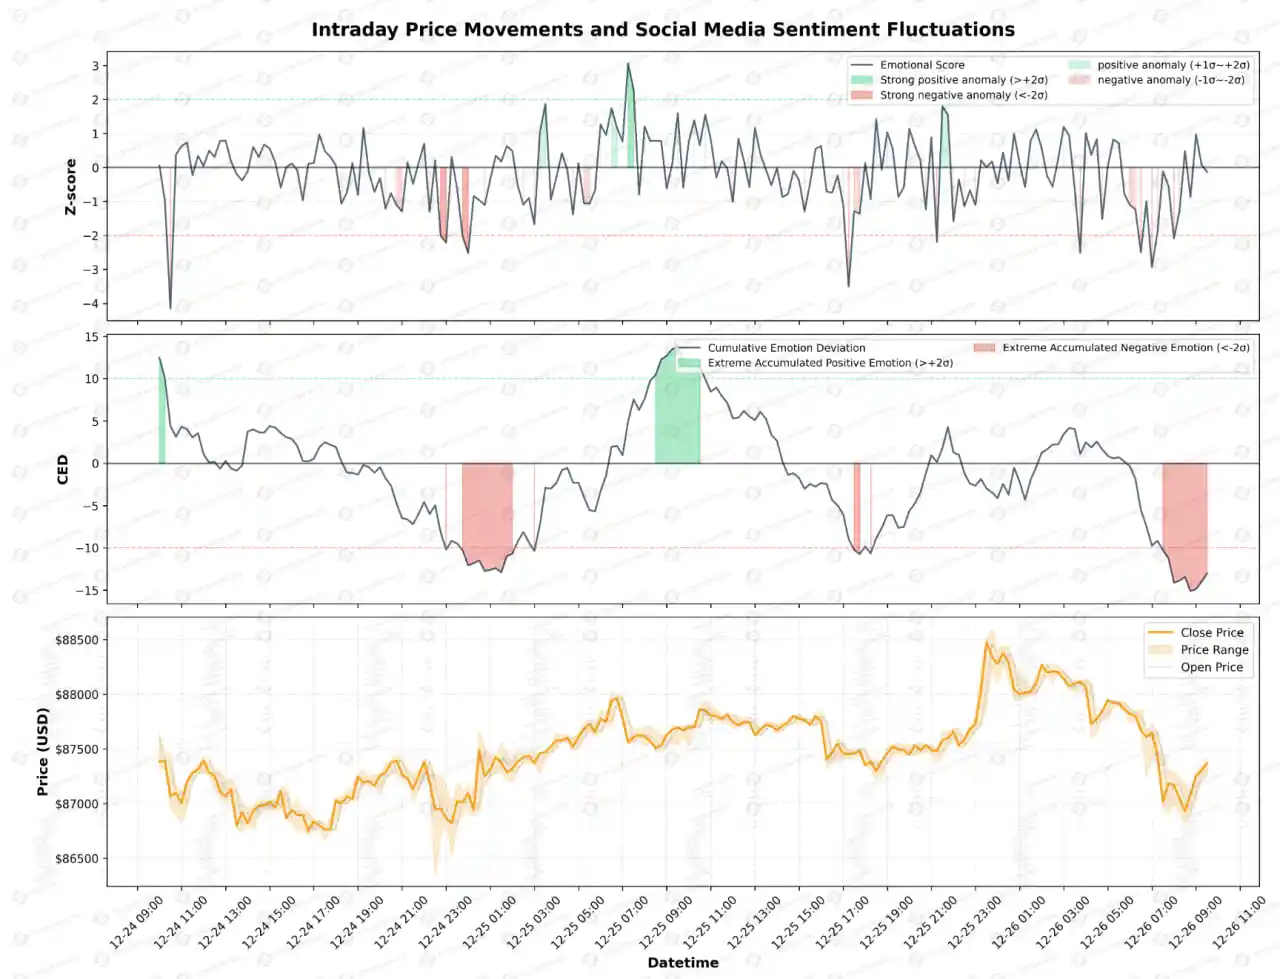
Intraday Quantitative Sentiment Fluctuation Analysis Report — December 26, 2025

BTC Market Sentiment Analysis Report — 2025.12.26 Over the past 24 hours, BTC market sentiment exhibited a V-shaped pattern, starting stable, then declining, before rebounding. Overall sentiment was negative, with the CED (Crypto Emotion Index) dropping from an initial 12.27 to a low of -15.14, with a slight recovery to -13.05 by the end of the session. Key情绪时段 (Emotional Phases): - Morning (09:45–12:00): High volatility in sentiment (CED 12.27 → 7.12) with narrow price fluctuations. - Afternoon to Evening (12:00–20:00): Sustained weakening of sentiment (CED 7.12 → -5.64), accompanied by a gradual price decline. - Night (20:00–04:00): Intense sentiment swings (CED -5.64 ↔ 4.28) alongside significant price oscillations. - Early Morning to Open (04:00–09:45): Sentiment plunged deeply (CED 1.86 → -13.05), resulting in a breakdown in price. Extreme Sentiment and Price Correlation: - Periods of extreme negative sentiment (CED < -10) showed a significantly higher probability of price declines, with an average drop of 0.12%. - Neutral sentiment ranges (|CED| ≤ 10) showed minimal directional bias, with a slight average increase of 0.03%. - Extreme sentiment phases often signal potential price reversals, particularly rebounds following intense negative sentiment. Summary and Conclusions: - Market sentiment remains deeply negative (CED = -13.05), reflecting severe lack of investor confidence. - Emotional momentum has noticeably weakened, suggesting a possible consolidation or bottoming phase in the short term. - A short-term support level has formed between 87,000–87,400; monitoring sentiment recovery is crucial. - Prolonged extreme negative sentiment increases the risk of further downward movement.

marsbit12/26 02:26

Intraday Quantitative Sentiment Fluctuation Analysis Report — December 26, 2025

marsbit12/26 02:26

BTC Medium-Term Trend Weakens, Short-Term Volatility Fails to Mask Directional Risks | Guest Analysis

This analysis by Odaily's guest analyst Conaldo examines Bitcoin's (BTC) current market stance, highlighting a weakening medium-term trend and short-term consolidation with directional risks. The core view is that BTC is in a corrective phase after breaking its long-term bullish trend line (since late 2022) and is now constrained by both this and a descending trend line from the October 2025 high. Until a significant volume-backed breakout occurs above these key levels, any price rises should be considered rebounds within a bearish structure. Last week's prediction of a shift to a consolidation pattern was accurate, with price oscillating in the $87.5K–$89K zone. The analyst successfully executed four short-term trades based on a quant model, yielding a 2.14% return. Technical analysis using weekly and daily charts (incorporating momentum and sentiment quant models) indicates BTC remains in a bearish market on both timeframes, with weak buying momentum and neutral sentiment, suggesting continued consolidation and downside risk. For the upcoming week (Dec 22–28), the market is expected to see wide-range fluctuations. The key area to watch is $89.5K–$91K. A breakdown could lead to deeper correction, while holding could allow for a limited rebound. Specific short-term trading plans (A and B) are outlined for both scenarios, involving 30% short positions with precise entry, stop-loss, and take-profit levels. Key macro events this week include reduced holiday liquidity, potential Fed chair nomination news, US Q3 GDP and PCE data, and BoJ communications, all of which could impact market volatility. The analyst emphasizes strict risk management, including moving stop-losses to breakeven after a 1% profit. All views are for informational purposes only; DYOR.

marsbit12/22 07:06

BTC Medium-Term Trend Weakens, Short-Term Volatility Fails to Mask Directional Risks | Guest Analysis

marsbit12/22 07:06

BTC Medium-Term Trend Weakens, Short-Term Volatility Fails to Mask Directional Risks | Invited Analysis

BTC Mid-Term Trend Weakens, Short-Term Volatility Masks Directional Risks | Guest Analysis Analyst Conaldo reviews Bitcoin market performance from Dec 15-21, noting that BTC entered a predicted consolidation phase, oscillating within the $87.5K–$89K range. The mid-term outlook remains bearish, with the long-term bullish trend line (since late 2022) and the recent descending trend line (from the Oct 2025 high) converging. A breakout above this dual resistance is needed to shift the bearish structure. Last week, four short trades were executed based on quantitative models, yielding a 2.14% return. Key supports were held around $84.5K, closely aligning with predictions. Technical analysis (weekly and daily charts) indicates BTC remains in a bear market. Momentum indicators linger below zero, and sentiment metrics are neutral, suggesting continued weakness and potential downside risk. For the week of Dec 22-28, BTC is expected to trade in a wide range. Critical resistance lies at $89.5K–$91K. A breakdown could deepen corrections, while holding may lead to limited rebounds. Key supports are at $86.5K–$87.5K and $83.5K–$84.5K. Trading strategies maintain 65% mid-term short positions and 30% short-term tactical shorts based on range breaks, with strict stop-losses and profit-taking rules. Macro factors include reduced holiday liquidity, potential Fed chair nomination announcements, U.S. Q3 GDP revisions, and BoJ policy cues, which may influence market volatility. Investors are advised to exercise caution amid low-liquidity swings.

Odaily星球日报12/22 06:40

BTC Medium-Term Trend Weakens, Short-Term Volatility Fails to Mask Directional Risks | Invited Analysis

Odaily星球日报12/22 06:40

活动图片