Odaily 特邀行情分析师 Cody Feng,美国哥伦比亚大学金融统计硕士,自大学期间专注美股量化交易,并逐步拓展至比特币等数字资产,在实战中构建出一套系统化的量化交易模型与风险控制体系;对市场波动具备敏锐的数据洞察力,并立志于在专业交易领域持续深耕,追求稳健回报;将于每周深挖 BTC 技术、宏观、资金面等变化,复盘并展示实操策略,预告近期值得关注的大事记,以供参考。

交易周报核心摘要:
• 策略执行(短期)成效验证:上周交易严格遵循既定策略执行,成功完成一次短线操作(1 倍杠杆),累计实现收益 3.4%。
• 核心观点(短期)验证:上周提出的“比特币或将维持 84,000~94,500 美元区间震荡”的核心观点,已获市场精确应验。过去一周,币价最高触及 94,789 美元,最低下探 89,311 美元,与所给的阻力位 94,500 美元与支撑位 89,500 美元高度吻合,这一结果有力地印证了我们对关键点位的研判。
下文将详细回顾行情预判、策略执行与具体交易过程。
一、交易行情回顾:(01.05~01.11)
1、上周短线操作回顾:
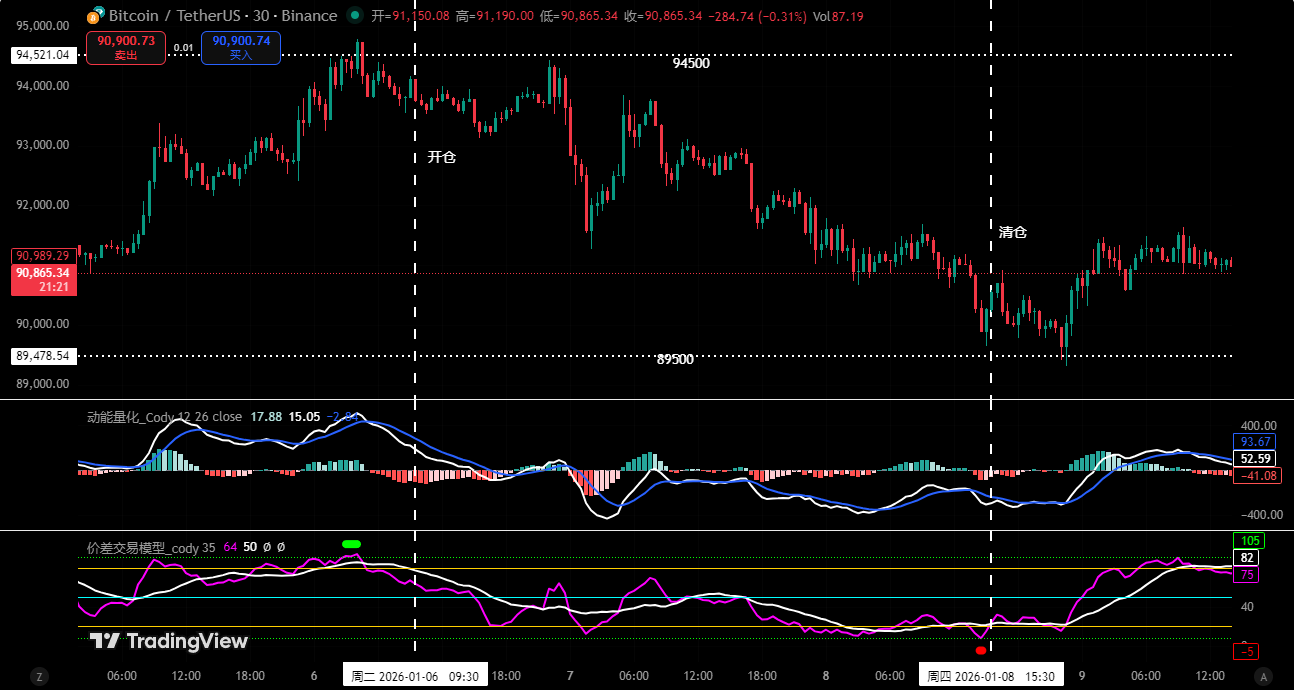
我们严格依据自主构建的“价差交易”与“动能量化”两大模型发出的交易信号(见图一红绿色块信号),并结合对市场走势的精准预判,成功完成一次短线操作,累计实现收益3.4%。具体交易明细与复盘如下:
1、交易明细汇总:(未加杠杆)

2、短线交易复盘:
• 交易(盈利 3.4%):本次操作完美执行了“压力位遇阻沽空”策略:第一步,当币价上行冲击94,500美元关键阻力位时,与价差交易模型的顶部信号(绿点)形成共振,我们果断入场建立 30%空头仓位;第二步,待币价回落至目标支撑区并触发模型底部信号(红点)后,我们顺势平仓,锁定收益。
2、上周走势预判与操作策略回顾:
1、上周明确指出:重点观察84,000~94,500美元区域的得失。在未有效突破区域上下沿之前,币价将维持区间震荡格局。
2、核心点位回顾:第一压力看93,000~94,500美元区域,第一支撑看89,500~91,000美元区域。
2、操作策略回顾:
• 中线策略:若市场维持84,000~94,500美元区间震荡,则继续持有65%左右的中线仓位(空单)。
• 短线策略:若币价维持84,000~94,500 美元区间震荡,则按照方案 A执行操作:
• 开仓:当币价反弹到93,000~94,500 美元区域并出现遇阻信号时,可建立30%的空头仓位。
• 风控:空单止损设于95,500 美元上方。
• 减仓:当币价下跌至86,000~86,500 美元区域出现企稳信号时,逐步清仓部分空单。
• 平仓:当币价下探至84,000美元附近出现企稳信号时,全部清仓获利了结。
图一
二、趋势模型判断:比特币未来走势及如何入场
结合市场运行,笔者依据自主构建的交易体系,从多模型与多维度等层面,对比特币走势结构进行深度剖析。
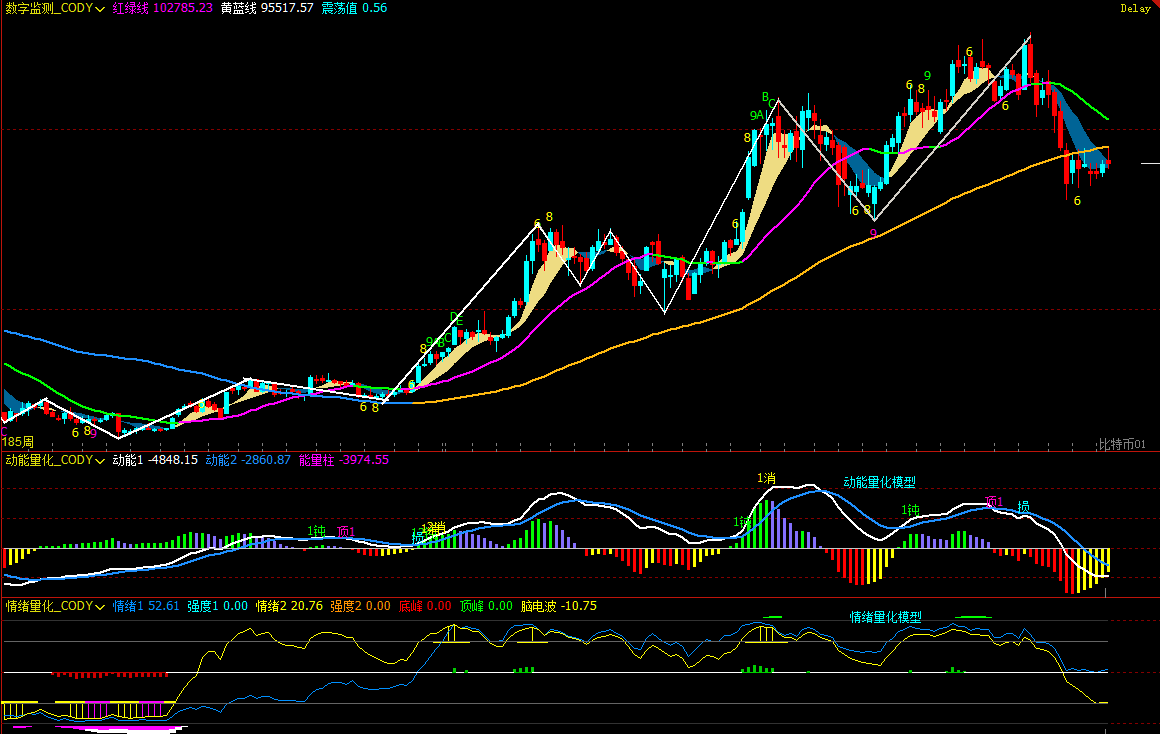
1、如(图二)所示,从周线图分析:
• 动能量化模型:技术指标显示,动能线在零轴下方收敛靠拢,同时负向能量柱持续萎缩,这表明下跌的速率放缓。但是,当前信号并未确认趋势已经发生反转。
动能量化模型预示:币价下跌指数:高
• 情绪量化模型:蓝色情绪线数值 52.61,强度为零;黄色情绪线数值 20.76,强度为零,顶峰数值是 0。
情绪量化模型预示:币价压力及支撑指数:中性
• 数字监测模型:币价跌破多空(黄蓝线)分界线已有 8 周时间。上周多头再次对该线发起冲击,但遭遇空头抵抗后回落。此次冲击未果,意味着空方仍掌控市场主导权。
数字监测模型预示:监测(顶底部)数字信号未出现;周 K 线收带上影线的十字星,跌幅约 0.57%。
以上数据预示:比特币周线进入空头趋势,需警惕震荡调整风险。
图二
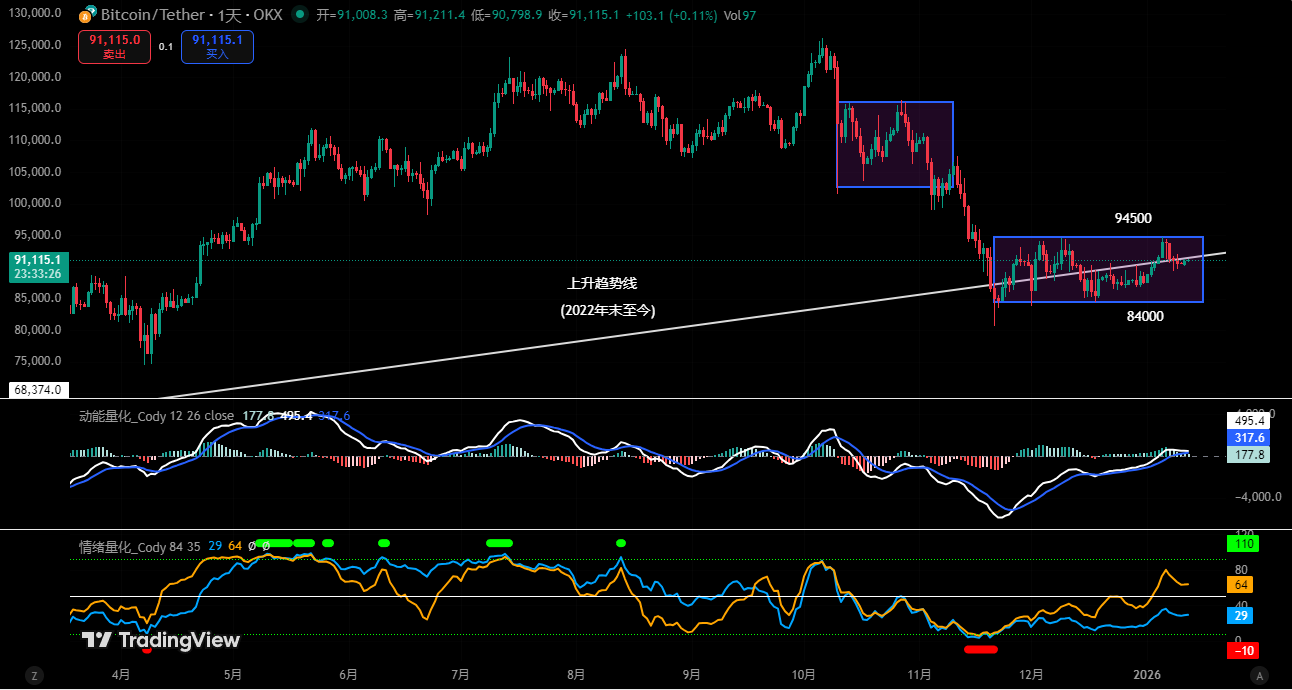
2、如(图三)所示,从日线图分析:
• 动能量化模型:上周整体呈现“先扬后抑”走势。前半周,动能线先后上穿零轴,正向量能柱持续放大;但后半段动能线又趋于粘合,量能柱明显萎缩,显示做多动能减弱。
动能量化模型预示:日线级别处于多空争夺阶段,关注零轴得失。
• 情绪量化模型:上周日收盘后,蓝色情绪线数值 28,强度为零;黄色情绪线数值 62,强度为零。
情绪量化模型预示:压力及支撑指数:中性
以上数据提示:日线级别处于多空分水岭,趋势方向还待进一步确认。
图三
三、本周行情预测:(01.12~01.18)
1、本周核心观点:
• 比特币预计将继续在84,000~94,500 美元区间内反复震荡,但需重点观察在区间两端的多空博弈。
• 向下破位:一旦有效跌破84,000美元,走势将转而向下,首要测试目标看80,000美元。
• 向上突破:若能强势站稳 94,500美元,则有望开启一轮较有力度的技术反弹行情。
2、核心压力位:
• 第一压力区:92,000~93,000美元区域
• 第二压力区:94,500~95,000美元区域
• 重要压力位:97,500~99,500美元附近。
3、核心支撑位:
• 第一支撑位:89,500~91,000美元区域
• 第二支撑位:86,000~86,500美元区域
• 第三支撑位:83,500~84,500美元区域
• 重要支撑位:80,000美元附近。
四、本周操作策略(排除突发消息影响):(01.12~01.18)
1、 中线策略:
• 在币价未有效突破94,500美元前,继续保持65%左右的中线仓位(空单)。
• 若币价成功突破并站稳94,500美元后,清空全部中线仓位(空单),持币观望。
2、 短线策略:利用30%仓位,设置止损点,依据支撑及压力位,寻找做“价差”机会。(以 30 分钟作为操作周期)。
3、 为动态应对市场演变并结合实时模型信号,我们拟定A/B/C三套短线操作预案,:
• 方案 A:若币价维持84,000~94,500 美元区间震荡:
• 开仓:根据核心压力位判断(见本周行情预测),当反弹至93,000~94,500 美元区域并结合小时线模型顶部信号,可建立30%的空头仓位。
• 风控:空单初始止损设于成本价上方 1.5%附近(即 1.015*成本价)。
• 平仓:当下探至核心支撑位附近并结合模型信号,可逐步清仓获利了结。
• 方案 B:若币价有效跌破84,000 美元支撑:
• 开仓:若向下有效跌破核心支撑位,可追空建立30%的空头仓位。
• 风控:空单初始止损设于成本价上方 1.5%附近(即 1.015*成本价)。
• 平仓:当下探至80,000美元附近并结合模型信号,可逐步清仓获利了结。
• 方案 C:若成功突破并站稳94,500 美元阻力:
• 开仓:若成功突破核心阻力位并结合模型信号,可建立30%的多头仓位。
• 风控:多单初始止损设于成本价下方 1.5%附近(即 0.985*成本价)。
• 平仓:当反弹至97,500美元附近并结合模型信号,可逐步清仓获利了结。
五、宏观与流动性周观察:(01.12~01.18)
一、FOMC 官员密集讲话:政策预期再校准的重要窗口
本周,美联储系统将迎来罕见的官员密集发声窗口。多位具备不同年度投票权的联储主席及理事,将围绕经济前景、通胀走势与政策立场集中表态,为市场判断未来货币政策路径提供关键信息。
从发言阵容来看,既涵盖 FOMC 永久票委,也包括 2026—2028 年度轮值票委,信息维度覆盖短期政策取向与中期决策框架,对利率预期结构具有重要指引意义。
主要事件包括:
周二:2027 年 FOMC 票委、亚特兰大联储主席博斯蒂克发表讲话;
2027 年 FOMC 票委、里奇蒙联储主席巴尔金发表讲话;
FOMC 永久票委、纽约联储主席威廉姆斯发表讲话;
2028 年 FOMC 票委、圣路易联储主席穆萨莱姆发表讲话;
周三:里奇蒙联储主席巴尔金再次发表讲话;
2026 年 FOMC 票委、费城联储主席哈克就经济前景发表讲话;
美联储理事沃勒在公开场合发表讲话;
周四:2026 年 FOMC 票委、明尼阿波利斯联储主席卡什卡利发表讲话,同时 2027 年 FOMC 票委、亚特兰大联储主席博斯蒂克再次发声;
美联储公布经济状况褐皮书;
FOMC 永久票委、纽约联储主席威廉姆斯在活动上致开幕词;
博斯蒂克就经济与政策议题再次发表讲话;
周五:里奇蒙联储主席巴尔金围绕区域经济前景发表讲话。
二、市场关注焦点:是否提前释放政策拐点信号
在通胀边际回落、就业市场出现降温迹象的背景下,市场核心关注点在于官员是否继续强调“较长时间维持限制性政策”的必要性,抑或开始为下一阶段政策转向提供更为明确的前瞻指引。
需要指出的是,官员讲话更多影响的是预期结构而非短期方向,其作用通常体现在利率曲线、美元指数以及风险资产估值体系的中期调整之中。
三、对风险资产与加密市场的潜在影响
若多位官员延续偏谨慎立场,强调通胀路径仍具不确定性,短期内或对风险偏好形成压制;
但若发言逐步承认经济放缓趋势,并弱化进一步收紧政策的必要性,则有助于中期宽松预期重新定价。
对比特币等加密资产而言,美联储官员发声的核心影响在于流动性预期与折现率变化,其效果偏中期,更适合作为宏观定价参考而非短线交易信号。
六、特别提示:
1. 开仓时:立即设置初始止损位。
2. 盈利达 1%时:将止损位移至开仓成本价(盈亏平衡点),确保本金安全。
3. 盈利达 2%时:将止损位移至盈利 1%的位置。
4. 持续跟踪:此后币价每再盈利 1%,止损位就同步移动 1%,动态保护并锁定已有利润。
(注:上述 1%的盈利触发阈值,投资者可根据自身风险偏好与标的波动性灵活调整。)
金融市场瞬息万变,所有行情分析及交易策略均需动态调整。本文所涉及的全部观点、分析模型与操作策略,均源自个人技术分析,仅为个人交易日志之用,不构成任何投资建议或操作依据。市场有风险,投资需谨慎,DYOR。