Rebound or liquidation? SOL at a make or break point!

ambcryptoPublished on 2026-07-10Last updated on 2026-07-10

Abstract

Solana (SOL) traders are facing a critical juncture as market sentiment hits yearly lows. Trading volume has plummeted to approximately $2.27 billion, its lowest in 2026, while negative sentiment has surged significantly. This frustration stems from SOL's price performance lagging behind its growing ecosystem activity. Despite the prevailing negativity, which can sometimes precede a bullish reversal, the derivatives market shows a heavy skew towards long positions, with $7.4 billion in long exposure versus $3.1 billion in shorts. A major cluster of long liquidations sits around $61-$62, posing a risk if the price declines. Although technical indicators like the RSI are neutral and the MACD is positive, the upward momentum is cooling. SOL's price, near $77.95, is testing resistance. The crowded long positions remain a potential source of selling pressure, meaning SOL needs to break above recent highs to rebuild trader confidence and avoid a deeper downturn.

Solana [SOL] traders are openly losing confidence in the market. However, another set of long positions may still be open. Hence, the question: Will SOL rebound or fall and experience further downside?

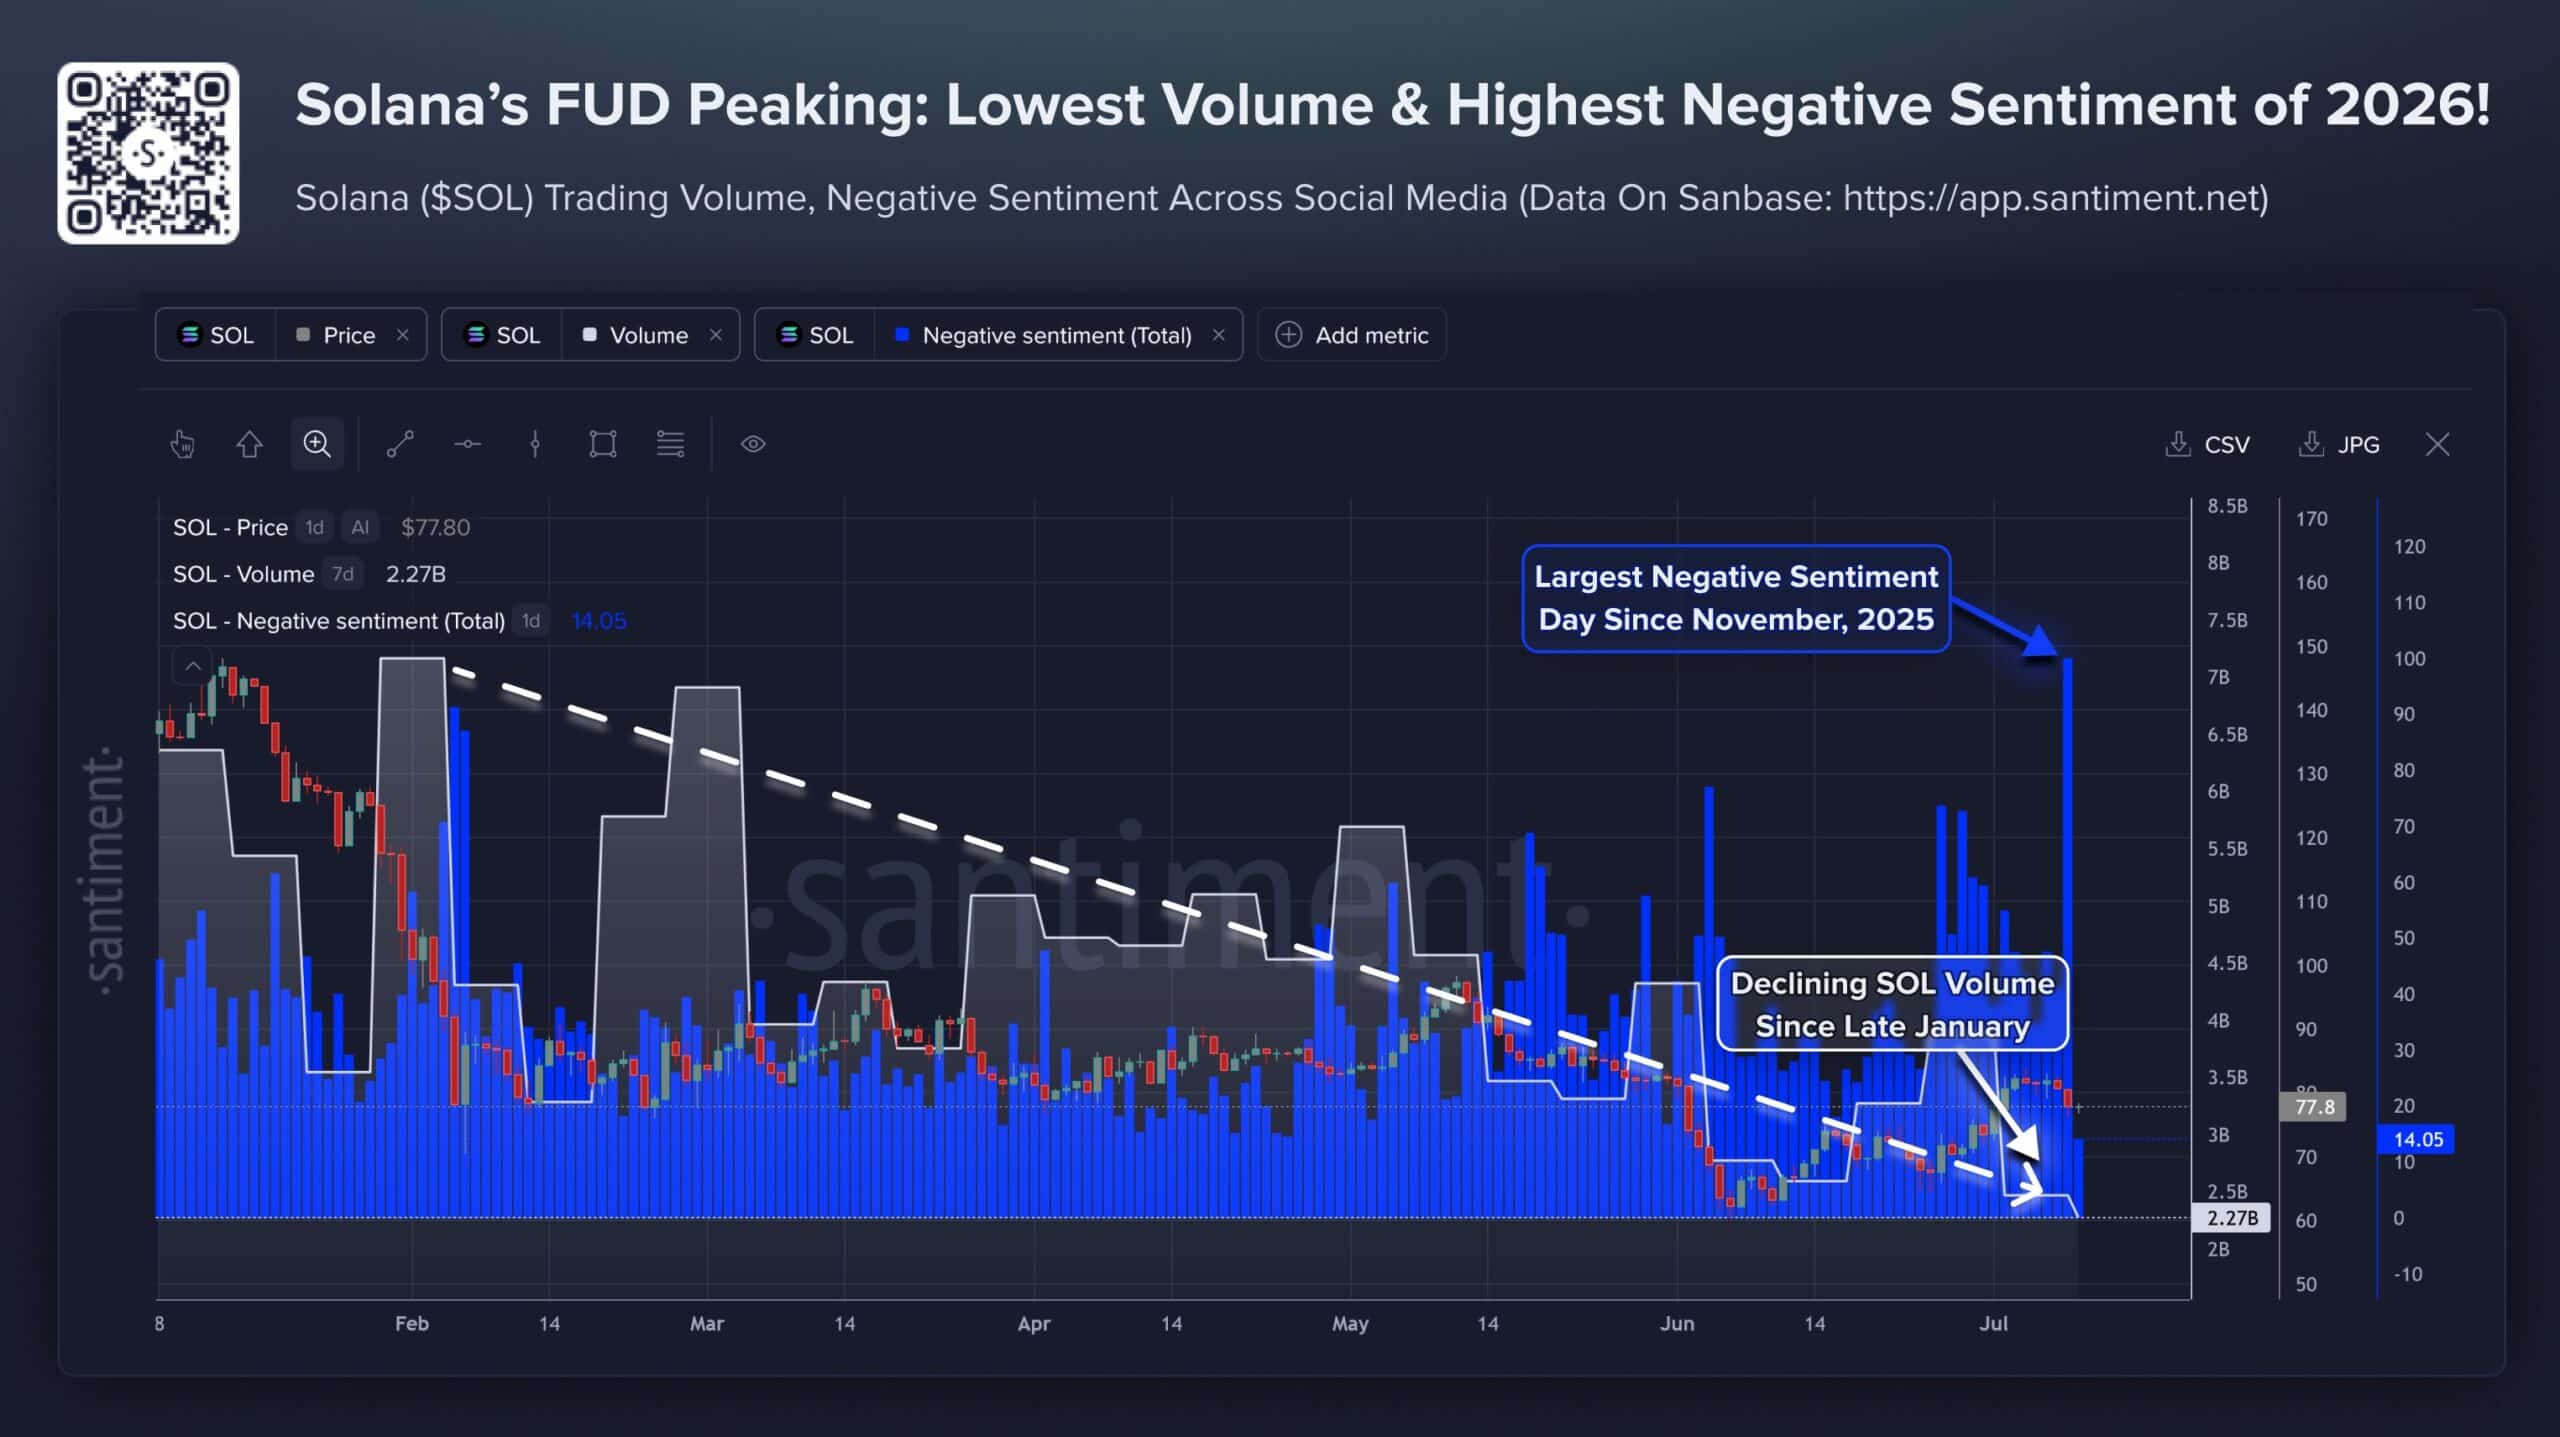
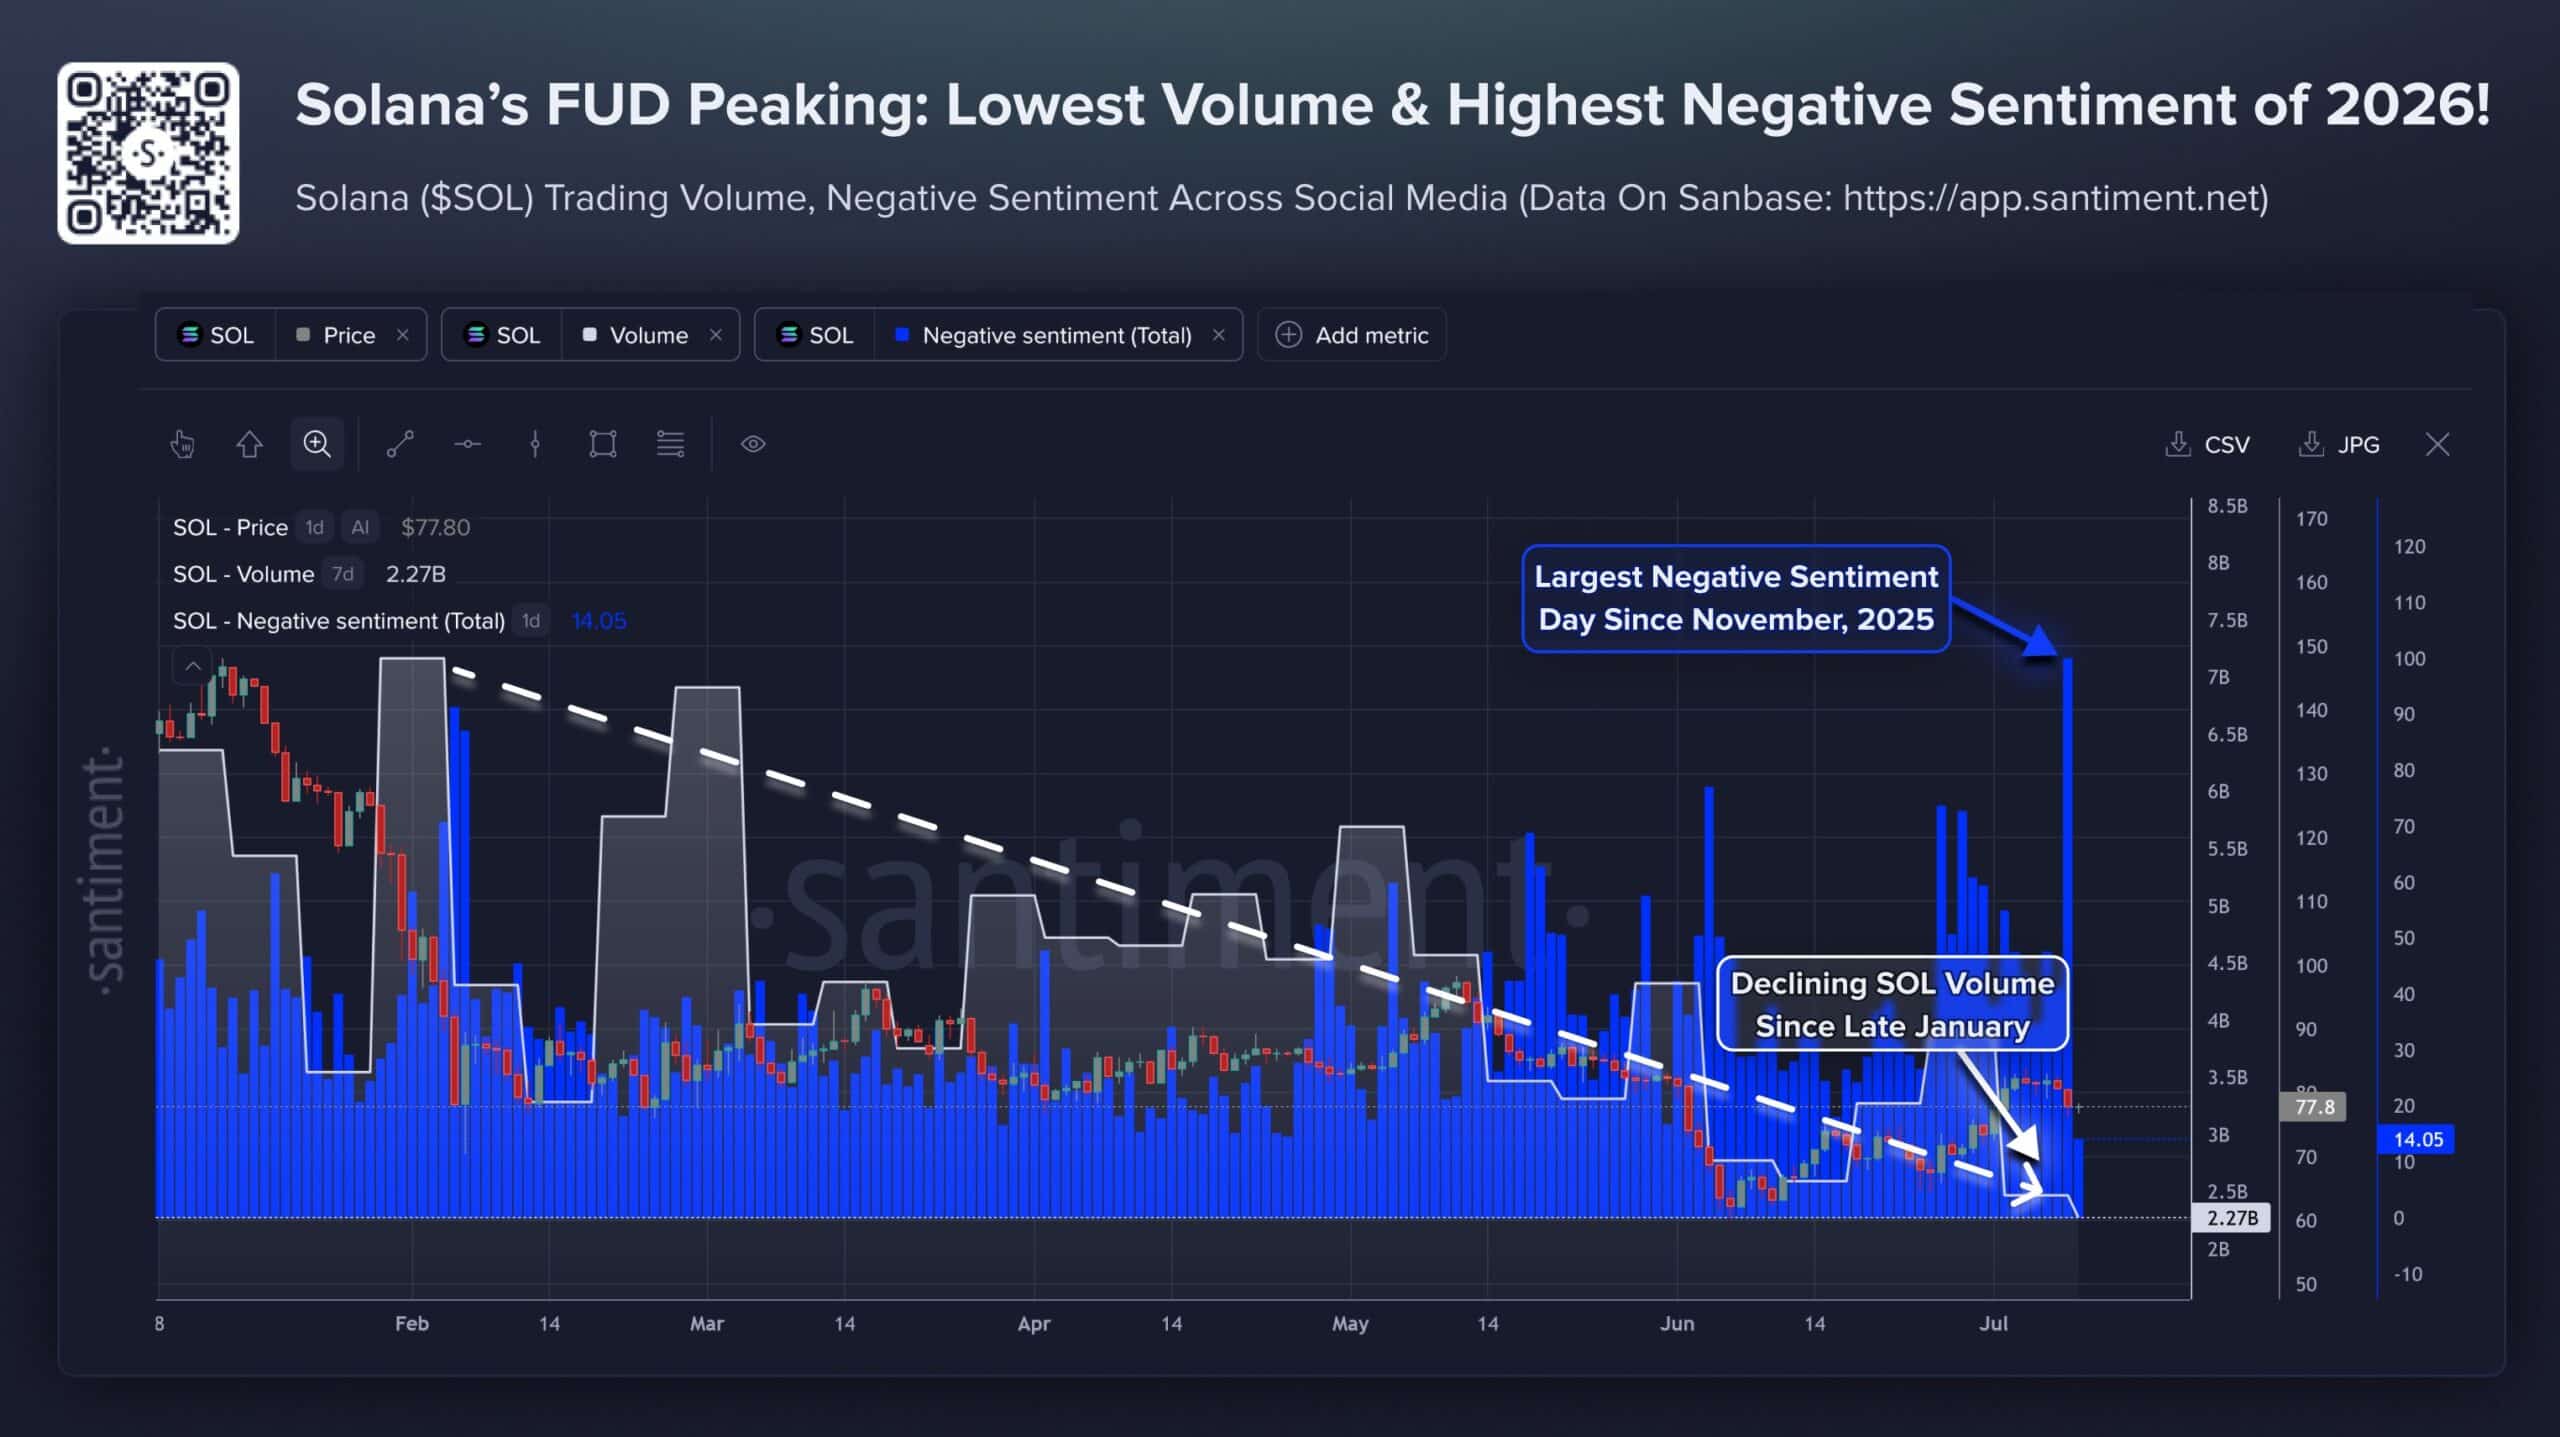
Solana sentiment and trading activity at YTD lows

At the time of writing, SOL’s trading volume had fallen to around $2.27 billion – Its lowest level in 2026. Meanwhile, the negative sentiment score also shot up to 14.05.

This has been the biggest wave of negativity around the token since November 2025.
Source: Santiment Intelligence

Much of the frustration comes from the gap between Solana’s growing ecosystem and its price performance. Despite pickup around the tokenized stocks and RWA narratives, traders are yet to see light.

Note that extreme negativity can sometimes make room for an unexpected move up. As it stands, even a modest return of demand could lead to a positive price move.

There’s a catch though!

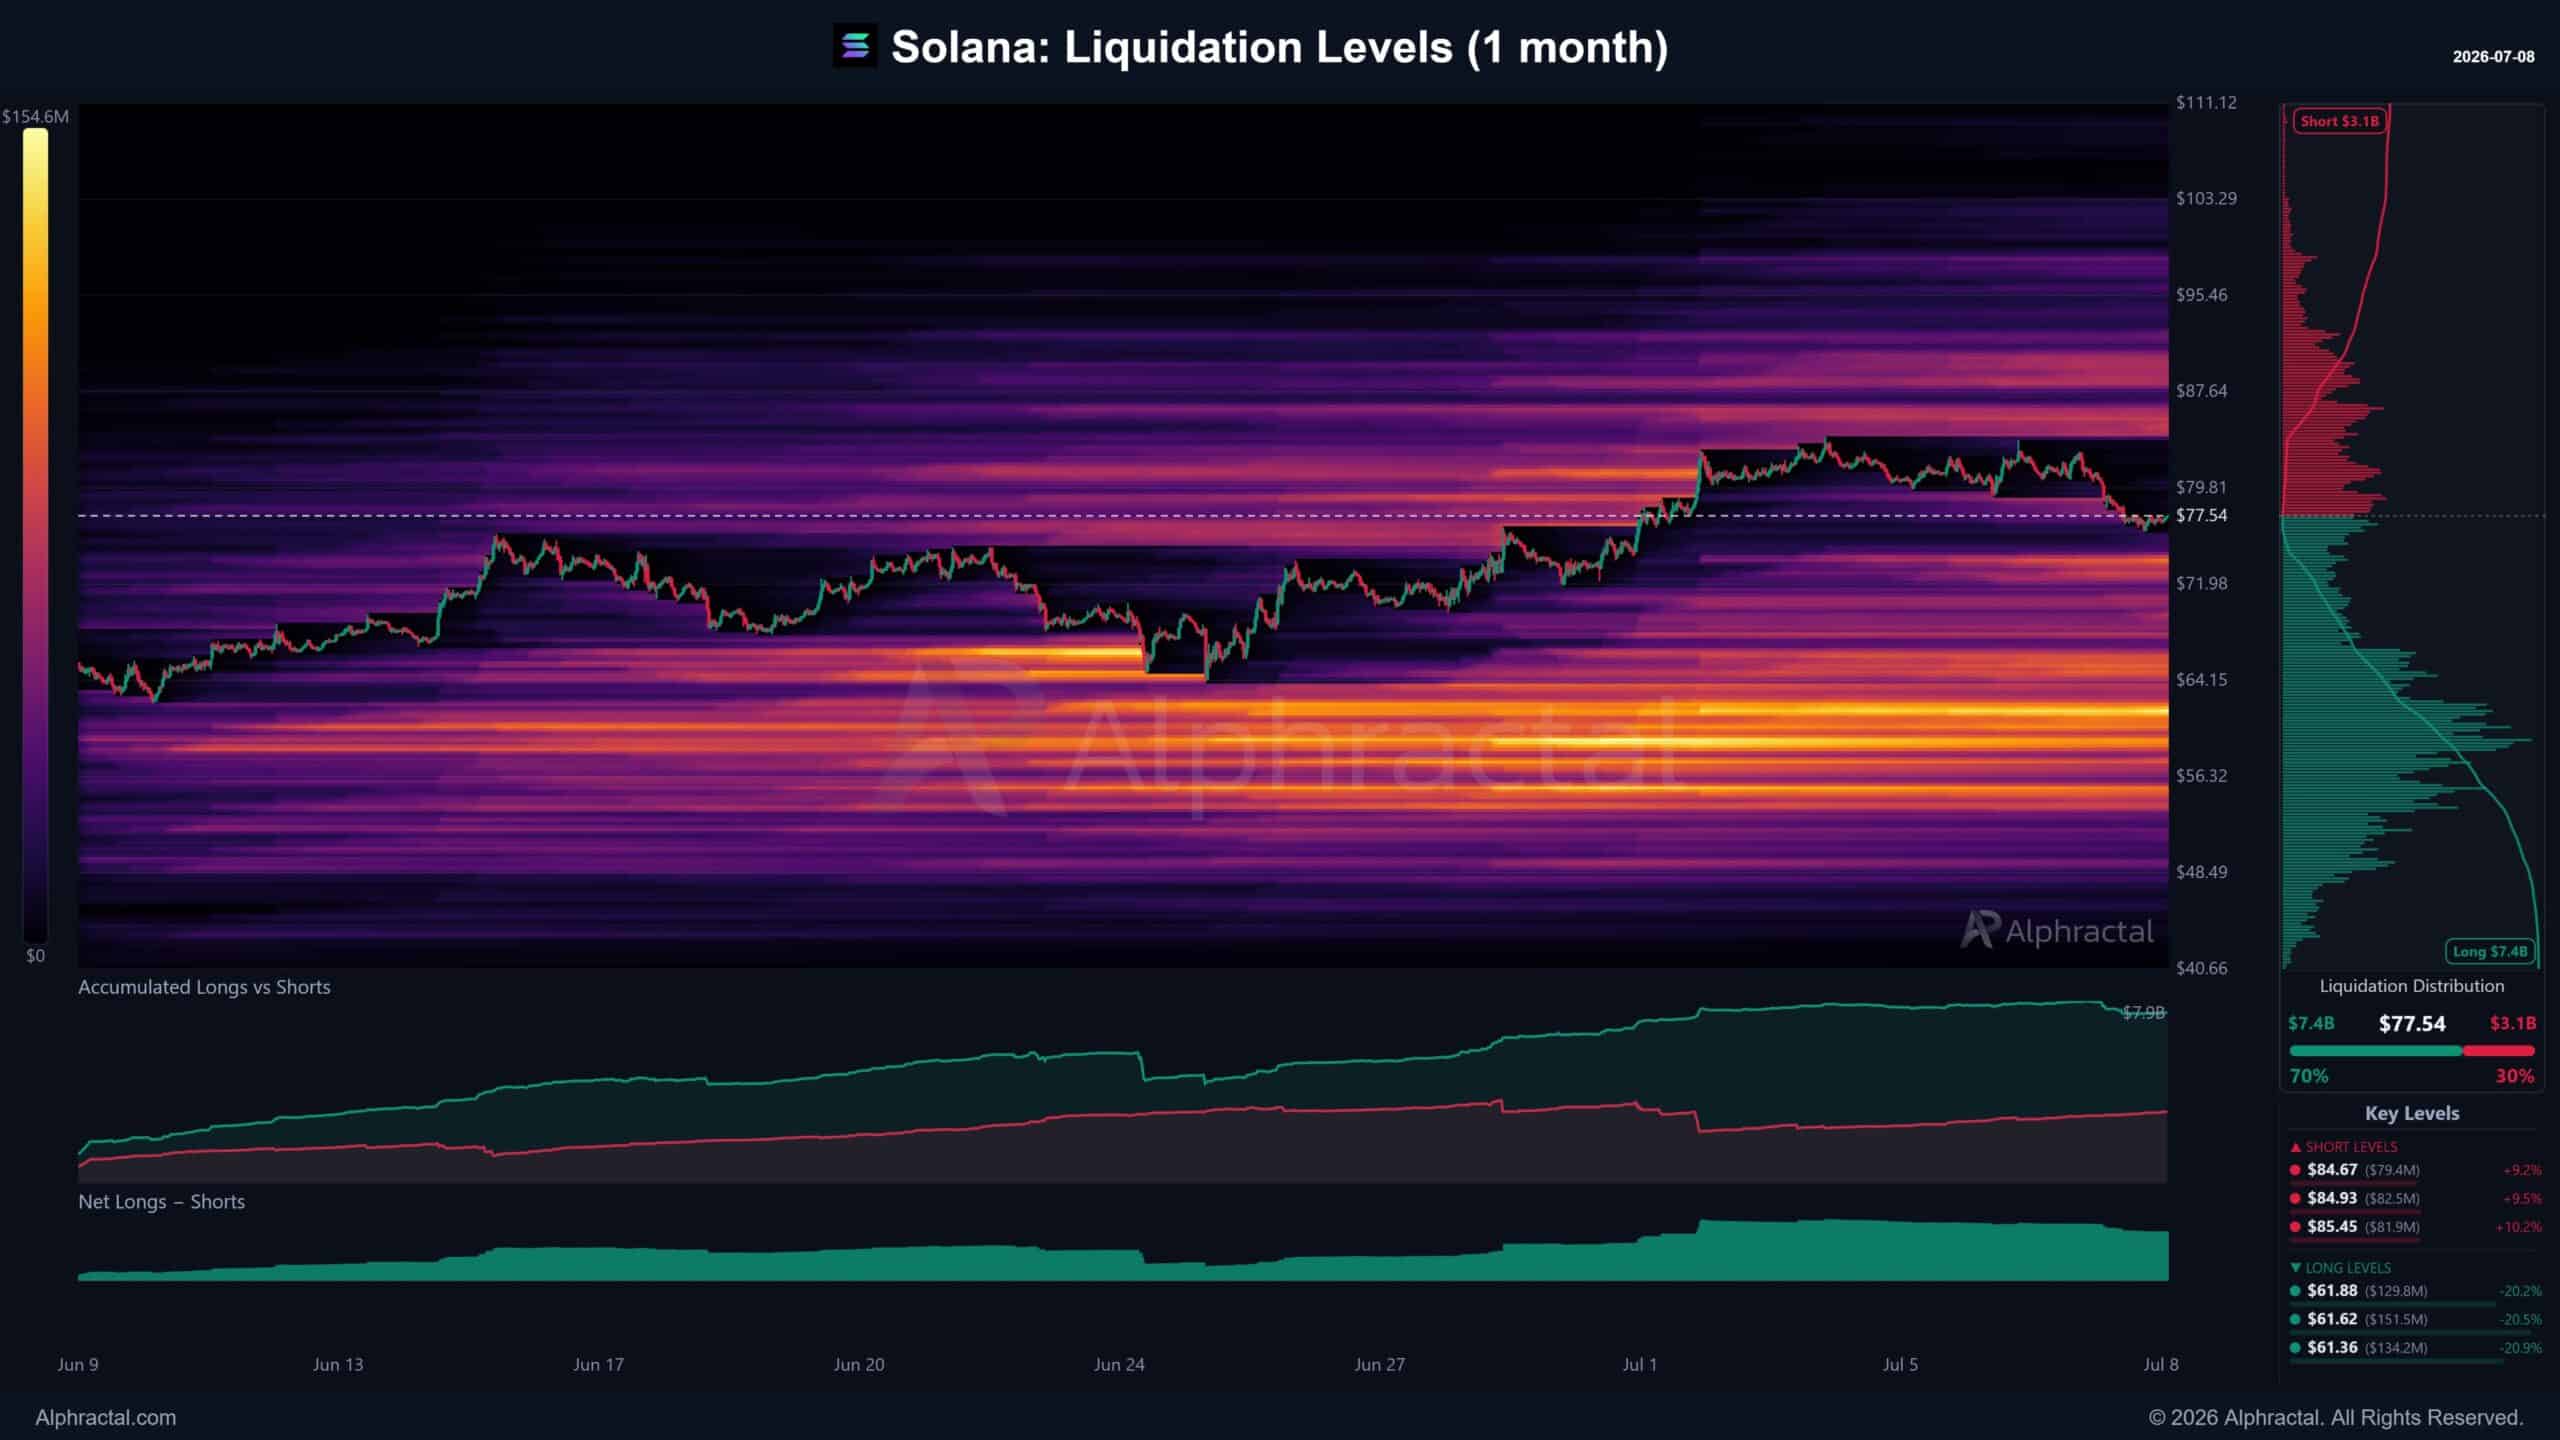
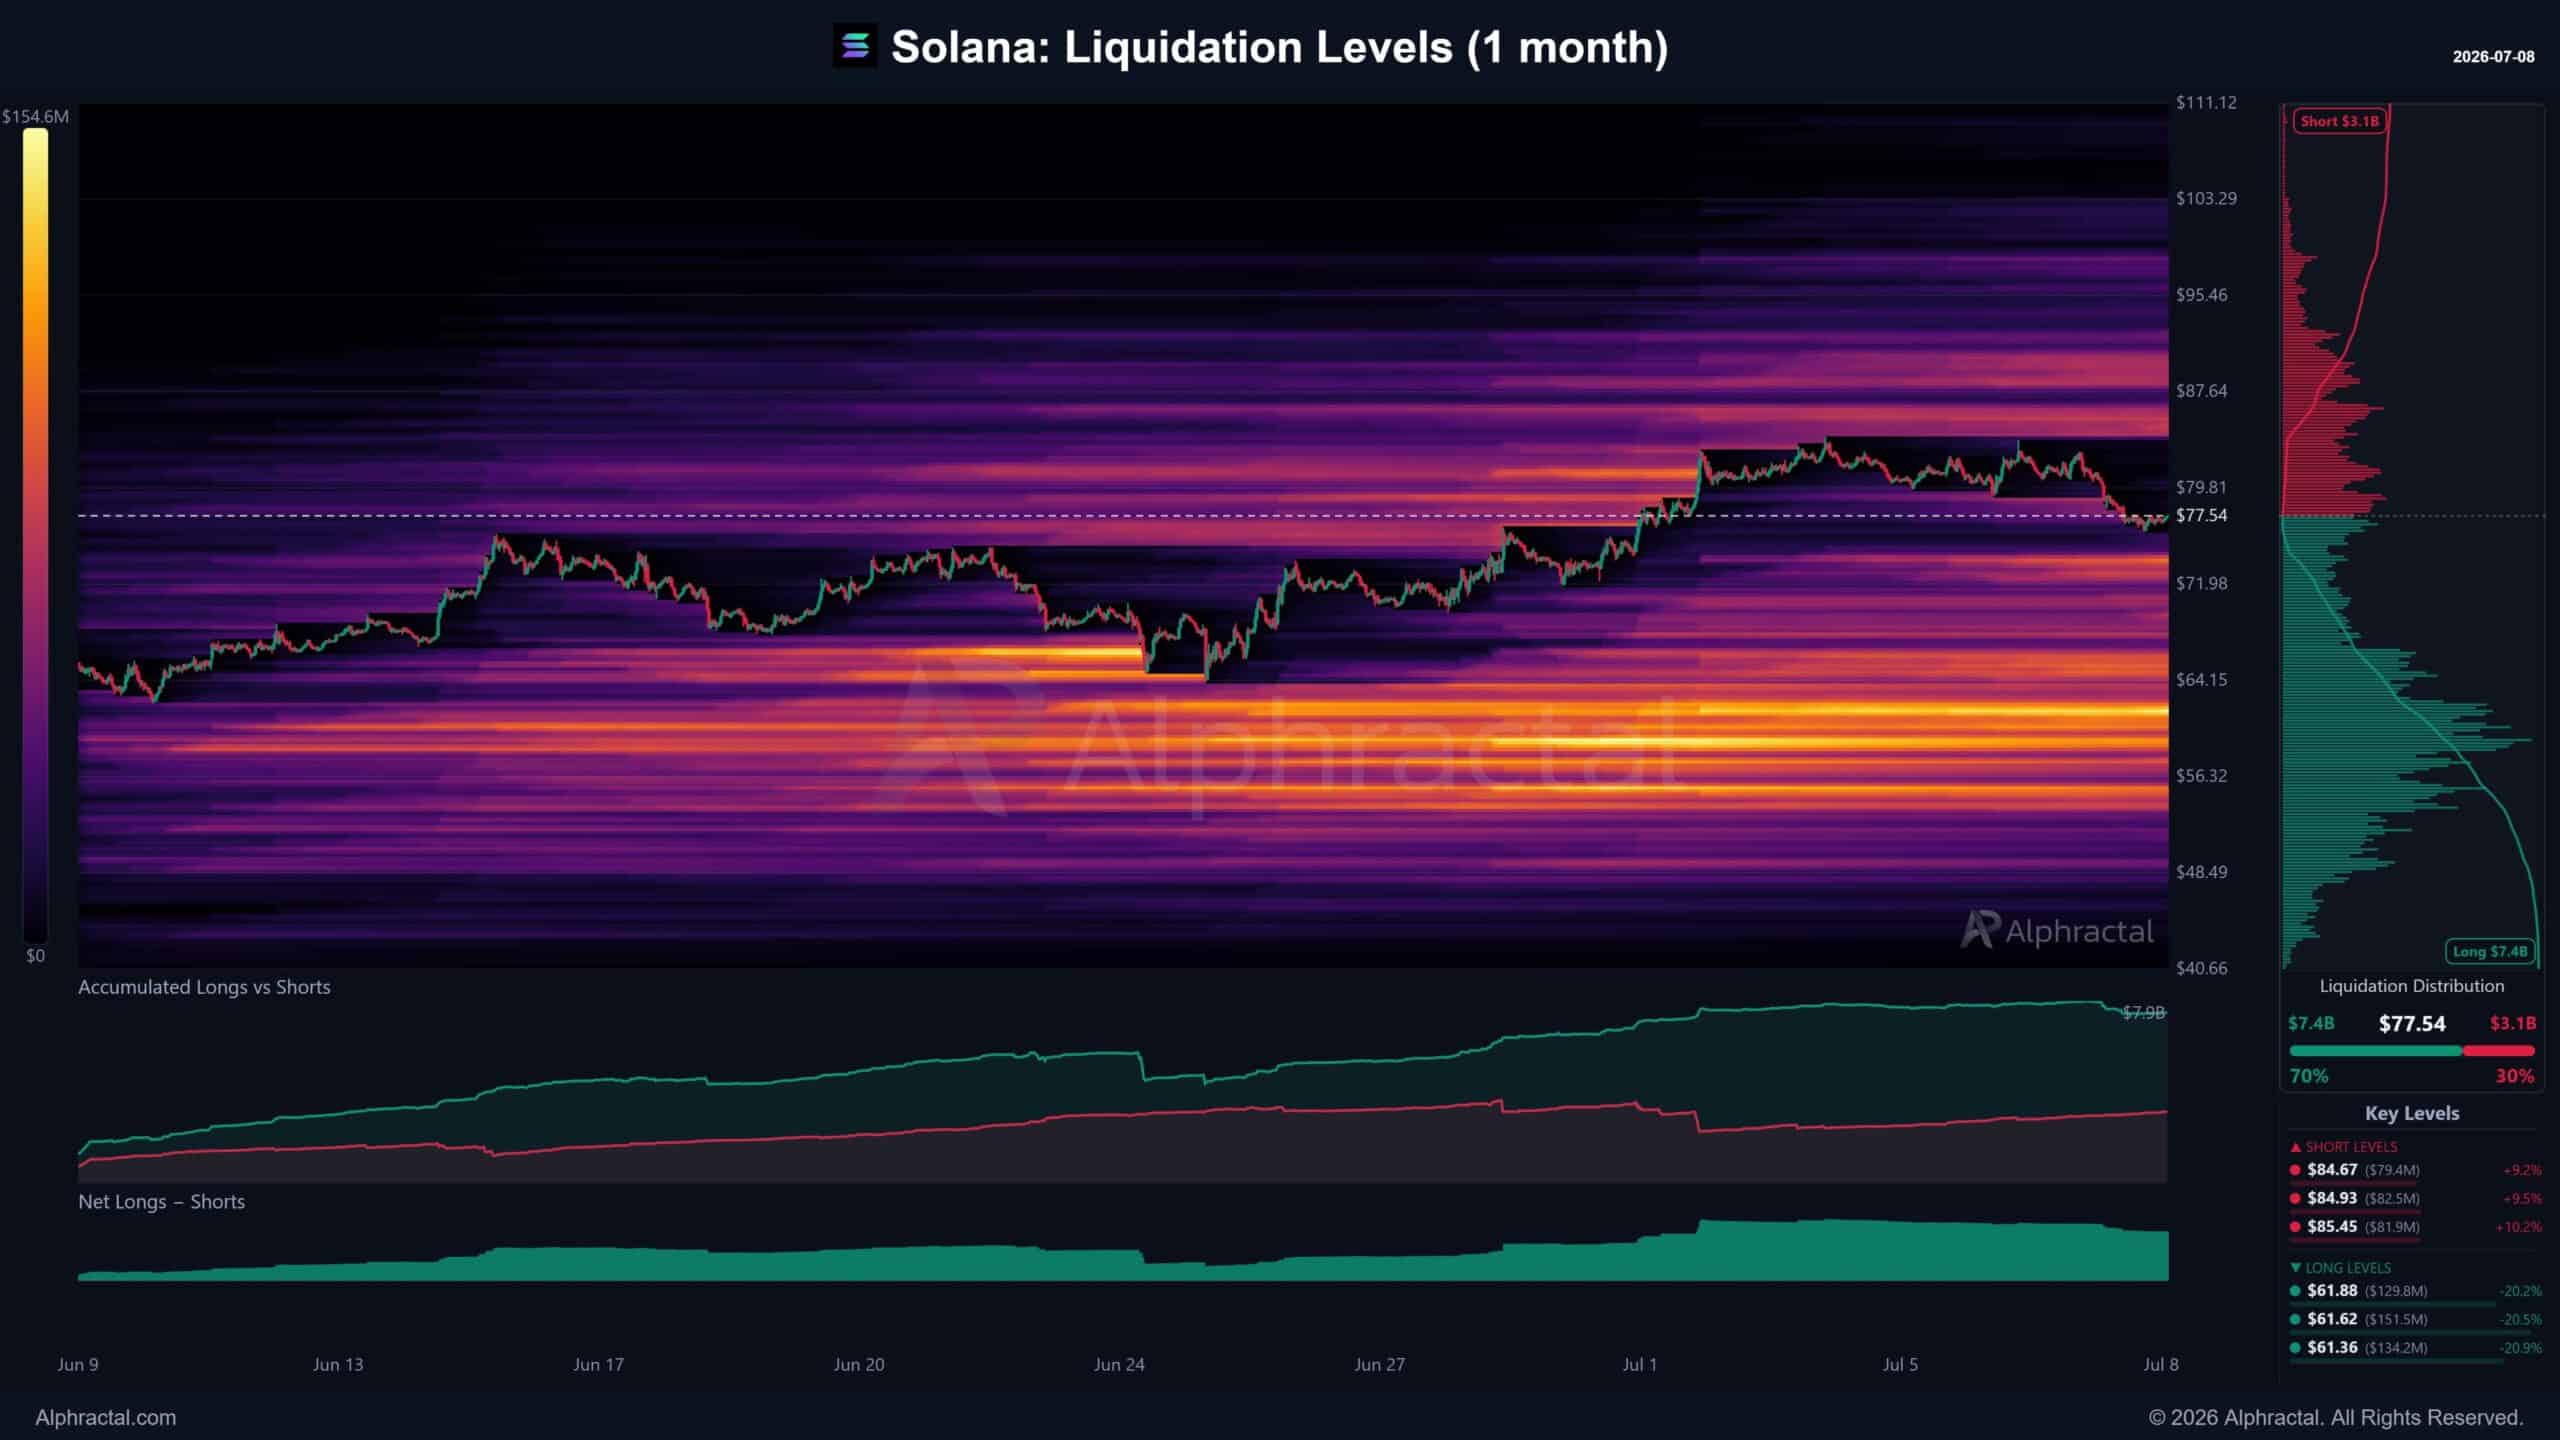
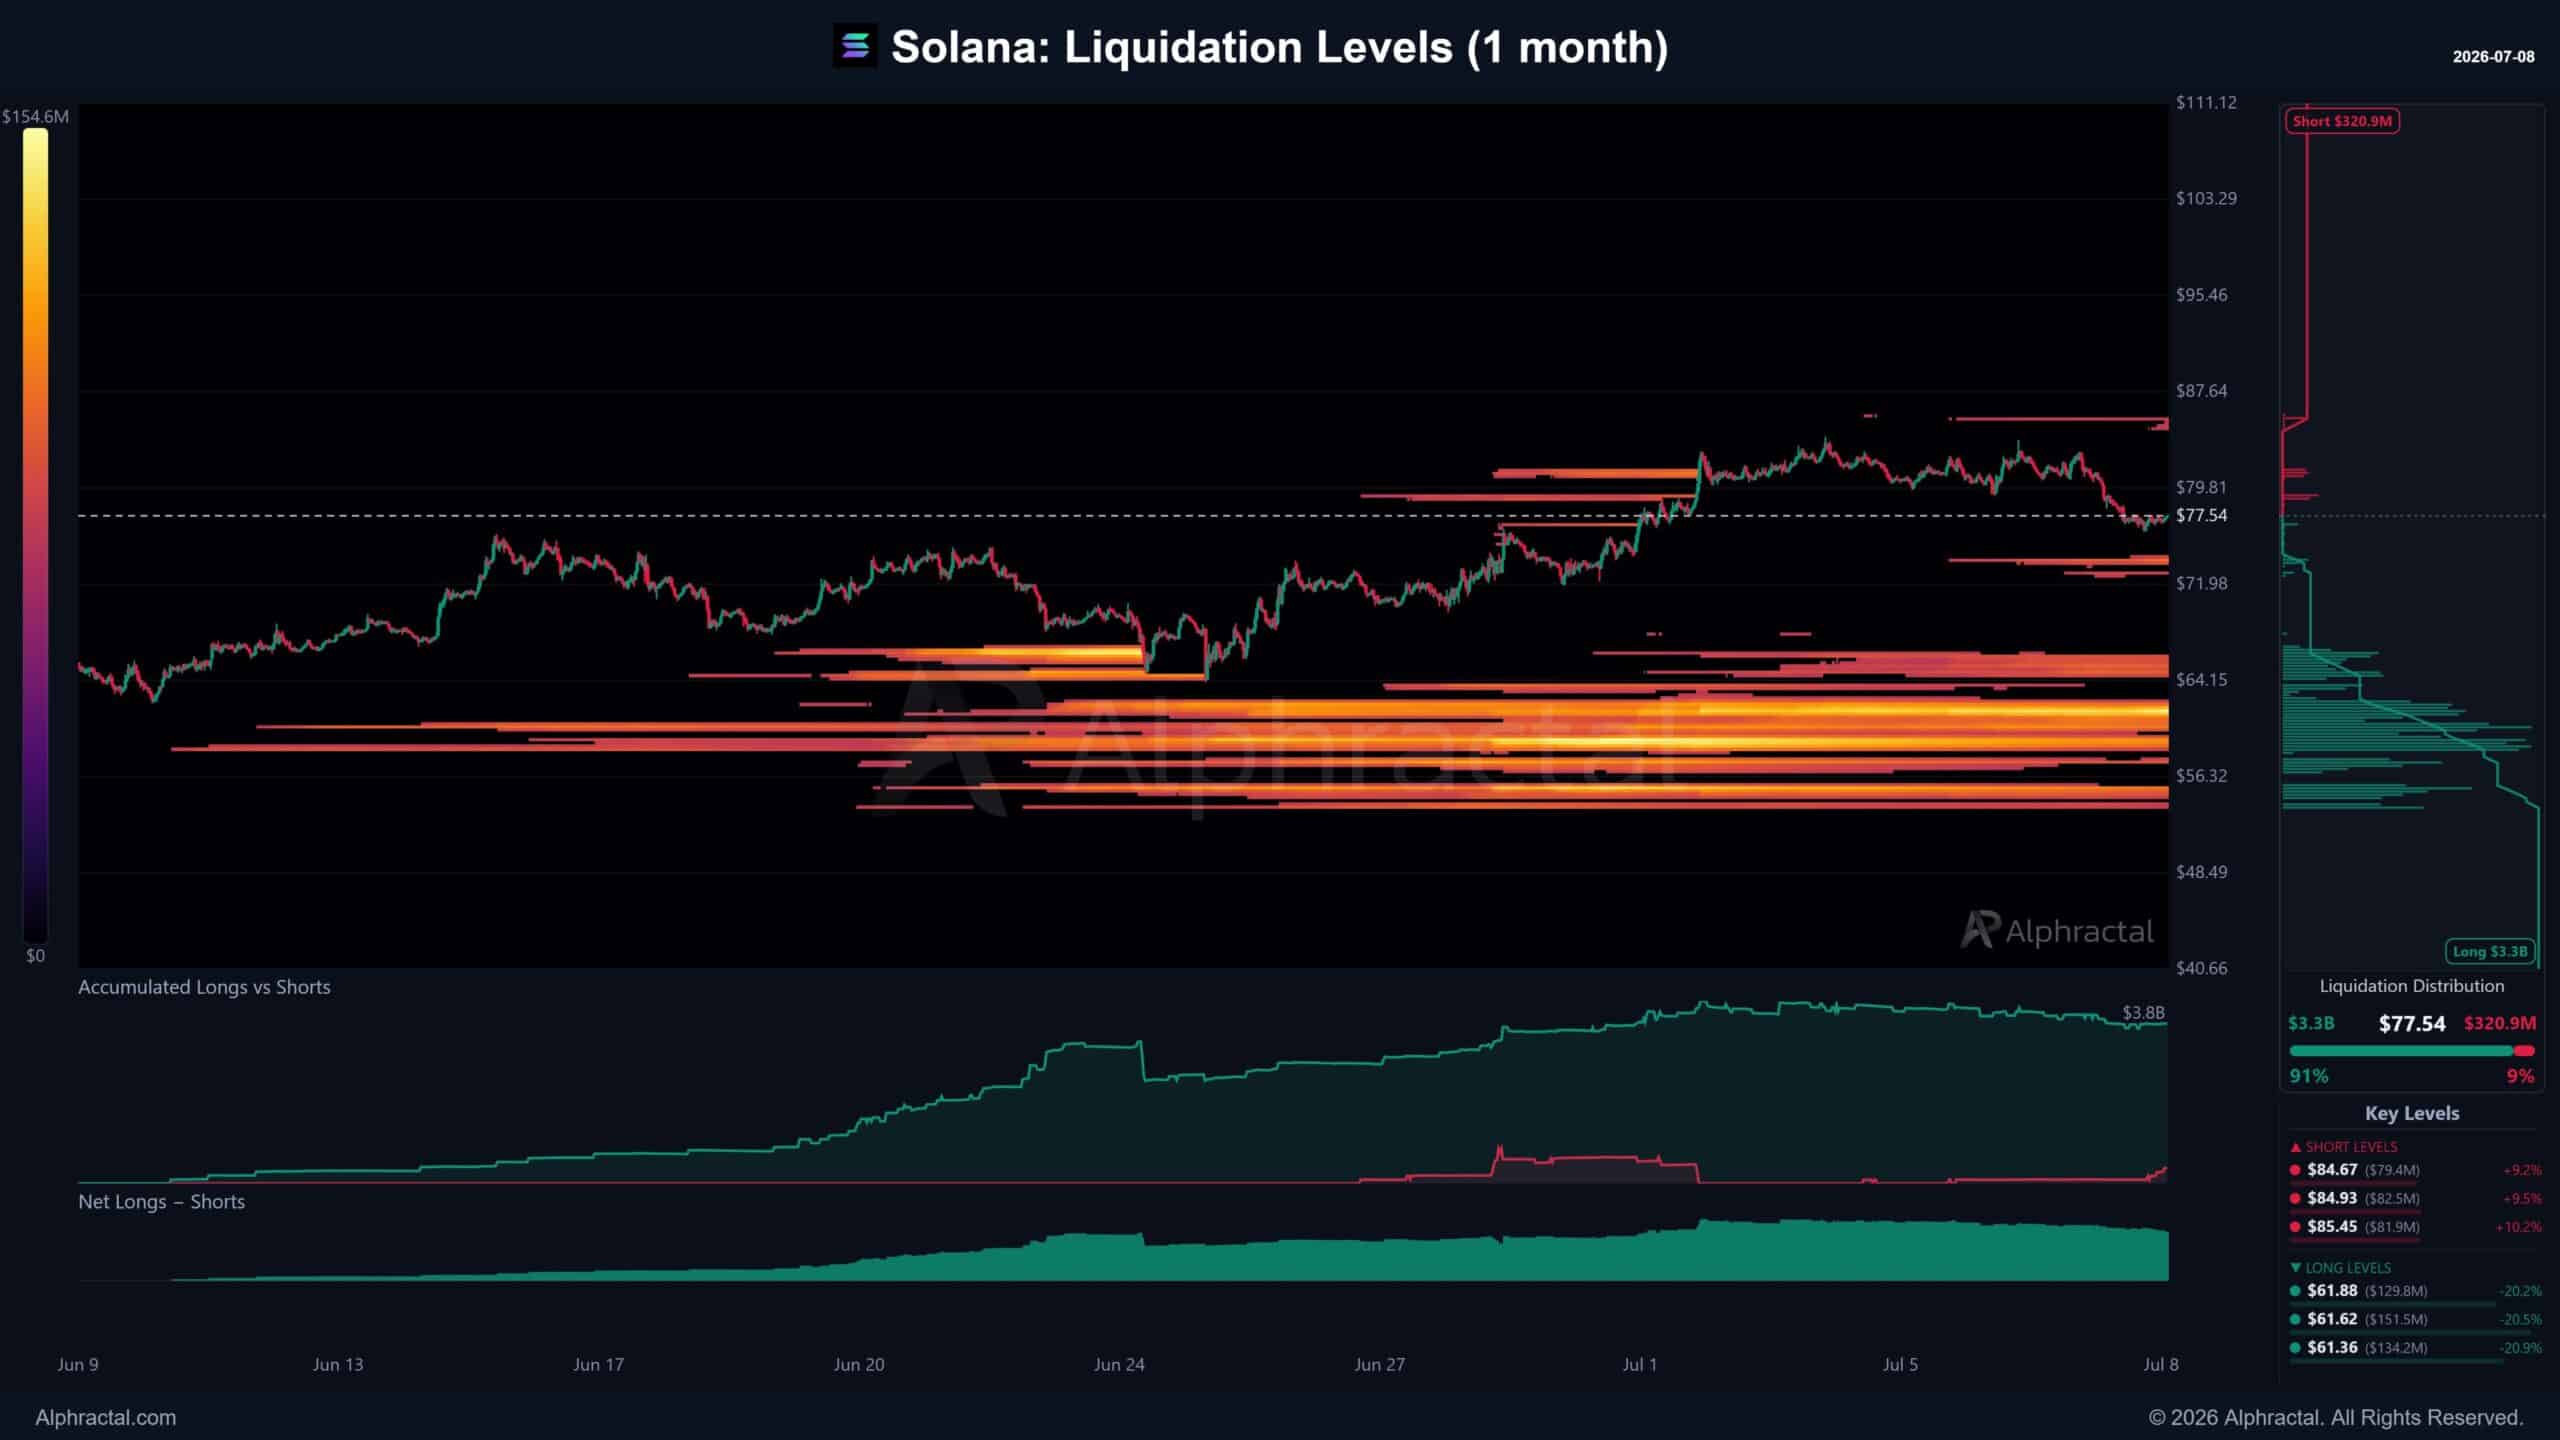
Solana’s derivatives market did seem inclined towards long positions though. In fact, the liquidation map showed around $7.4 billion in long exposure, compared to roughly $3.1 billion in shorts.
Source: Alphractal

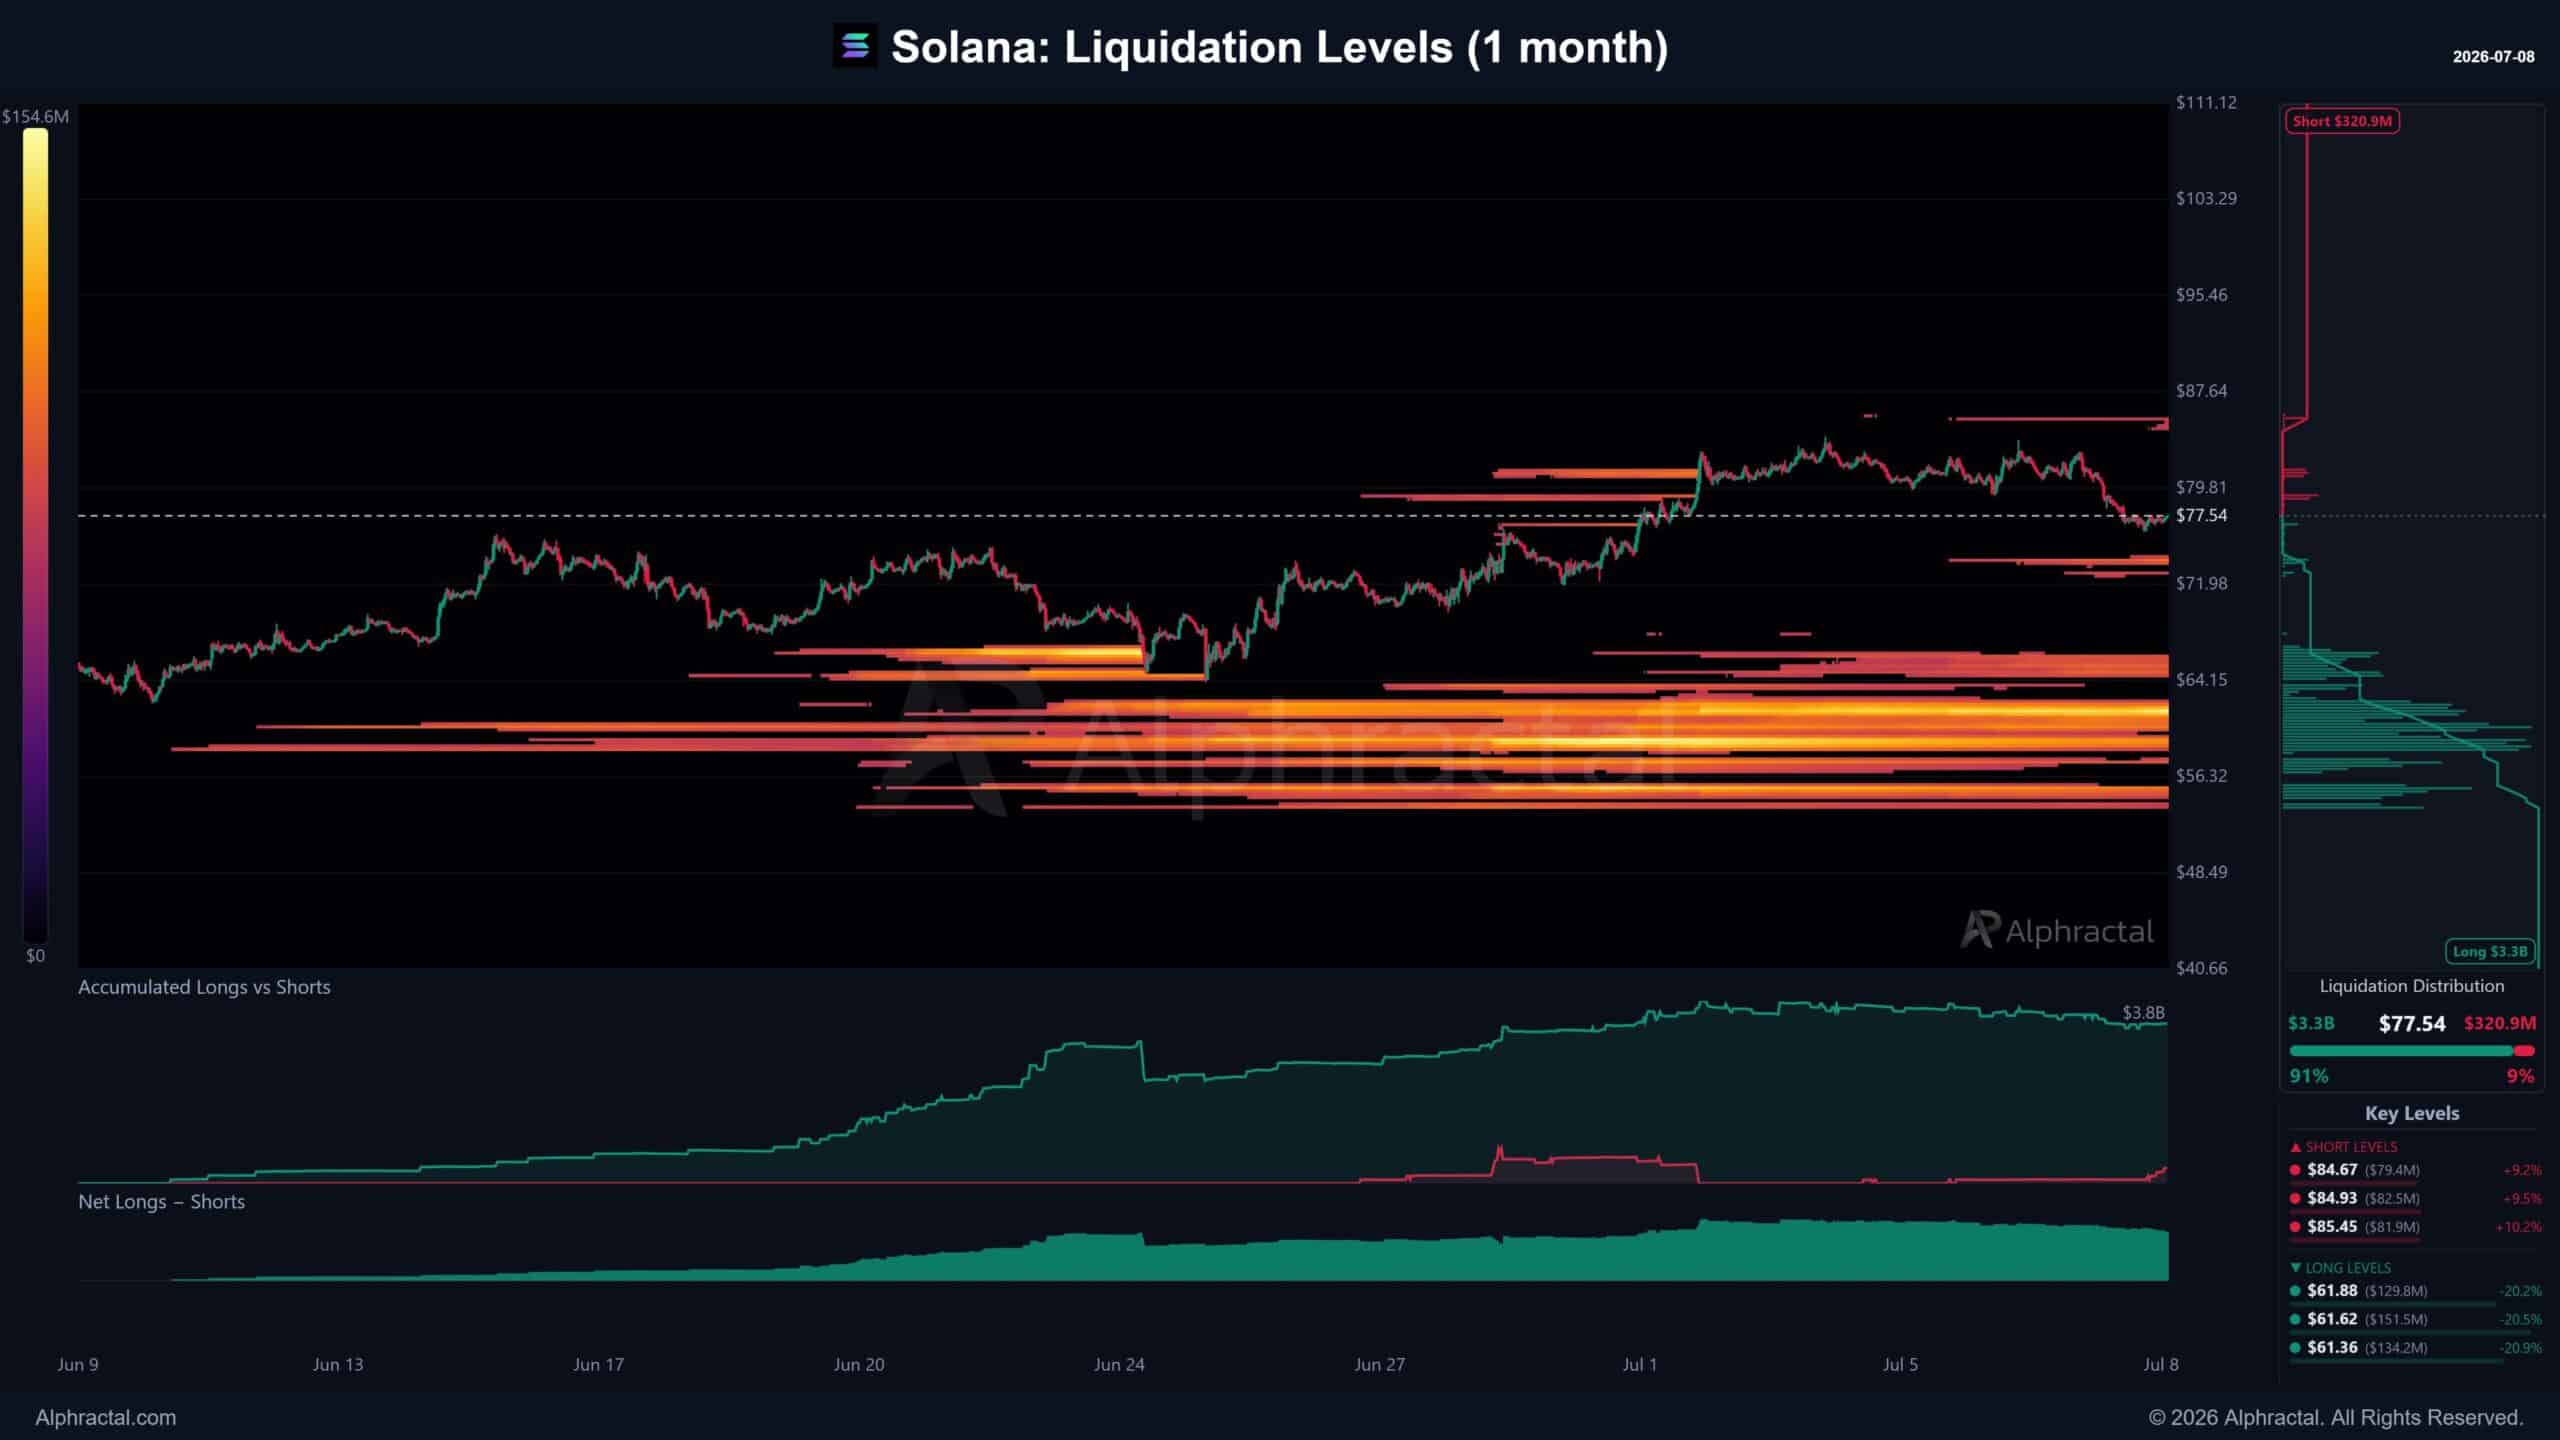
The largest long liquidation cluster was at around $61-$62, roughly 20% below the press time price.
Source: Alphractal

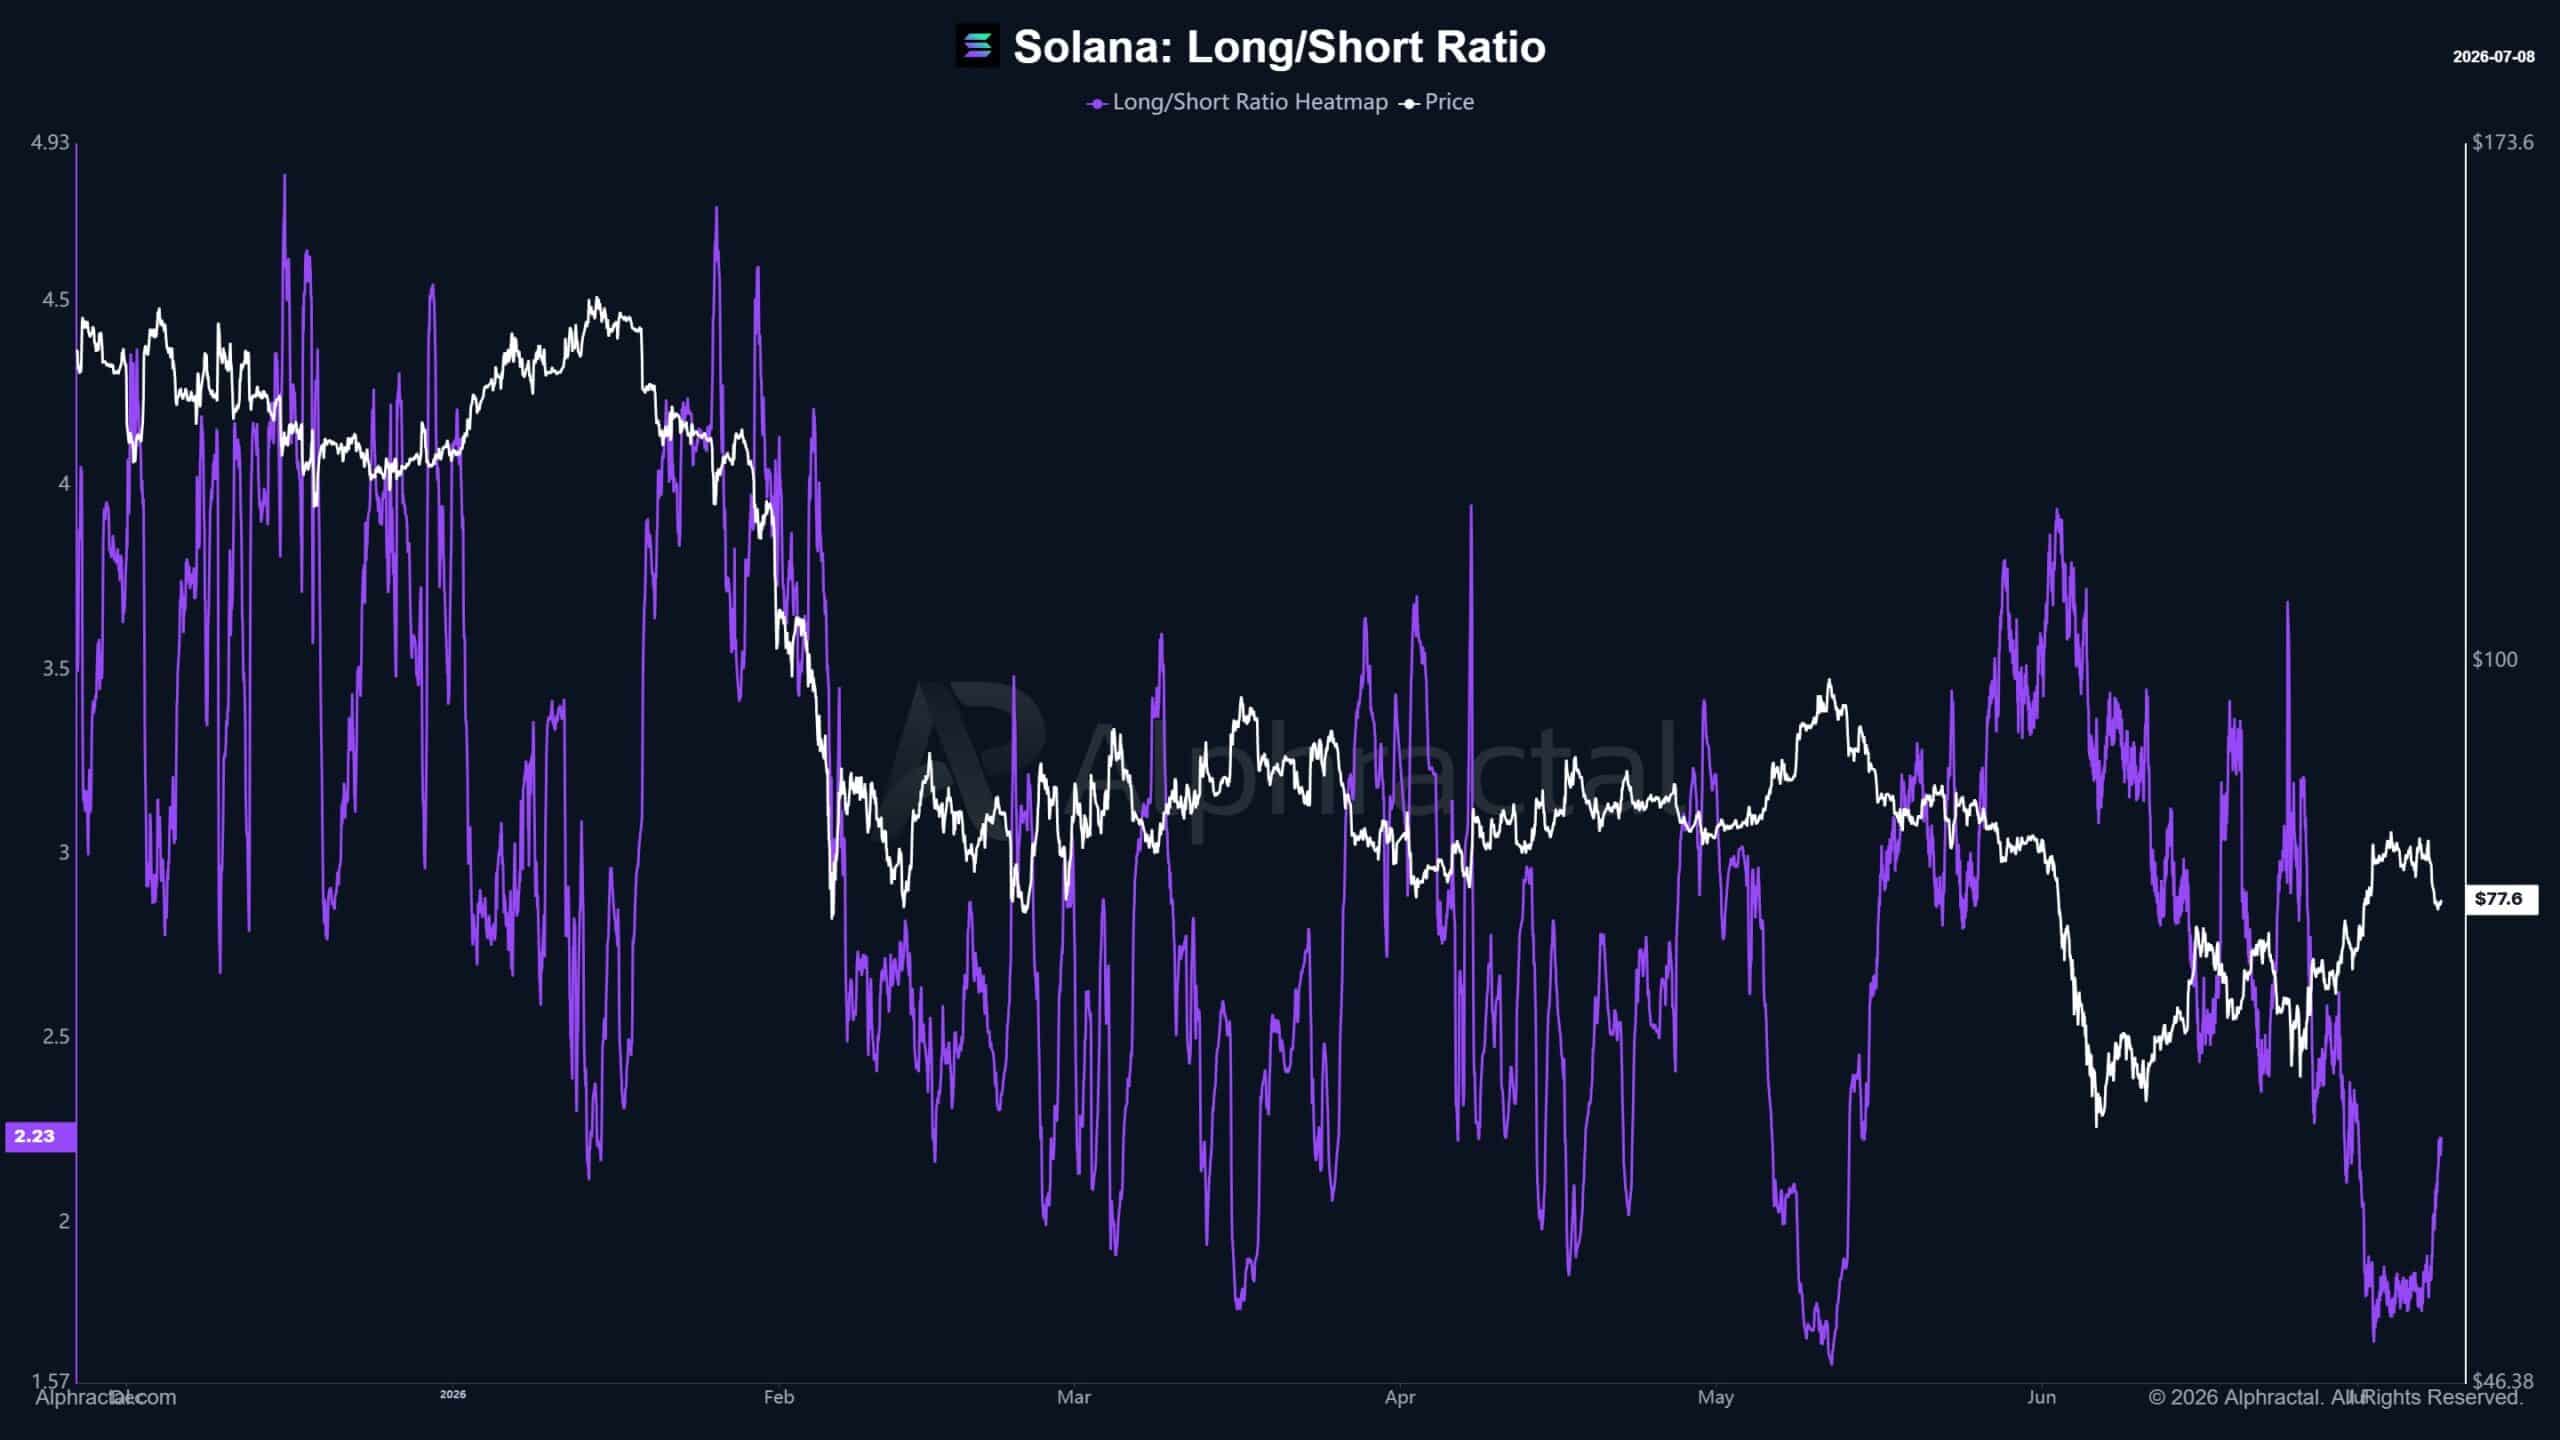
Meanwhile, the long/short ratio across major exchanges had started recovering and was near 2.23 at press time. Traders appeared to be bullish again.
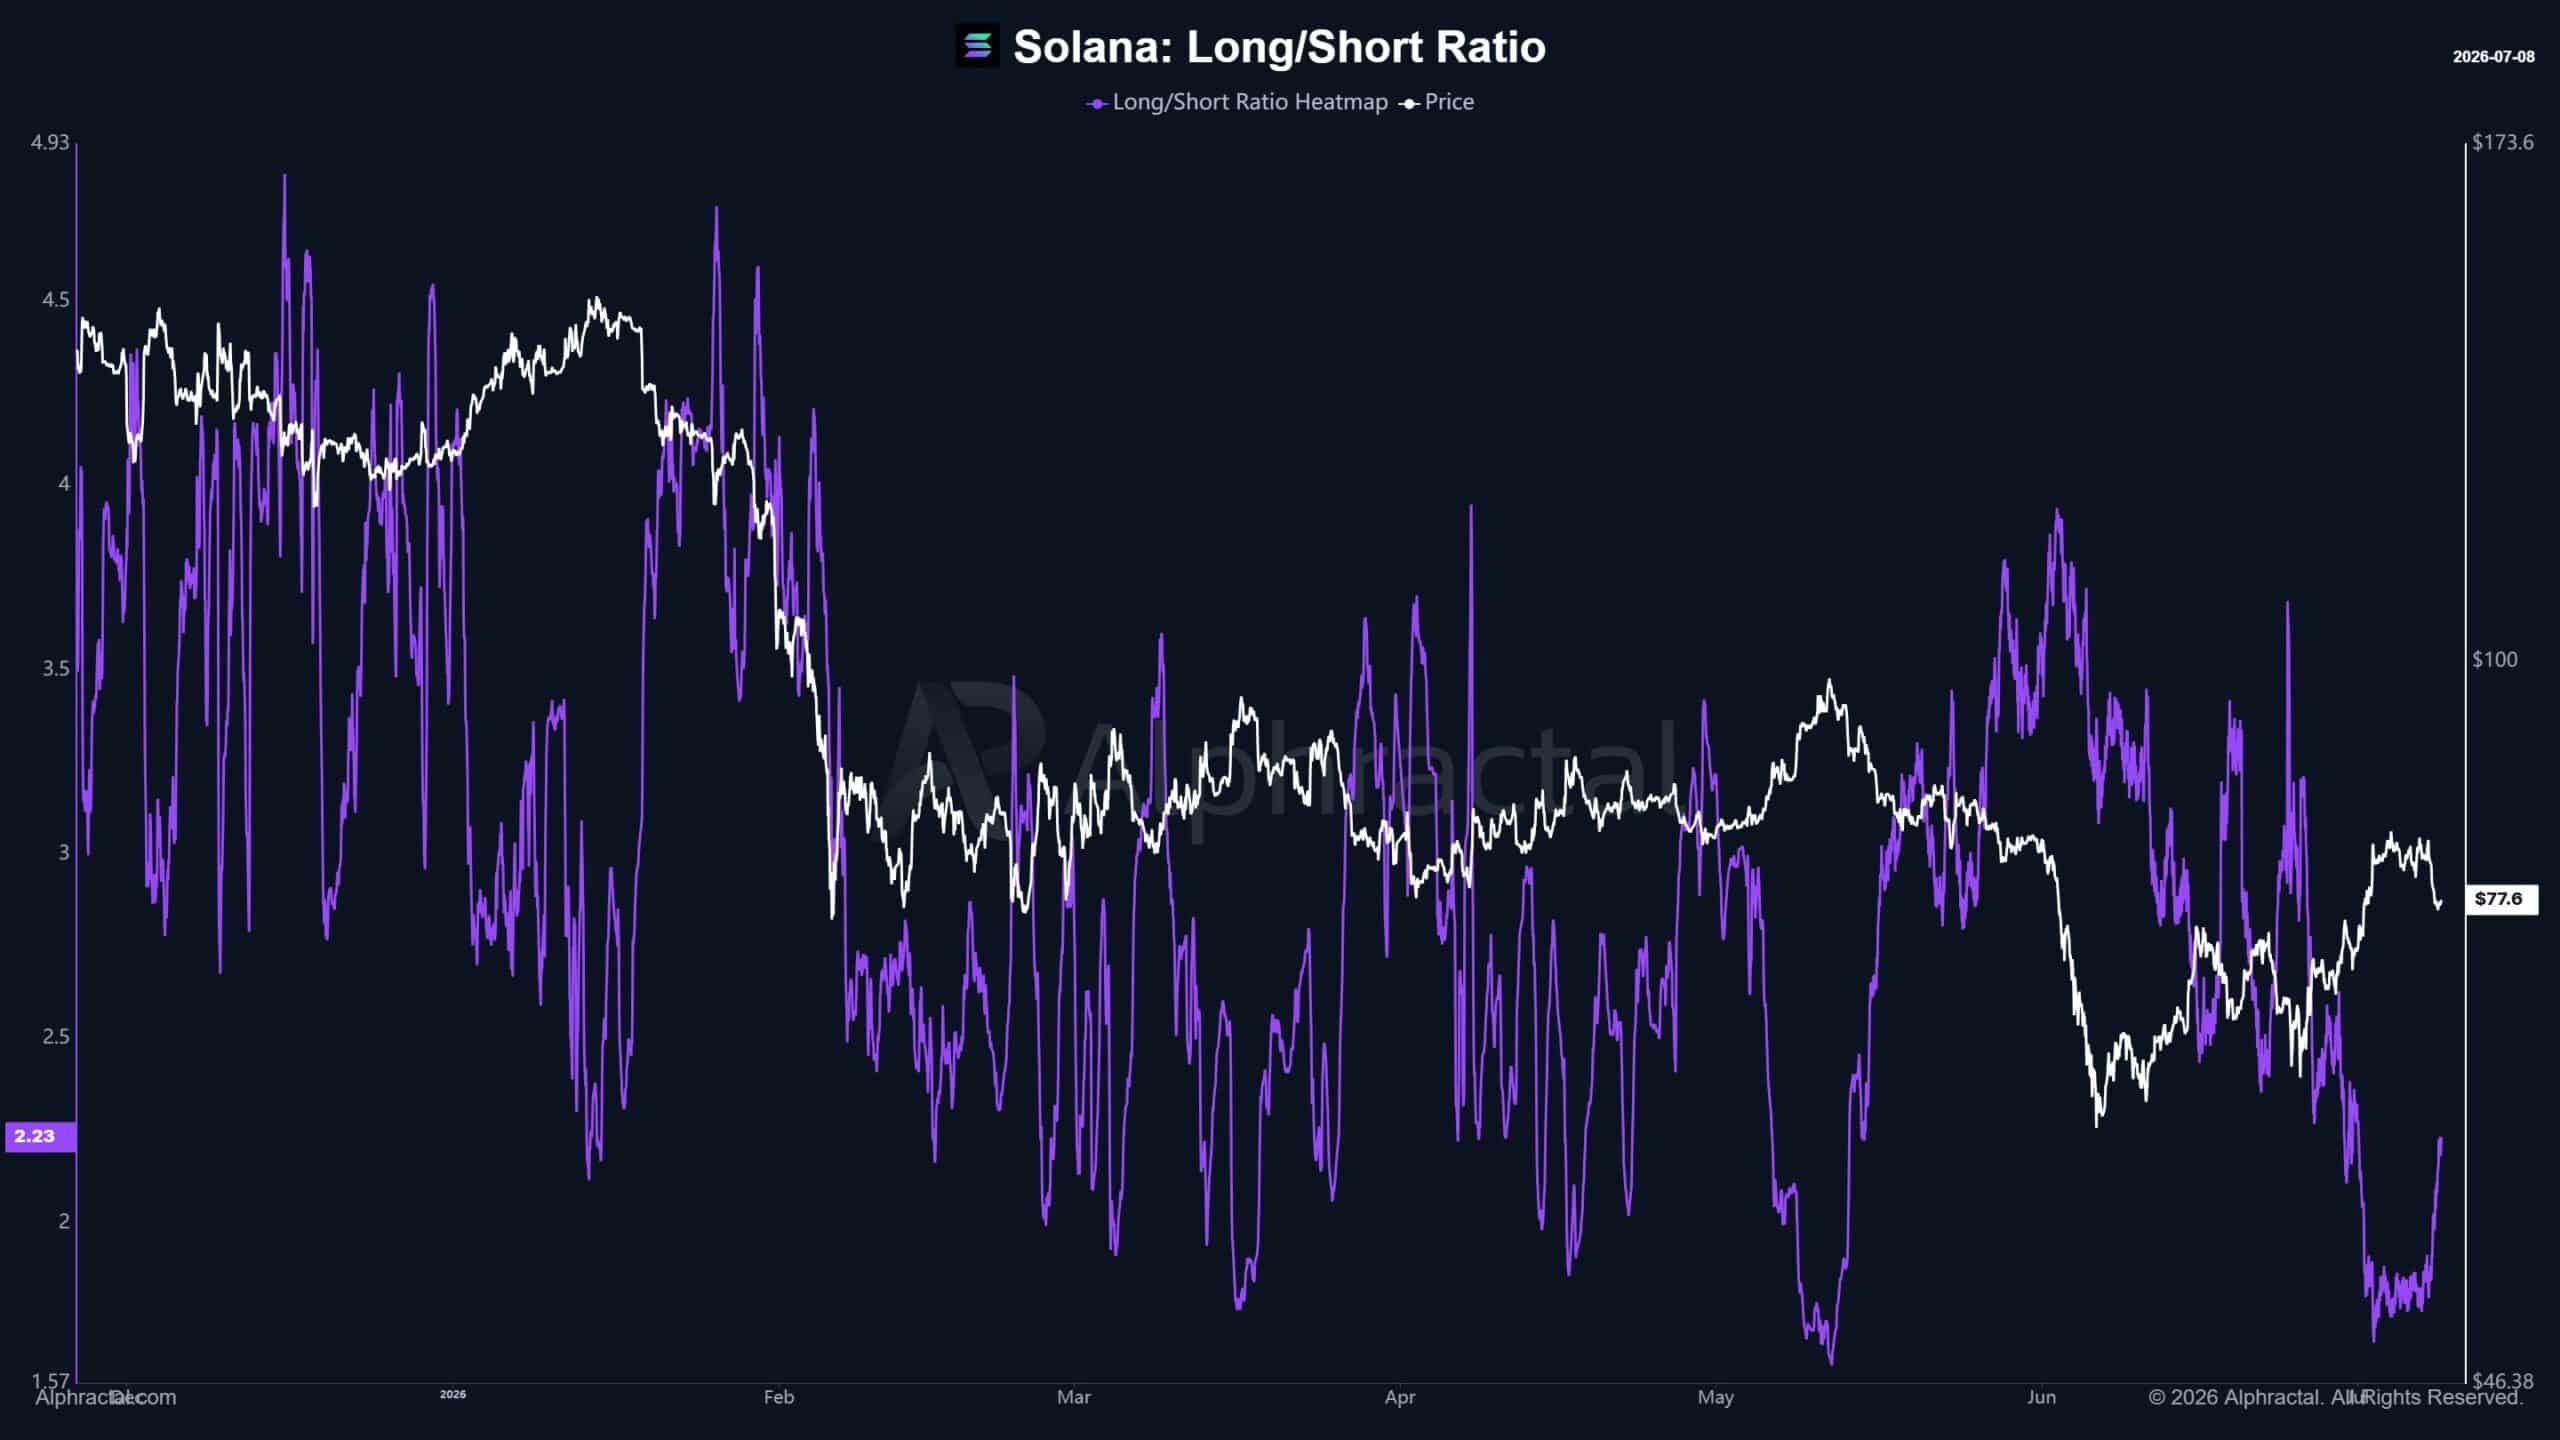
Source: Cryptoquant

Now, none of this guarantees a sell-off. However, if SOL drops, crowded long positions could add to the pressure.

SOL holds, but the bullishness is starting to cool

Despite the heavy long positioning, Solana’s price chart seemed to give way to hope. SOL was trading near $77.95 at the time of writing. It had recovered from its June lows and was testing the $82-$83 area.

The RSI was in neutral territory rather than an overbought market. The MACD was also positive, with the MACD line at 1.91, above the signal line at 1.38.
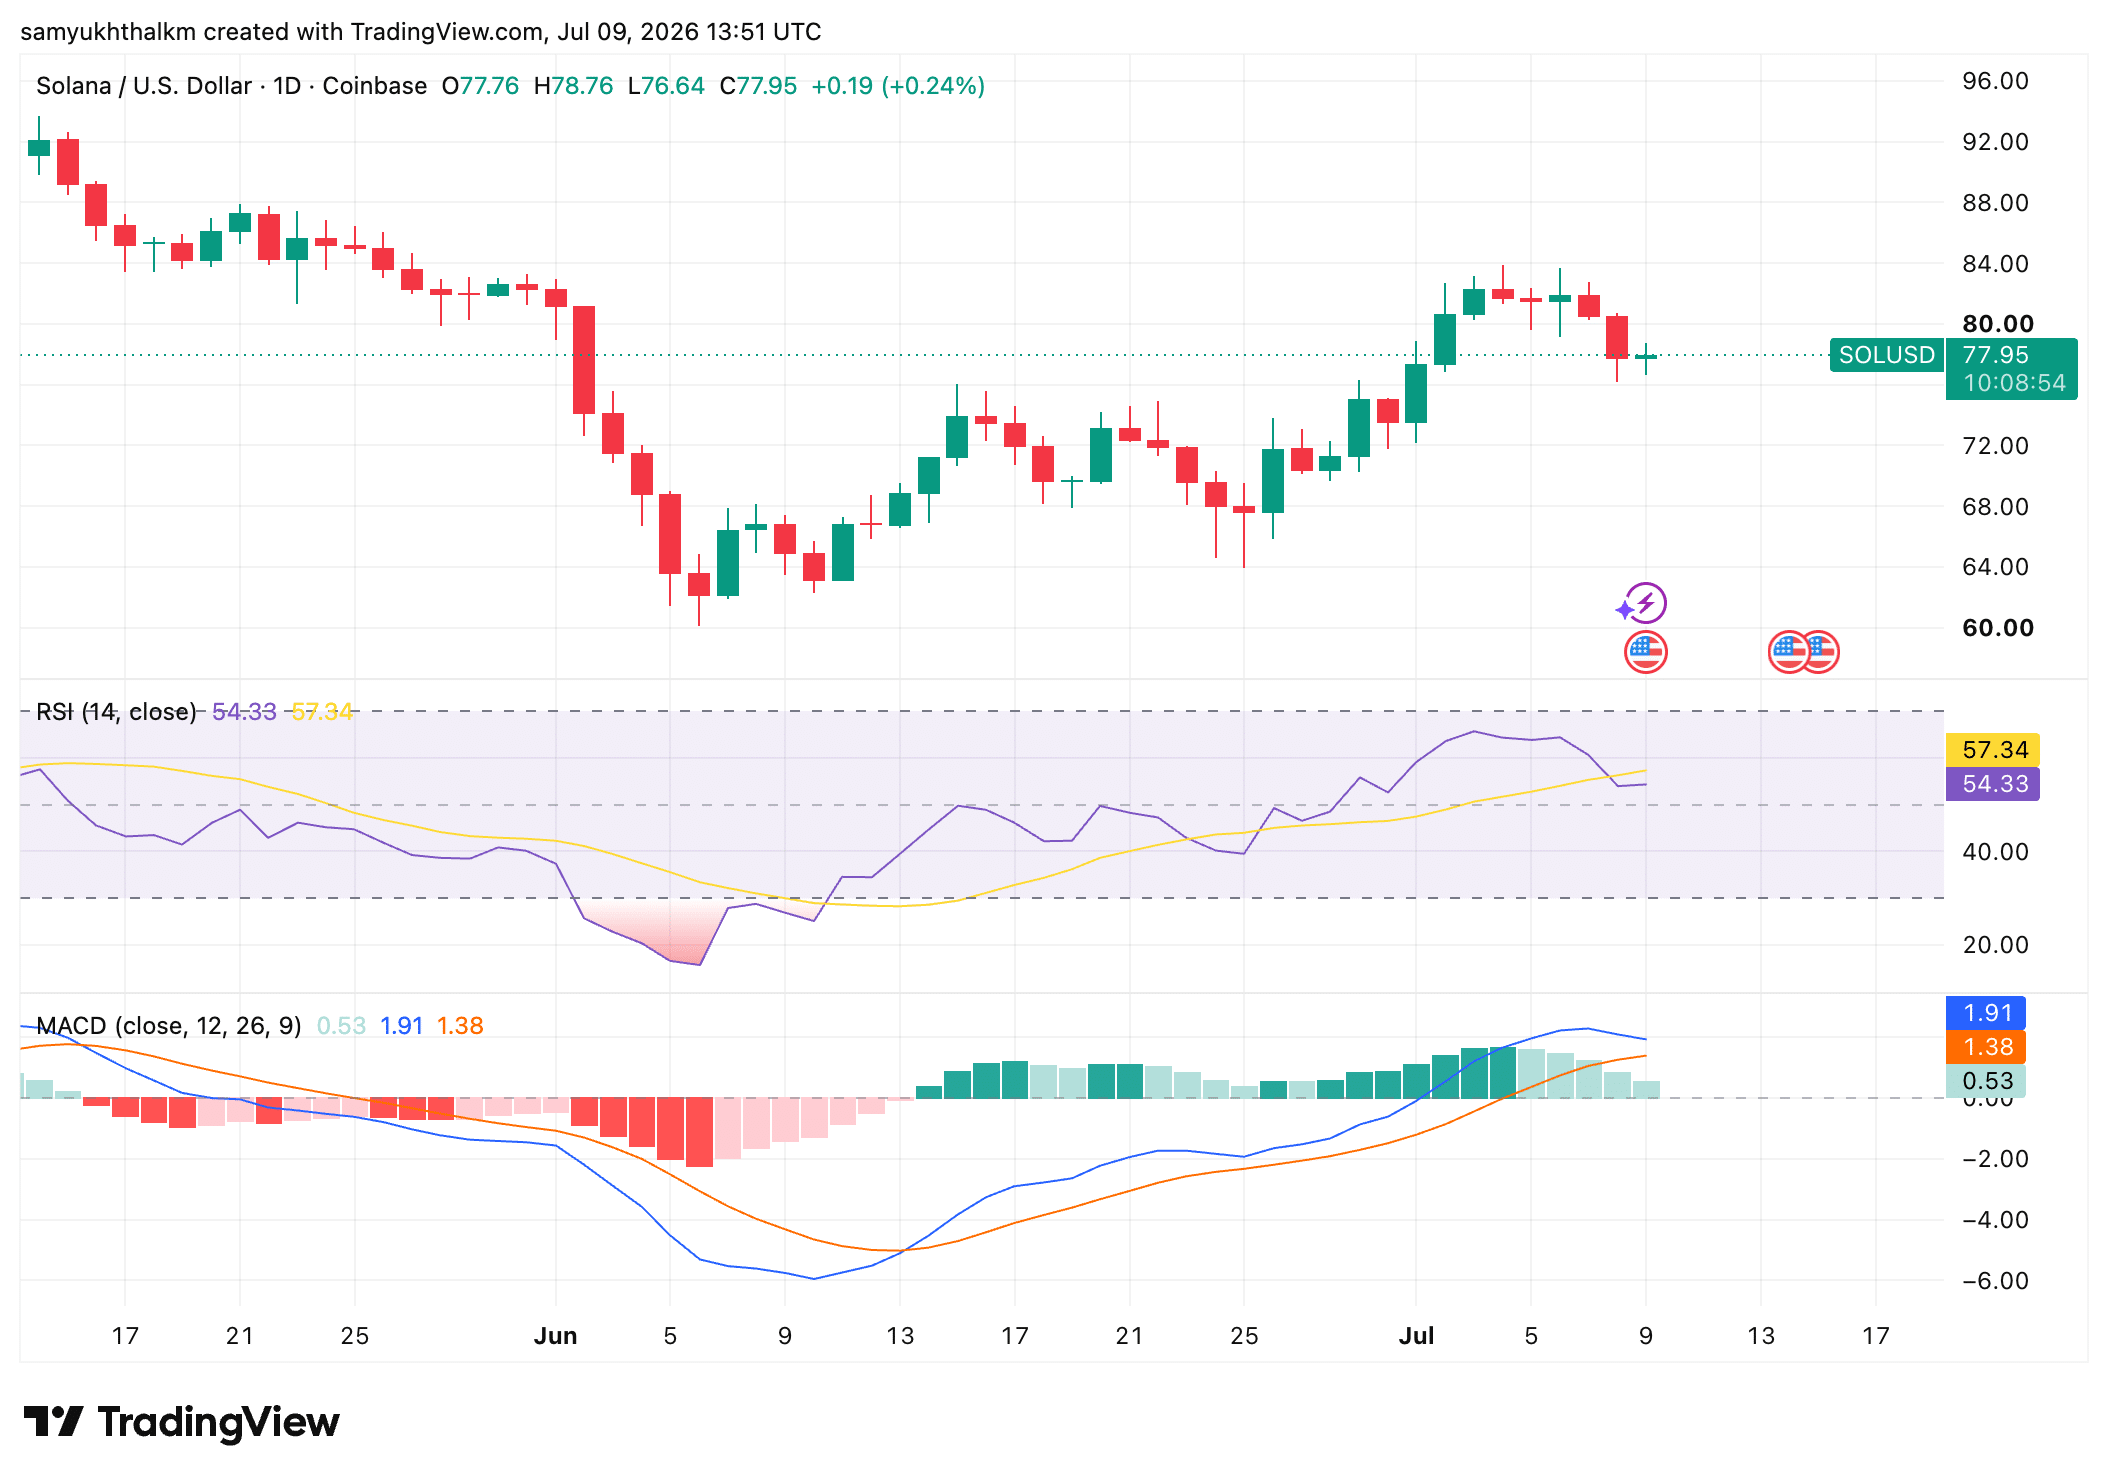
Source: TradingView

However, the upward pace appeared to be slowing down.

A move back above the recent highs may be needed to rebuild confidence. Until then, crowded long positions could be a risk.


Final Summary

  • SOL’s trading volume and negative sentiment are now at their worst levels of the year.
  • Downside risk was also relatively higher at press time.

Trending Cryptos

Related Questions

QWhat are the two main factors indicating a loss of confidence in the Solana (SOL) market according to the article?

AAccording to the article, the two main factors indicating a loss of confidence are SOL's trading volume falling to its lowest level in 2026 (around $2.27 billion) and its negative sentiment score shooting up to 14.05, which is the biggest wave of negativity since November 2025.

QWhat is the potential risk posed by the crowded long positions in SOL's derivatives market?

AThe crowded long positions, with around $7.4 billion in long exposure compared to roughly $3.1 billion in shorts, pose a liquidation risk. If SOL's price drops, these long positions could be liquidated (especially with a large cluster around $61-$62), which would add significant selling pressure and potentially accelerate a price decline.

QWhat technical indicators are mentioned as showing potential for a positive price move for SOL?

AThe article mentions that the RSI (Relative Strength Index) was in neutral territory (not overbought), and the MACD (Moving Average Convergence Divergence) was positive, with the MACD line (1.91) above the signal line (1.38). These indicators suggest there is room for upward movement if demand returns.

QWhat contradiction does the article highlight regarding trader sentiment and positioning?

AThe article highlights a contradiction between widespread negative market sentiment and the positioning in the derivatives market. While general sentiment is very negative (at a yearly low), traders in the derivatives market appear bullish, as indicated by a recovering long/short ratio of 2.23 and significant long exposure.

QWhat price level does the article suggest SOL needs to reclaim to rebuild trader confidence?

AThe article suggests that SOL needs to move back above its recent highs. Specifically, it was testing the $82-$83 area at the time of writing, and reclaiming levels above this recent high is implied as necessary to rebuild confidence.

Related Reads

Trading

Spot

Hot Articles

Discussions

Welcome to the HTX Community. Here, you can stay informed about the latest platform developments and gain access to professional market insights. Users' opinions on the price of SOL (SOL) are presented below.

活动图片