Is LIT’s burn worth $42 million enough to spur the altcoin’s next big rally?

ambcryptoPublished on 2026-07-12Last updated on 2026-07-12

Abstract

Lighter (LIT) has experienced significant volatility, rallying 18% over the past week but facing potential overbought conditions. After a warning of a correction toward $2, the price dipped to $2.3 before recovering to $2.60. A major catalyst was the recent burn of over 15.6 million LIT tokens (worth ~$42 million), representing 6.3% of the circulating supply, which may have spurred short-term bullish momentum toward $3. Technical analysis on the 1-day chart shows a bearish divergence with the RSI, signaling a potential pullback despite strong demand. The key Fibonacci retracement level to watch is $2.30. On the 4-hour chart, LIT is forming a range between $2.31 and $2.68. The suggested strategy is to wait for a breakout above $2.70 to target $3.06-$3.21, or a breakdown below $2.31 for a likely deeper retracement below $2. In summary, while bullish momentum persists, traders should monitor the range boundaries for the next directional move.

Lighter [LIT] has rallied by 3.68% in the last 24 hours with a daily trading volume spike of 13.52%. Over the past week alone, the token rallied by 18%.

In a recent report, AMBCrypto warned that the token was potentially overbought and might see a correction toward $2. Now, in the days after, LIT did fall by around 13% to reach $2.3. However, it has since climbed back to $2.60 once more.
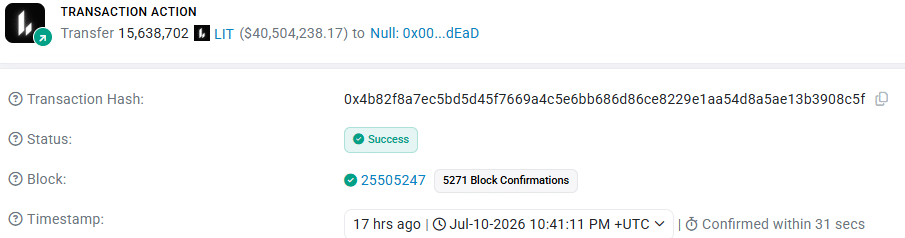
Source: Etherscan

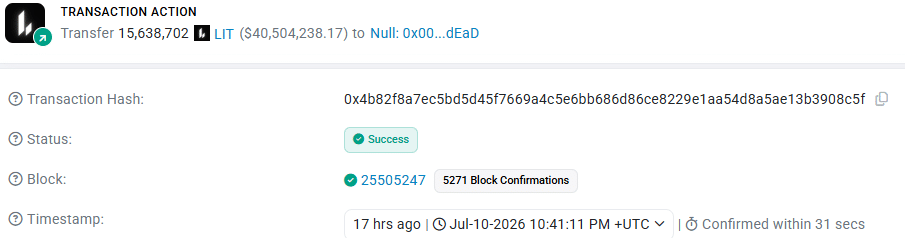
In a post on X, Lighter revealed the burn of just over 15.6 million LIT tokens, worth more than $42 million. It represented approximately 6.3% of the LIT circulating supply of 250 million tokens and 1.5% of the total supply of 1 billion.

This massive burn on 10th of July could have sparked short-term bullish momentum for the altcoin. In fact, the price action showed that a move towards $3 might not be far.

Why Lighter price trends might be overextended
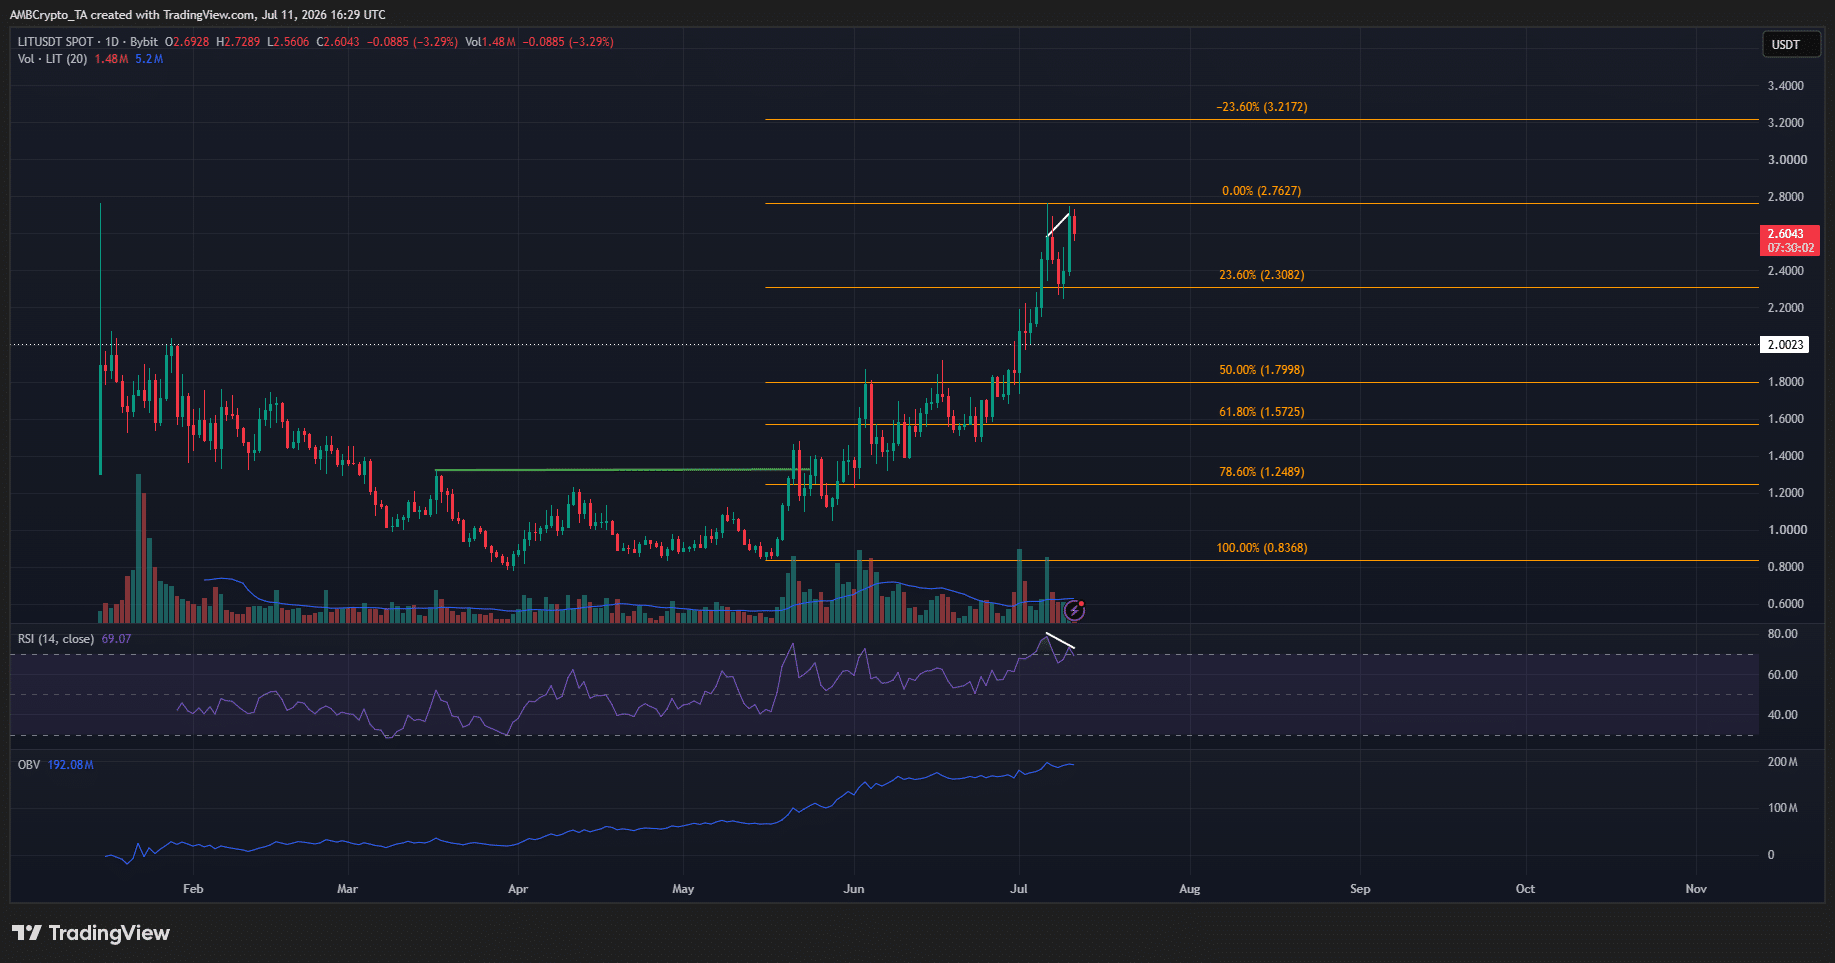
Source: LIT/USDT on TradingView

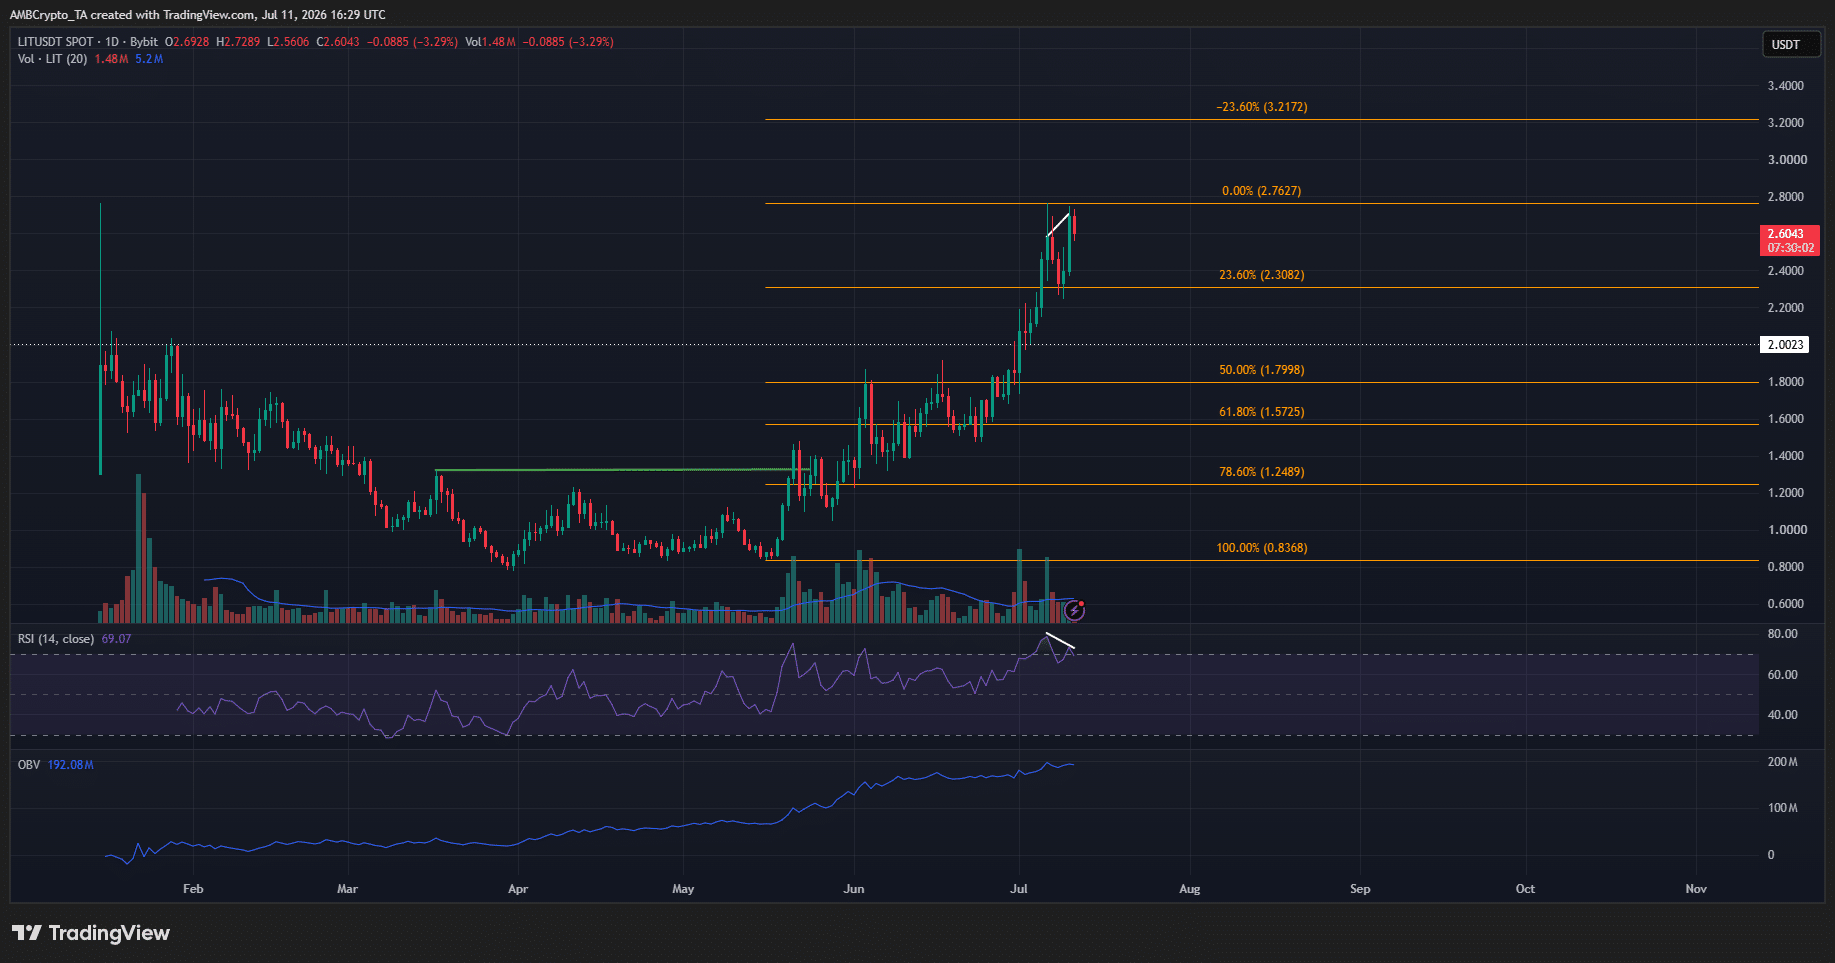
The 1-day chart revealed a bearish divergence. The RSI made a lower high while the price made a higher high, a classic bearish divergence. The volume trends were steadily bullish, but the bearish momentum divergence warned of a potential price pullback.

Despite the divergence though, demand for the altcoin has been strong.

Based on the swing move higher from $0.83 to $2.76, Fibonacci retracement levels were plotted.

If LIT falls below $2.30, the 23.6% Fibonacci retracement level, swing traders and investors can wait for a deeper retracement. Patience is required until then.

Traders’ call to action – Play the range
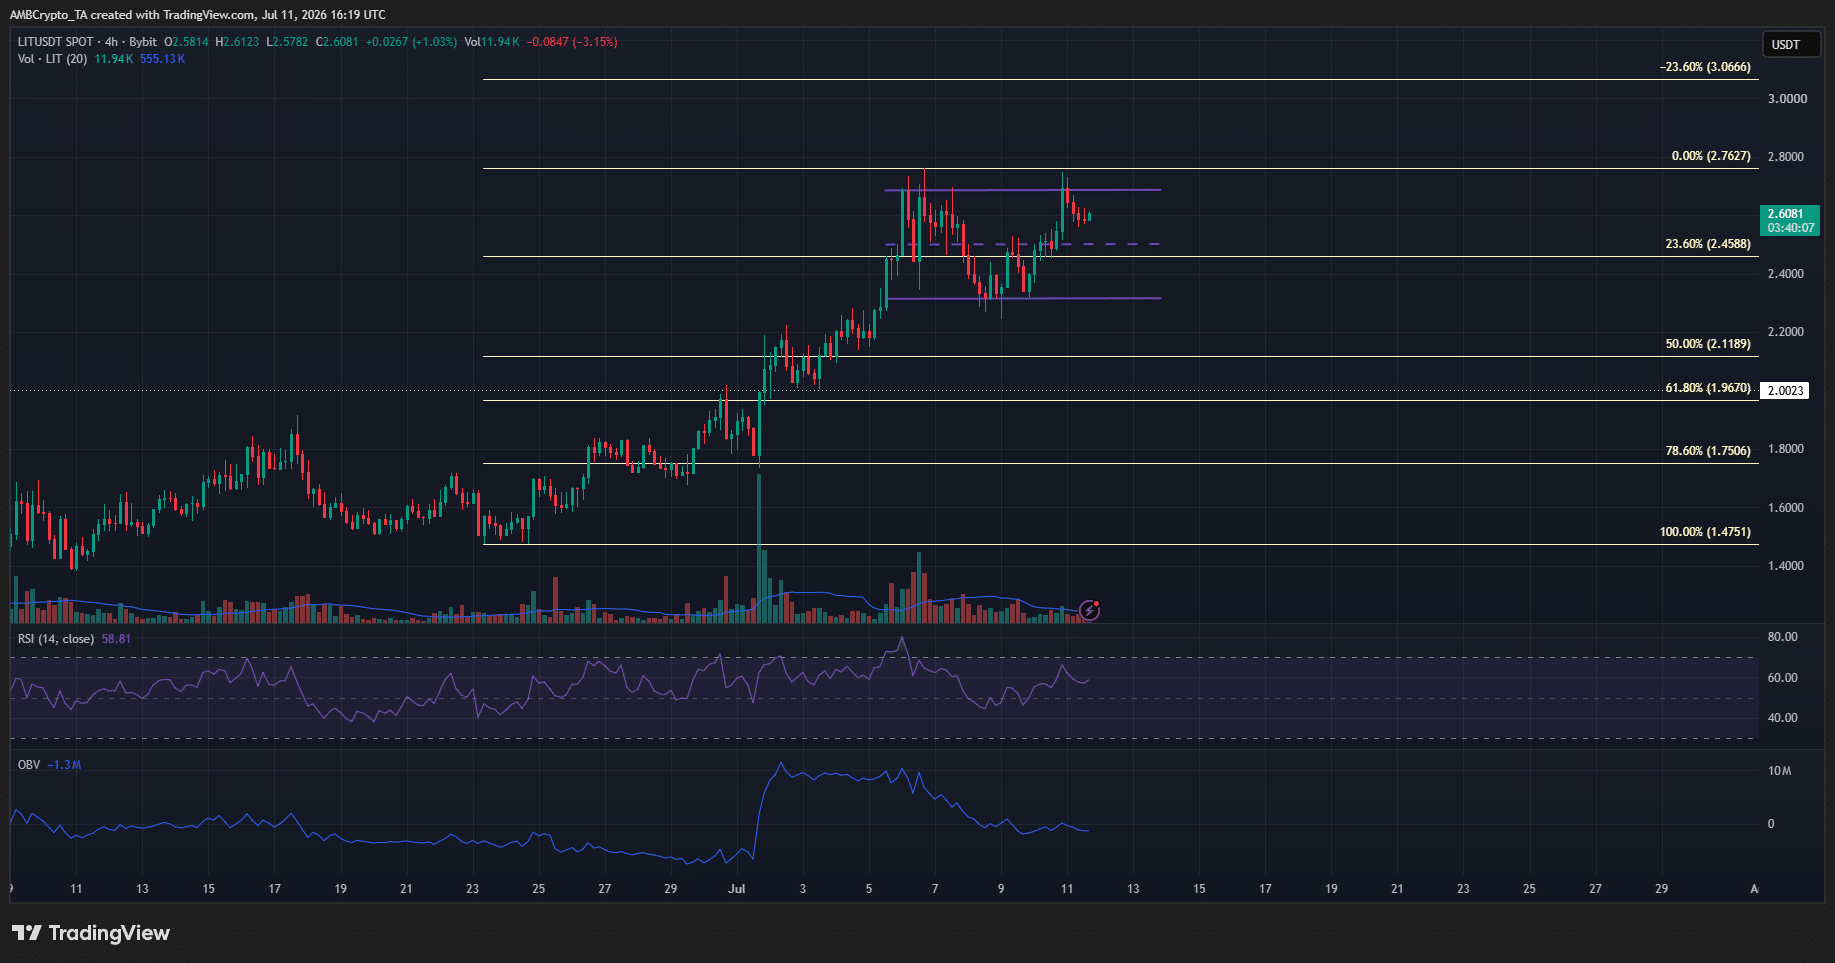
Source: LIT/USDT on TradingView

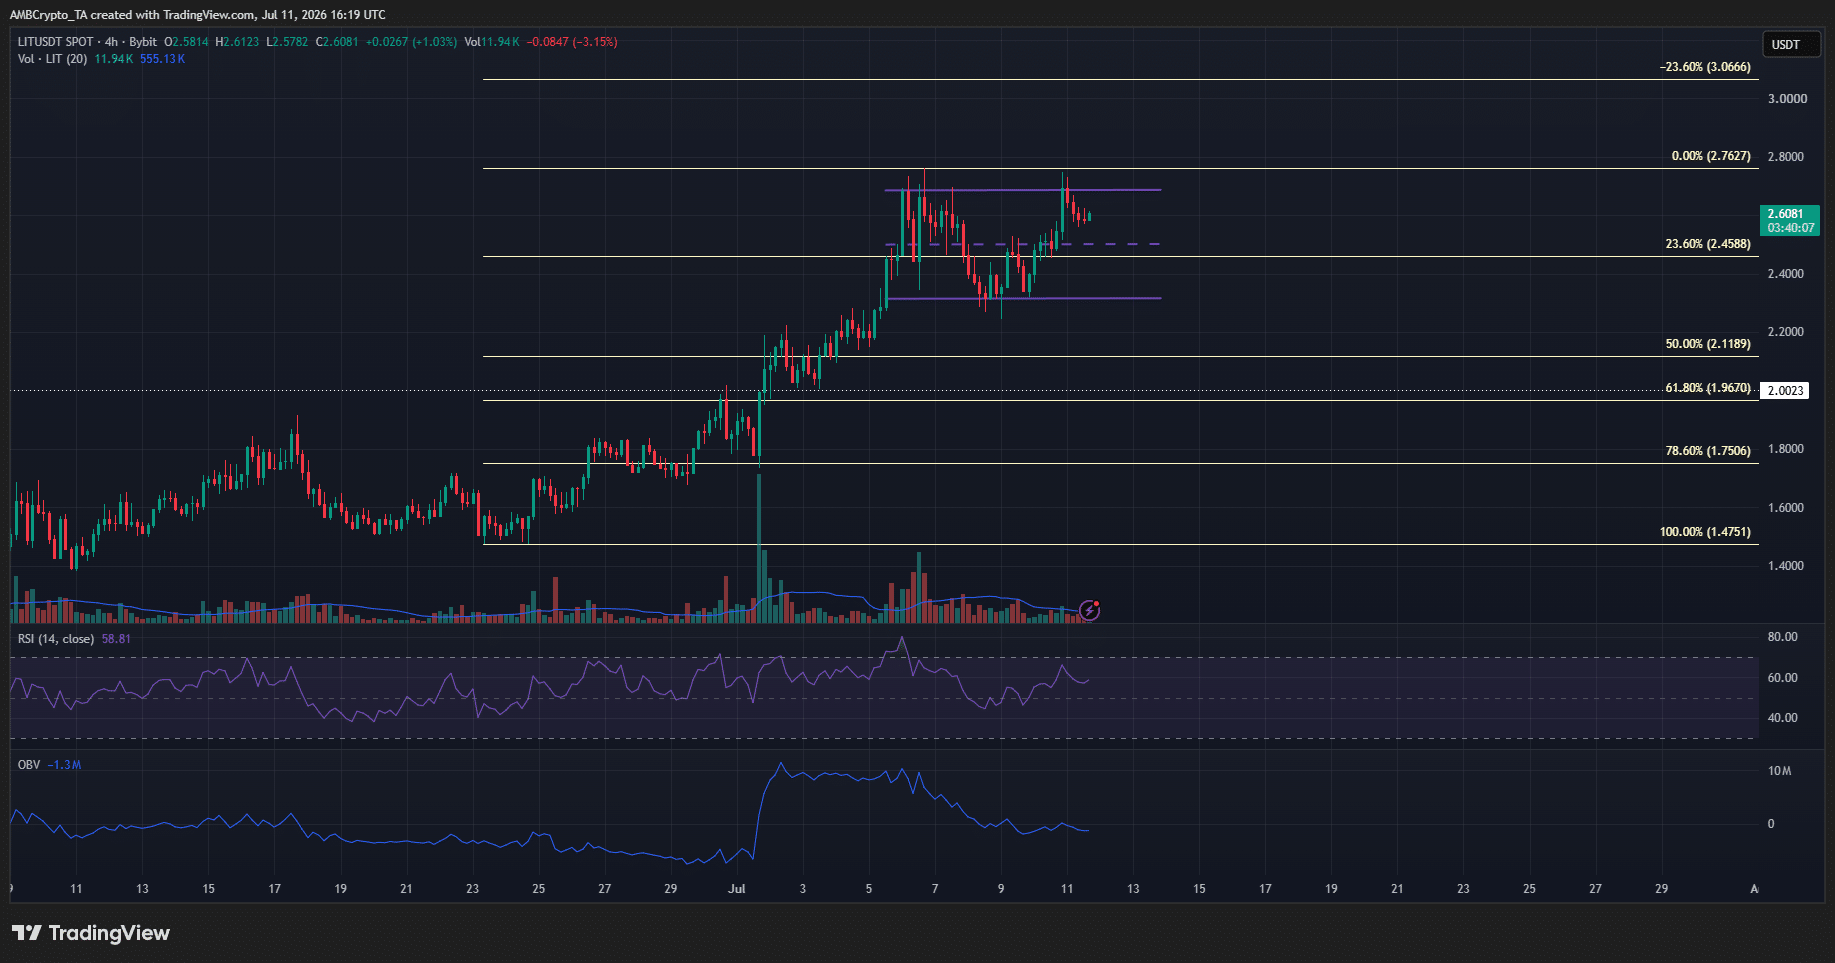
The 1-day chart warned of a pullback. The 4-hour chart showed a range formation between $2.31 and $2.68 form. Neither extreme of the range has been breached so far after two tries in July.

Traders can wait for a bullish breakout past $2.70 to buy LIT, targeting $3.06 and $3.21. On the other hand, a breakdown below the $2.31 range low, and the 23.6% Fibonacci retracement level on the 1-day timeframe at $2.30, would indicate a pullback below $2 was becoming more likely.


Final Summary

  • Demand and bullish momentum for Lighter continued to hold sway, despite a bearish momentum divergence signal.
  • Traders would want to watch the short-term range formation for clues on the next impulse move’s direction.


Trending Cryptos

Related Questions

QHow has Lighter's (LIT) price performed in the recent short term?

ALighter (LIT) has rallied by 3.68% in the last 24 hours and by 18% over the past week. After a brief correction to around $2.3, it has climbed back to $2.60.

QWhat significant event involving LIT tokens occurred recently, and what was its scale?

AOn July 10th, Lighter revealed the burn of just over 15.6 million LIT tokens, worth more than $42 million. This represented approximately 6.3% of the circulating supply and 1.5% of the total supply.

QWhat technical indicator on the 1-day chart suggests a potential price pullback for LIT?

AThe 1-day chart shows a bearish divergence, where the RSI made a lower high while the price made a higher high. This is a classic warning signal for a potential price pullback.

QAccording to the article, what are the suggested trading levels based on the 4-hour chart's range formation?

AThe 4-hour chart shows a range between $2.31 and $2.68. Traders are advised to wait for a bullish breakout past $2.70 to buy, targeting $3.06 and $3.21. A breakdown below $2.31 would indicate a likely pullback below $2.

QWhat is the article's overall stance on the interplay between LIT's demand and its technical signals?

AThe article states that demand and bullish momentum for Lighter continue to hold sway, despite a bearish momentum divergence signal. The short-term range formation is key for determining the direction of the next impulse move.

Related Reads

Nearly a Hundred Players Rush into Embodied Data: With 4.47 Billion Yuan in Financing in One Year, Who Can Really Make Money by 'Selling Data'?

The domestic embodied AI data industry has attracted nearly 100 players, with 70 focused on data collection and 27 on data infrastructure. In the past year, 15 independent embodied data service providers raised approximately 4.47 billion yuan. Despite this growth, the sector remains early-stage, fragmented, and faces significant challenges. Data collection methods are diverse, categorized into four main routes: teleoperation of real robots, human demonstration without a robot (using motion capture, exoskeletons, etc.), simulation synthesis, and distillation from internet videos. Most companies (43%) adopt hybrid approaches, combining multiple routes, as no single method can meet all training needs. Teleoperation alone is pursued by 31% of players, often by state-owned platforms and robot companies, while newer firms favor asset-light, no-hardware human demonstration. Independent data service providers now form the largest player group (40%), indicating the emergence of a distinct industry segment rather than just a subsidiary function for robot makers. Two-thirds of all players are "embodied-native" startups, while one-third are companies that pivoted from fields like AI data annotation, which are more prevalent in the data infrastructure layer. Current annual industry capacity is estimated at 1.6-1.8 million hours plus 70-80 million data points, with a short-term goal to increase this 15-20 fold within 1-3 years. Data collection factories are spread across 20 provinces in China, concentrated in the Yangtze River Delta, Beijing-Tianjin-Hebei, and Pearl River Delta regions. Financially, the 4.47 billion yuan raised in the past year pales compared to the 43.8 billion yuan raised by the broader embodied intelligence sector in just the first half of 2026, highlighting that data remains a less "sexy" bet for investors. The 15 funded independent providers show clear stratification: a top tier led by a unicorn (Lightwheel Intelligence, 3.1 billion yuan), a middle tier of 11 firms raising tens to hundreds of millions, and an early-stage tier of 3 companies. Sixty-nine investment institutions have participated, but none have made concentrated bets, reflecting uncertainty about viable business models. Over half of these funded companies are less than a year old, most are at pre-A or A rounds, and profitability remains largely unproven. In summary, the embodied data industry has become an independent track creating jobs and local economic activity. However, it is still nascent, with unformed consensus, unsolved problems, and unproven business models. The coming 1-2 years will be a critical validation window to see if companies can build sustainable, profitable businesses purely by "selling data."

marsbit1h ago

Nearly a Hundred Players Rush into Embodied Data: With 4.47 Billion Yuan in Financing in One Year, Who Can Really Make Money by 'Selling Data'?

marsbit1h ago

Dialogue with Multicoin Partner: The Crypto Market Has Bottomed Out, Favoring Three Cryptocurrencies in This Cycle

In a recent interview, Multicoin Capital managing partner Tushar Jain shared his views on the crypto market. He believes the market has bottomed and is at an inflection point, citing that negative news no longer causes significant price declines and application adoption continues to grow. Jain remains highly bullish on Solana, viewing it as the correct architectural choice for internet capital markets, particularly for spot and tokenized security trading. He is also positive on Hyperliquid, noting its leadership in decentralized derivatives trading. His investment approach focuses on concentrating capital in top convictions rather than equal allocation. A distinct opportunity he highlights is Zcash (ZEC), which he sees as a return to the industry's cypherpunk ethos and a potential top-five asset by market cap. For assets like Zcash without cash flows, his valuation framework is based on relative market cap ranking. Regarding investment strategy, Jain employs a "three-part" entry method to avoid timing pitfalls and emphasizes long-term "active management" over "active trading." He outlines four sources of investment edge: informational, analytical, behavioral/psychological, and structural. On portfolio management, the fund uses Bitcoin as its "cash," selling assets into Bitcoin during market euphoria to reduce beta risk and using Bitcoin to buy dips. Sales occur only if a better opportunity arises, the investment thesis breaks, or valuations become excessively overheated. While respectful of Ethereum's resilience, he questions its unclear scaling roadmap. Finally, Jain reaffirms his commitment to the thesis that blockchains will form the foundational architecture for future capital markets.

marsbit1h ago

Dialogue with Multicoin Partner: The Crypto Market Has Bottomed Out, Favoring Three Cryptocurrencies in This Cycle

marsbit1h ago

Behind Robinhood's Chain Launch and Tokenized Stocks: No Equity Rights, How Far Can This Packaging Game Go?

Robinhood is launching its own Layer 2 blockchain (Robinhood Chain) and "tokenized stocks," but these are not actual equity shares. The tokens are legally structured as debt securities or derivatives, offering economic exposure to a reference stock without granting voting rights or direct ownership. This move represents Robinhood's strategy to expand from a traditional brokerage into a "financial super app," building a user-friendly, programmable financial interface on top of complex, legally compliant, and jurisdiction-specific backend structures. The company's existing business remains strong, driven by options, event contracts, and stock trading. The new blockchain and tokenization efforts are an ambitious layer of infrastructure built atop this core, aiming to make financial products more portable and globally accessible via crypto rails. Key components include the Robinhood Wallet, Bitstamp acquisition (for institutional reach), the Lighter perpetual contracts platform, and Robinhood Earn (DeFi yield). The central challenge is the "brokerage chain paradox": maintaining a simple, intuitive user experience while the underlying assets are highly structured, regulated, and legally distinct from direct ownership. The success of this strategy depends on users, developers, and regulators accepting this model. If the complexity is misunderstood or deemed misleading, it could create product liability issues and stall expansion. The initiative is a significant infrastructure play, but its long-term viability hinges on navigating this fundamental tension between simplicity and legal reality.

marsbit2h ago

Behind Robinhood's Chain Launch and Tokenized Stocks: No Equity Rights, How Far Can This Packaging Game Go?

marsbit2h ago

Trading

Spot

Hot Articles

Discussions

Welcome to the HTX Community. Here, you can stay informed about the latest platform developments and gain access to professional market insights. Users' opinions on the price of S (S) are presented below.

活动图片