Gate Research: Взлет «уолл-стритизации» криптофинансовых продуктов — это конкуренция или интеграция?
**Аналитический обзор Gate Research Institute: Волна "уолл-стритизации" криптофинансовых продуктов — конкуренция или интеграция?**
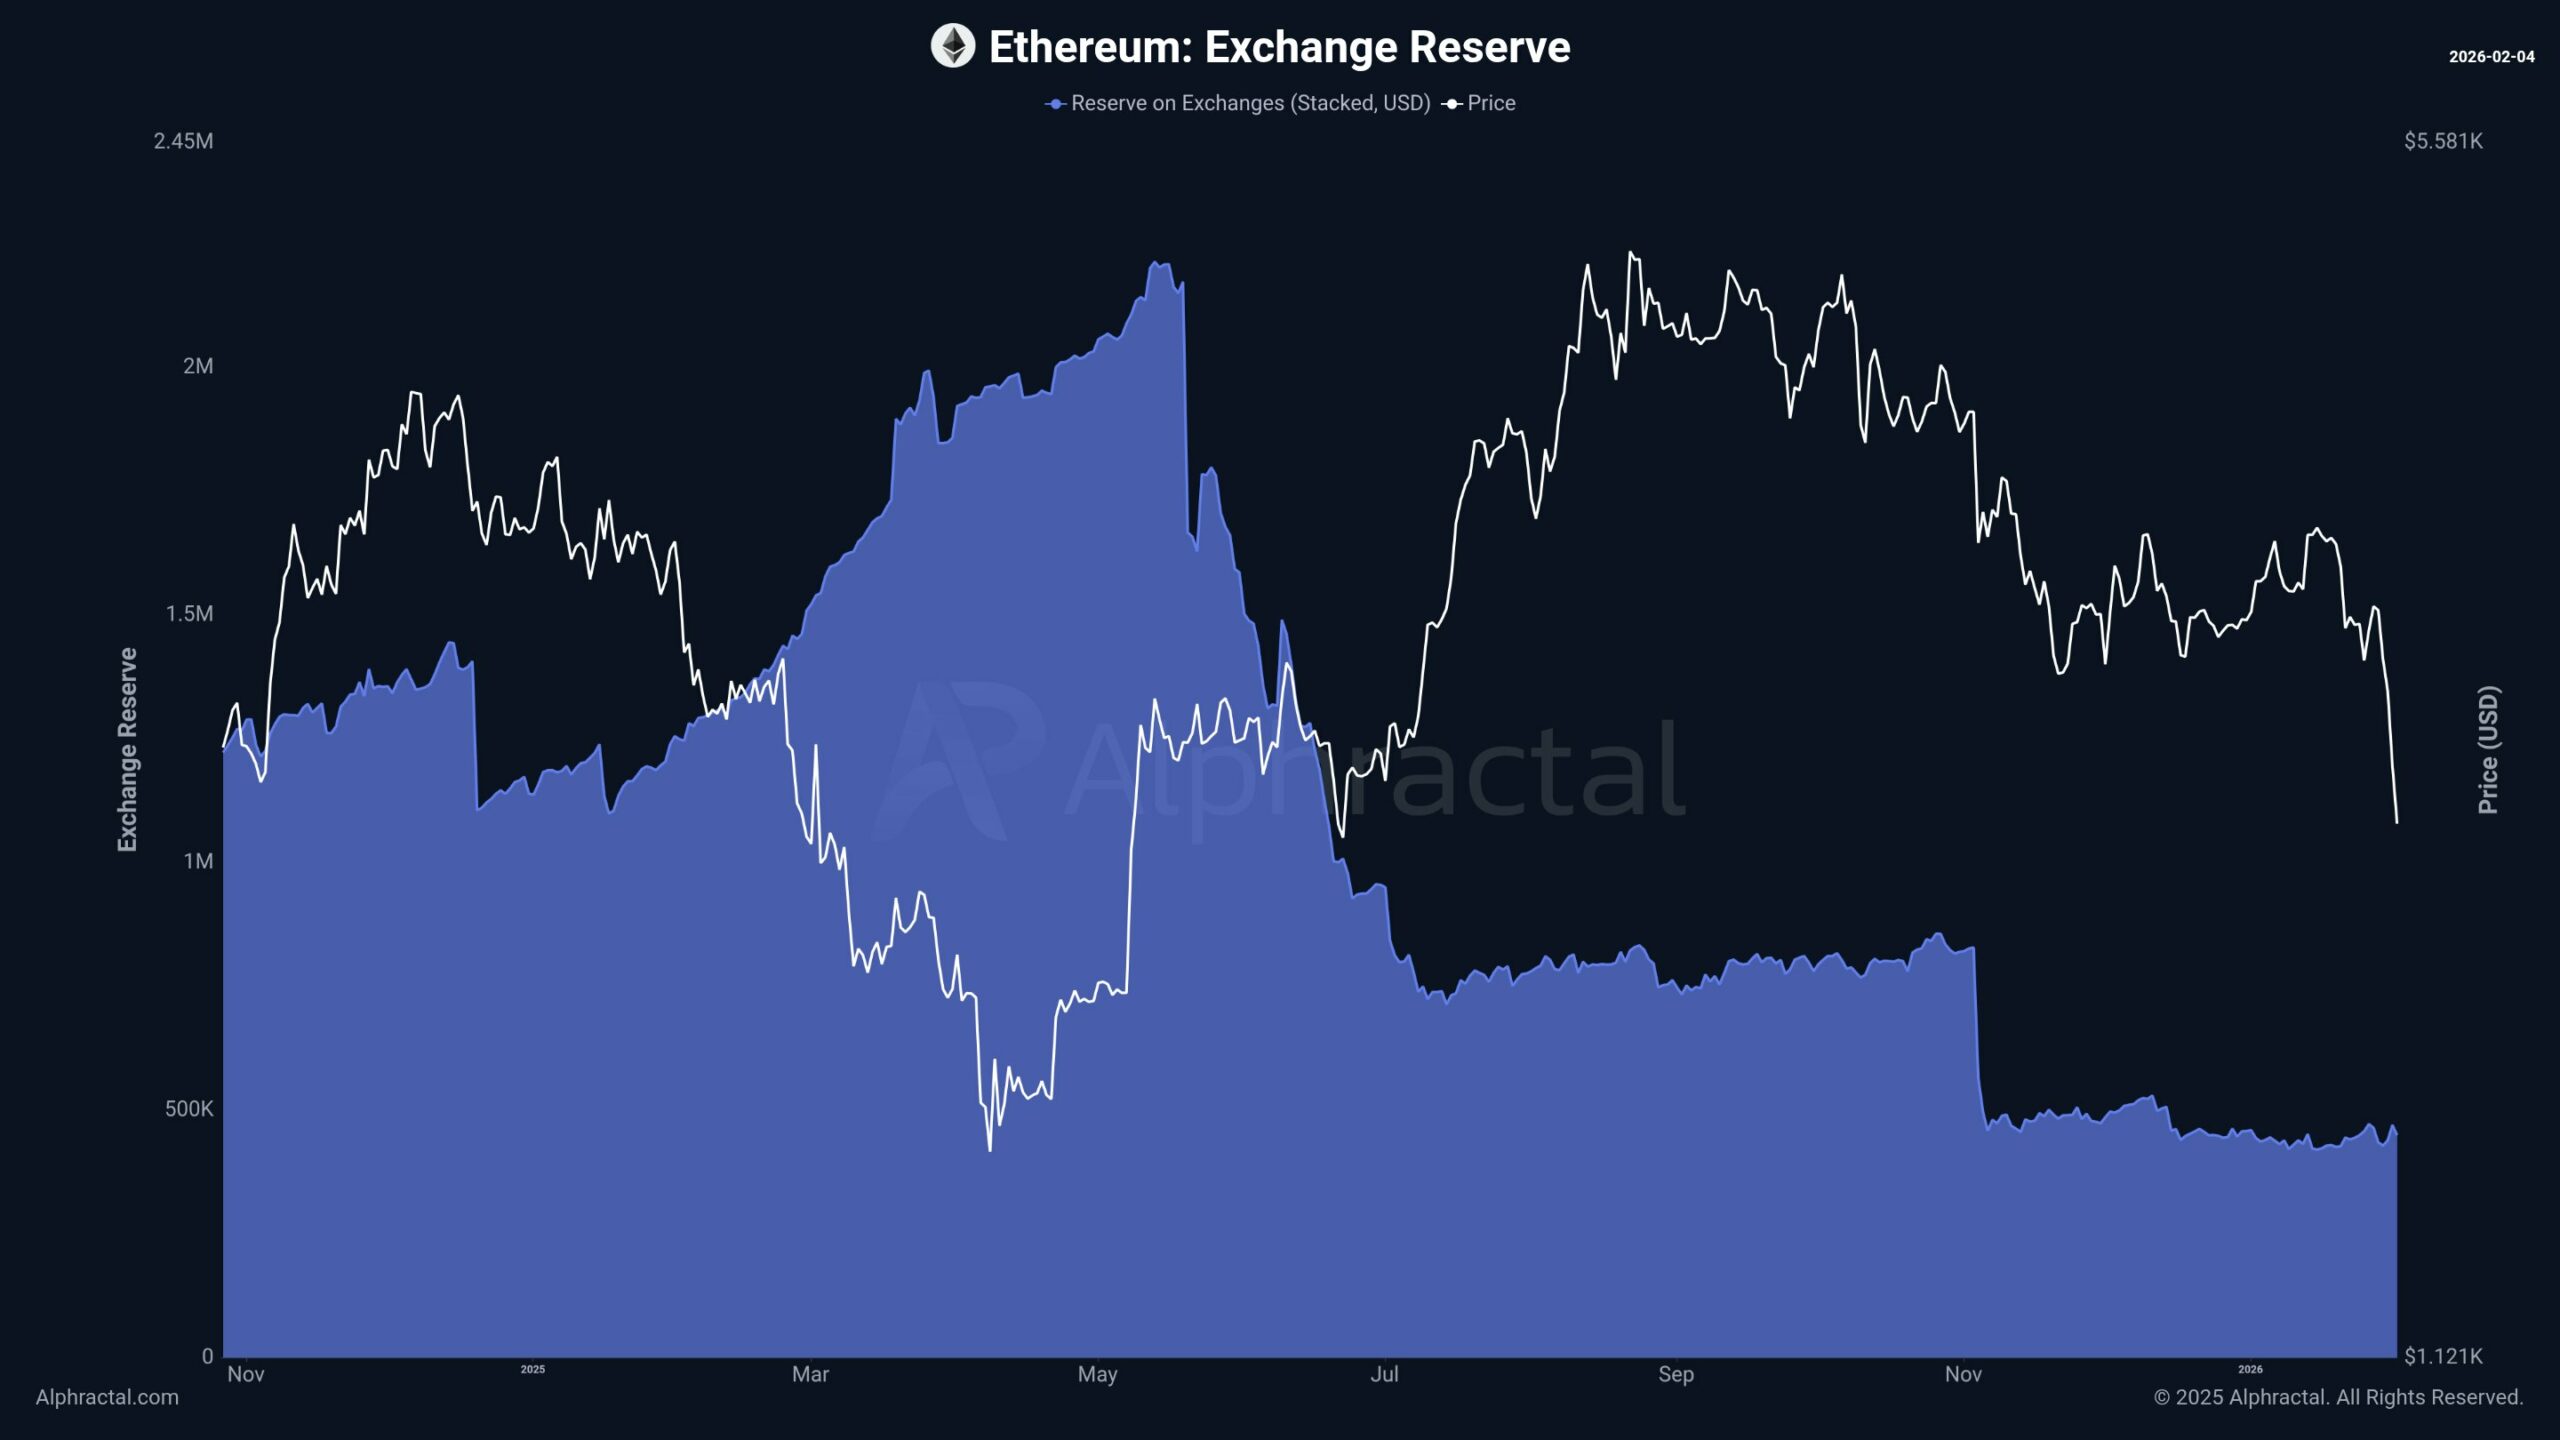
Создание биткоина в 2009 году было ответом на финансовый кризис и стремлением построить децентрализованную систему без доверенных посредников. Однако к 2026 году значительная часть биткоинов (около 7,14%) хранится через ETF таких гигантов, как BlackRock. Это символизирует глубокую интеграцию традиционных финансов (TradFi) и крипторынка. С появлением биткоин-ETF, фьючерсов, RWA (токенизированных реальных активов) и государственных облигаций на блокчейне, традиционные институты получают всё больше влияния на выпуск, ценообразование, кастодию и дистрибуцию криптоактивов.
Однако это не одностороннее поглощение, а взаимодополняющая конвергенция. Криптосфера приносит TradFi глобальную 24/7 ликвидность и программируемость, а TradFi предоставляет криптосфере регулируемые каналы, институциональное доверие и массовый доступ. Яркий пример — две противоположные, но ведущие к одной цели траектории:
* **Путь А:** Криптобиржи, такие как Gate, начинают с токенизированных акций и CFD, а затем напрямую подключаются к инфраструктуре традиционных брокеров, предлагая реальную торговлю акциями США, Гонконга и Кореи за стейблкоины.
* **Путь Б:** Традиционные брокеры, такие как Robinhood, интегрируют криптоактивы, а затем создают собственные Layer 2 для токенизации своих акций, стремясь к круглосуточной торговле.
Обе стратегии нацелены на создание **универсального финансового аккаунта будущего** — единой точки доступа к акциям, криптовалютам, ETF, токенизированным облигациям и другим активам. Ключевой конкурентной борьбой становится не между CEX и брокерами, а между этими "супераккаунтами".
Параллельно, слой RWA и токенизированных гособлигаций растёт даже на медвежьем рынке, становясь "прослойкой" для объединения капиталов. Хотя этот рынок (около $150 млрд токенизированных казначейских облигаций) ещё мал по сравнению с традиционным ($30 трлн), он демонстрирует устойчивый структурный тренд, привлекающий крупнейшие финансовые институты (JPMorgan, DTCC и др.).
**Вывод:** "Уолл-стритизация" — это не поражение идеалов децентрализации, а формирование новой гибридной модели. Децентрализованные протоколы продолжают работать на базовом уровне, в то время как на уровне приложений и пользовательского опыта формируется более эффективный, глобальный и свободный объединённый рынок капитала, где активы TradFi и DeFi торгуются бок о бок в одном интерфейсе. Уолл-стрит не завоевала криптосферу, а криптосфера не обошла Уолл-стрит — они совместно строят новые финансовые рельсы.
marsbit1 ч. назад