In his forecast, experienced trader Peter Brandt is leaning towards another drop in Bitcoin, although he himself has not made any bets on the cryptocurrency's further movement.
I'm not making any bets yet, but if I were, it would be on a drop, — Brandt wrote on a social network.
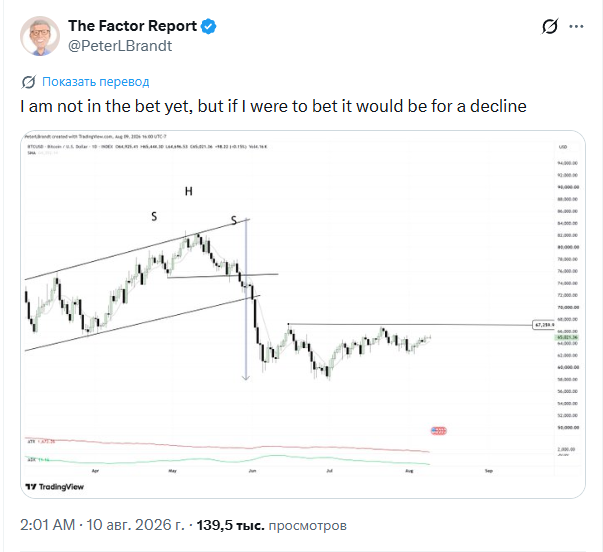
In the third quarter, the price of Bitcoin has been fluctuating within a relatively narrow range, attempting to rise to the key resistance level at $67,260.
Peter Brandt's chart shows a large "head and shoulders" pattern that formed between April and June. In April, Bitcoin formed the left shoulder, exceeding the $70,000 mark. In May, the cryptocurrency rose to a higher peak of around $82,000, forming the "head" of the pattern.
The subsequent bounce back to levels above $70,000 in late May and early June formed what Brandt calls the "right shoulder." Both shoulders are roughly the same height, although the May peak is significantly higher than them.
The pattern's neckline was drawn around $75,000. Bitcoin broke through this level in early June. The subsequent sell-off pushed $BTC down from $75,000 below $60,000.
The arrow drawn by Brandt points to the area around $58,000, meaning the flagship cryptocurrency could retest the 2026 low.
Analyst Ted Pillows believes a close above the $65,000 level is necessary to resume the bullish momentum. A breakout of the $67,260–68,000 level would allow the bulls to regain the initiative, at least for some time.
end-content