Ethereum Looks To Bottom Against Bitcoin: What The Charts Are Saying

bitcoinistPublished on 2026-04-03Last updated on 2026-04-03

Abstract

Ethereum may be nearing a turning point against Bitcoin after months of underperformance, according to analyst CrediBULL Crypto. The ETH/BTC pair has been in a sustained downtrend since mid-2025 but is now consolidating within a key macro support zone between approximately 0.02143 and 0.02626, indicating potential sell-off exhaustion. The analyst suggests this could be the final stage before a true breakout, projecting a 20% upward move for ETH against BTC if it reclaims the previous resistance level around 0.0308-0.031. On the ETH/USD chart, price is holding above the $1,900-$1,950 support, with an upside target of breaking through the $2,120-$2,200 resistance zone toward $2,400 or higher.

Ethereum has spent the better part of recent months losing ground to Bitcoin, and this underperformance may now be approaching a turning point, at least according to a new technical outlook shared by crypto analyst CrediBULL Crypto. The technical analysis shows that the ETH/BTC pair is no longer breaking down and is now quietly settling down at a level that has always led to sell-off exhaustion in the pair.

ETH/BTC Holds Range Lows As Selling Pressure Fades

The ETH/BTC 12-hour chart tells a story that has been unfolding since July 2025 and is now nearing a completion. The ETH/BTC chart shows a pair that has spent recent months grinding lower before finally reaching a support zone. As shown in the chart below, the ETH/BTC ratio has been in a sustained decline for the past few years from a peak near 0.0420 in mid-2025, which the analyst labels as wave 5 of a completed five-wave impulse.

The ratio worked its way down through a series of lower highs and lower lows throughout the second half of 2025 and January 2026. However, it has been compressed between February and March into what looks like a macro support zone between approximately 0.02143 and 0.02626.

This support was noted by CrediBULL Crypto as being important in this context, with the analyst pointing out with confidence that the ETH/BTC pair is bottoming here and is in a final stage preceding a true breakout from the current range.

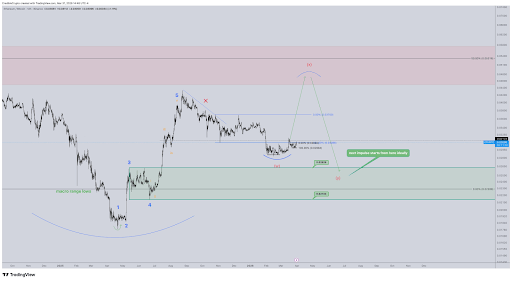
Ethereum/Bitcoin Chart. Source: @CredibleCrypto On X

Reclaim Of Range Could Cause A 20% Outperformance Move

The Elliott Wave labeling on the chart frames the current structure on the ETH/BTC pair as a (w)-(x)-(y) correction after the previous five-wave impulse that peaked in mid-2025. Wave (w) has played out in full, and the projection is a wave (x) move that should see the Ethereum price going on a 20% move up on the Bitcoin price.

The most important step in this projected move is reclaiming the previous range lows around 0.0308-0.031, which have now flipped into resistance. Failure to reclaim the level would likely delay this scenario, but the current price action has been characterized by repeated attempts to push higher.

Switching to the ETH/USD 30-minute chart, the analyst overlays a Wyckoff Accumulation schematic to the current price action. The Ethereum/USD chart complements the ETH/BTC outlook, showing price trading in a range just above $2,000. This is above a notable support level around the $1,900-$1,950 range, where multiple reactions have occurred.

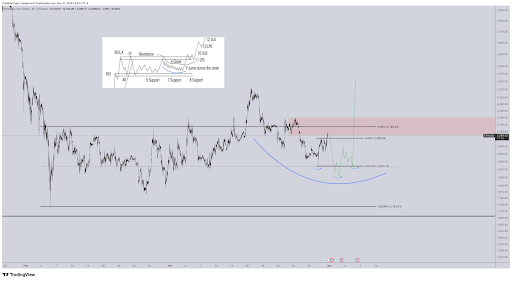
Ethereum Price Chart. Source: @CredibleCrypto

There’s also a pink resistance zone above, which is around roughly $2,120 to $2,200. CrediBULL Crypto’s projection, illustrated by the green arrows, envisions a brief retest of support below $1,900 before an upside resolution that pushes the ETH price above the pink resistance zone to $2,400 and maybe higher.

ETH bears continue to push down | Source: ETHUSDT on Tradingview.com

Related Questions

QAccording to CrediBULL Crypto's analysis, what is the current state of the ETH/BTC pair and what is it approaching?

AAccording to the analysis, the ETH/BTC pair is no longer breaking down and is now quietly settling at a level that has historically led to sell-off exhaustion. It is approaching a turning point and is in the final stage preceding a true breakout from its current range.

QWhat is the macro support zone for the ETH/BTC ratio as identified on the chart?

AThe macro support zone for the ETH/BTC ratio is between approximately 0.02143 and 0.02626.

QWhat key resistance level must the ETH/BTC pair reclaim to confirm the projected 20% upside move against Bitcoin?

AThe ETH/BTC pair must reclaim the previous range lows around 0.0308-0.031, which have now flipped into resistance, to confirm the projected 20% upside move.

QOn the ETH/USD chart, what are the significant support and resistance zones mentioned?

AThe significant support zone on the ETH/USD chart is around $1,900-$1,950. The significant resistance zone, referred to as the 'pink resistance zone,' is roughly between $2,120 and $2,200.

QWhat is the ultimate price target for Ethereum in USD if the bullish scenario outlined by the analyst plays out?

AThe ultimate price target for Ethereum in the bullish scenario is to push above the pink resistance zone to $2,400 and potentially even higher.

Related Reads

a16z: AI's 'Amnesia', Can Continuous Learning Cure It?

The article "a16z: AI's 'Amnesia' – Can Continual Learning Cure It?" explores the limitations of current large language models (LLMs), which, like the protagonist in the film *Memento*, are trapped in a perpetual present—unable to form new memories after training. While methods like in-context learning (ICL), retrieval-augmented generation (RAG), and external scaffolding (e.g., chat history, prompts) provide temporary solutions, they fail to enable true internalization of new knowledge. The authors argue that compression—the core of learning during training—is halted at deployment, preventing models from generalizing, discovering novel solutions (e.g., mathematical proofs), or handling adversarial scenarios. The piece introduces *continual learning* as a critical research direction to address this, categorizing approaches into three paths: 1. **Context**: Scaling external memory via longer context windows, multi-agent systems, and smarter retrieval. 2. **Modules**: Using pluggable adapters or external memory layers for specialization without full retraining. 3. **Weights**: Enabling parameter updates through sparse training, test-time training, meta-learning, distillation, and reinforcement learning from feedback. Challenges include catastrophic forgetting, safety risks, and auditability, but overcoming these could unlock models that learn iteratively from experience. The conclusion emphasizes that while context-based methods are effective, true breakthroughs require models to compress new information into weights post-deployment, moving from mere retrieval to genuine learning.

marsbit58m ago

a16z: AI's 'Amnesia', Can Continuous Learning Cure It?

marsbit58m ago

Can a Hair Dryer Earn $34,000? Deciphering the Reflexivity Paradox in Prediction Markets

An individual manipulated a weather sensor at Paris Charles de Gaulle Airport with a portable heat source, causing a Polymarket weather market to settle at 22°C and earning $34,000. This incident highlights a fundamental issue in prediction markets: when a market aims to reflect reality, it also incentivizes participants to influence that reality. Prediction markets operate on two layers: platform rules (what outcome counts as a win) and data sources (what actually happened). While most focus on rules, the real vulnerability lies in the data source. If reality is recorded through a specific source, influencing that source directly affects market settlement. The article categorizes markets by their vulnerability: 1. **Single-point physical data sources** (e.g., weather stations): Easily manipulated through physical interference. 2. **Insider information markets** (e.g., MrBeast video details): Insiders like team members use non-public information to trade. Kalshi fined a剪辑师 $20,000 for insider trading. 3. **Actor-manipulated markets** (e.g., Andrew Tate’s tweet counts): The subject of the market can control the outcome. Evidence suggests Tate’sociated accounts coordinated to profit. 4. **Individual-action markets** (e.g., WNBA disruptions): A single person can execute an event to profit from their pre-placed bets. Kalshi and Polymarket handle these issues differently. Kalshi enforces strict KYC, publicly penalizes insider trading, and reports to regulators. Polymarket, with its anonymous wallet-based system, has historically been more permissive, arguing that insider information improves market accuracy. However, it cooperated with authorities in the "Van Dyke case," where a user traded on classified government information. The core paradox is reflexivity: prediction markets are designed to discover truth, but their financial incentives can distort reality. The more valuable a prediction becomes, the more likely participants are to influence the event itself. The market ceases to be a mirror of reality and instead shapes it.

marsbit2h ago

Can a Hair Dryer Earn $34,000? Deciphering the Reflexivity Paradox in Prediction Markets

marsbit2h ago

Trading

Spot
Futures

Hot Articles

What is $BITCOIN

DIGITAL GOLD ($BITCOIN): A Comprehensive Analysis Introduction to DIGITAL GOLD ($BITCOIN) DIGITAL GOLD ($BITCOIN) is a blockchain-based project operating on the Solana network, which aims to combine the characteristics of traditional precious metals with the innovation of decentralized technologies. While it shares a name with Bitcoin, often referred to as “digital gold” due to its perception as a store of value, DIGITAL GOLD is a separate token designed to create a unique ecosystem within the Web3 landscape. Its goal is to position itself as a viable alternative digital asset, although specifics regarding its applications and functionalities are still developing. What is DIGITAL GOLD ($BITCOIN)? DIGITAL GOLD ($BITCOIN) is a cryptocurrency token explicitly designed for use on the Solana blockchain. In contrast to Bitcoin, which provides a widely recognized value storage role, this token appears to focus on broader applications and characteristics. Notable aspects include: Blockchain Infrastructure: The token is built on the Solana blockchain, known for its capacity to handle high-speed and low-cost transactions. Supply Dynamics: DIGITAL GOLD has a maximum supply capped at 100 quadrillion tokens (100P $BITCOIN), although details regarding its circulating supply are currently undisclosed. Utility: While precise functionalities are not explicitly outlined, there are indications that the token could be utilized for various applications, potentially involving decentralized applications (dApps) or asset tokenization strategies. Who is the Creator of DIGITAL GOLD ($BITCOIN)? At present, the identity of the creators and development team behind DIGITAL GOLD ($BITCOIN) remains unknown. This situation is typical among many innovative projects within the blockchain space, particularly those aligning with decentralized finance and meme coin phenomena. While such anonymity may foster a community-driven culture, it intensifies concerns about governance and accountability. Who are the Investors of DIGITAL GOLD ($BITCOIN)? The available information indicates that DIGITAL GOLD ($BITCOIN) does not have any known institutional backers or prominent venture capital investments. The project seems to operate on a peer-to-peer model focused on community support and adoption rather than traditional funding routes. Its activity and liquidity are primarily situated on decentralized exchanges (DEXs), such as PumpSwap, rather than established centralized trading platforms, further highlighting its grassroots approach. How DIGITAL GOLD ($BITCOIN) Works The operational mechanics of DIGITAL GOLD ($BITCOIN) can be elaborated on based on its blockchain design and network attributes: Consensus Mechanism: By leveraging Solana’s unique proof-of-history (PoH) combined with a proof-of-stake (PoS) model, the project ensures efficient transaction validation contributing to the network's high performance. Tokenomics: While specific deflationary mechanisms have not been extensively detailed, the vast maximum token supply implies that it may cater to microtransactions or niche use cases that are still to be defined. Interoperability: There exists the potential for integration with Solana’s broader ecosystem, including various decentralized finance (DeFi) platforms. However, the details regarding specific integrations remain unspecified. Timeline of Key Events Here is a timeline that highlights significant milestones concerning DIGITAL GOLD ($BITCOIN): 2023: The initial deployment of the token occurs on the Solana blockchain, marked by its contract address. 2024: DIGITAL GOLD gains visibility as it becomes available for trading on decentralized exchanges like PumpSwap, allowing users to trade it against SOL. 2025: The project witnesses sporadic trading activity and potential interest in community-led engagements, although no noteworthy partnerships or technical advancements have been documented as of yet. Critical Analysis Strengths Scalability: The underlying Solana infrastructure supports high transaction volumes, which could enhance the utility of $BITCOIN in various transaction scenarios. Accessibility: The potential low trading price per token could attract retail investors, facilitating wider participation due to fractional ownership opportunities. Risks Lack of Transparency: The absence of publicly known backers, developers, or an audit process may yield skepticism regarding the project's sustainability and trustworthiness. Market Volatility: The trading activity is heavily reliant on speculative behavior, which can result in significant price volatility and uncertainty for investors. Conclusion DIGITAL GOLD ($BITCOIN) emerges as an intriguing yet ambiguous project within the rapidly evolving Solana ecosystem. While it attempts to leverage the “digital gold” narrative, its departure from Bitcoin's established role as a store of value underscores the need for a clearer differentiation of its intended utility and governance structure. Future acceptance and adoption will likely depend on addressing the current opacity and defining its operational and economic strategies more explicitly. Note: This report encompasses synthesised information available as of October 2023, and developments may have transpired beyond the research period.

363 Total ViewsPublished 2025.05.13Updated 2025.05.13

What is $BITCOIN

Discussions

Welcome to the HTX Community. Here, you can stay informed about the latest platform developments and gain access to professional market insights. Users' opinions on the price of BTC (BTC) are presented below.

活动图片