El breve repunte del Bitcoin por encima de los 75.000 dólares esta semana generó un optimismo alcista en algunos rincones del mercado de criptomonedas, pero el análisis técnico muestra que la tendencia podría seguir siendo bajista. Una mirada detallada a los gráficos diarios y semanales de BTC cuenta una historia más sobria, una que muestra que el rey de las criptomonedas podría continuar con un movimiento de corrección a la baja en los próximos días.
Bitcoin Sigue Atrapado Dentro de una Bandera Bajista
La recuperación del precio de Bitcoin hasta los 70.000 y pico de dólares esta semana no es suficiente por sí sola para confirmar que Bitcoin está fuera de peligro. Según el analista de criptomonedas CrypFlow, la tendencia general está empezando a parecer constructiva en marcos temporales más altos, pero el gráfico diario aún muestra una estructura bajista que no ha sido invalidada. Hasta que eso cambie, el último rebote puede no ser nada.
El gráfico de velas diarias muestra que BTC ha pasado las últimas semanas desde principios de febrero consolidándose dentro de una estructura de canal ascendente. Este es un patrón que, en el contexto de una tendencia a la baja previa, se clasifica técnicamente como una bandera bajista.
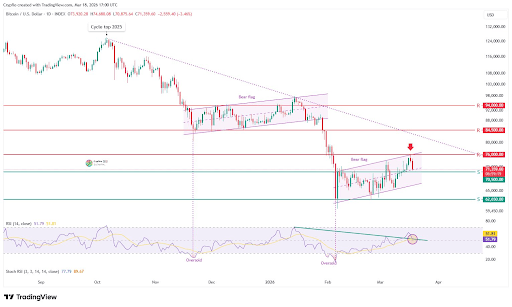
El gráfico muestra a Bitcoin subiendo hacia el límite superior de la bandera cerca del área de 76.000 dólares antes de ser rechazado. Esa misma región también coincide con una banda de resistencia importante marcada en el gráfico, reforzando la idea de que los toros aún no han hecho lo suficiente para invertir la estructura. El precio de BTC desde entonces ha caído hacia la mitad del canal, dejando a la principal criptomoneda en un punto de decisión a corto plazo.
Como se ve en el gráfico a continuación, se formó una bandera bajista similar desde mediados de noviembre de 2025 hasta finales de enero de 2026, y esto eventualmente condujo a la caída a 60.000 dólares a principios de febrero de 2026.
La Zona de 70.000 a 76.000 Dólares Ahora Importa Más que Nunca
La batalla actual se está librando entre la línea media de la bandera y la zona de rechazo reciente está en 76.000 dólares. Al momento de escribir este artículo, Bitcoin se negocia a 70.610 dólares, lo que lo coloca cerca del soporte alrededor de 70.000 dólares. Si BTC cierra la semana por debajo de 70.000 dólares, entonces la bandera bajista proyecta el precio en el camino a al menos 65.000 dólares.
En un análisis separado, CrypFlow dirigió la atención al marco temporal semanal y planteó una preocupación de nivel más macro utilizando el indicador del Canal Gaussiano de Bitcoin. Este modelo analiza cómo se ha comportado Bitcoin a lo largo de ciclos completos de mercado.
Según el analista, Bitcoin nunca ha formado su fondo de ciclo antes de que el Canal Gaussiano cambie de verde a rojo. Cada fondo importante ha llegado después de que esa transición ya haya tenido lugar. Este patrón se repitió consistentemente en 2015, 2018 y nuevamente en 2022, donde los mínimos finales solo llegaron una vez que el canal se había vuelto completamente bajista.
Curiosamente, el Canal Gaussiano hizo la transición de verde a rojo después del mínimo de Bitcoin a principios de febrero, no antes. Aunque el precio de Bitcoin todavía se mantiene por encima de 60.000 dólares por ahora, la implicación es que este nivel puede no ser el fondo final.


