Author: Novora
Compiled by: Deep Tide TechFlow
Deep Tide Intro: Among 150 leading protocols, 91% generate on-chain revenue, but only 8% publish investor reports, and less than 1% disclose market maker terms. The data is all on-chain, and third-party platforms also cover it, but protocols simply aren't packaging it for institutional view. This is not a data availability issue, but more of a communication gap.
Disclosure Rate
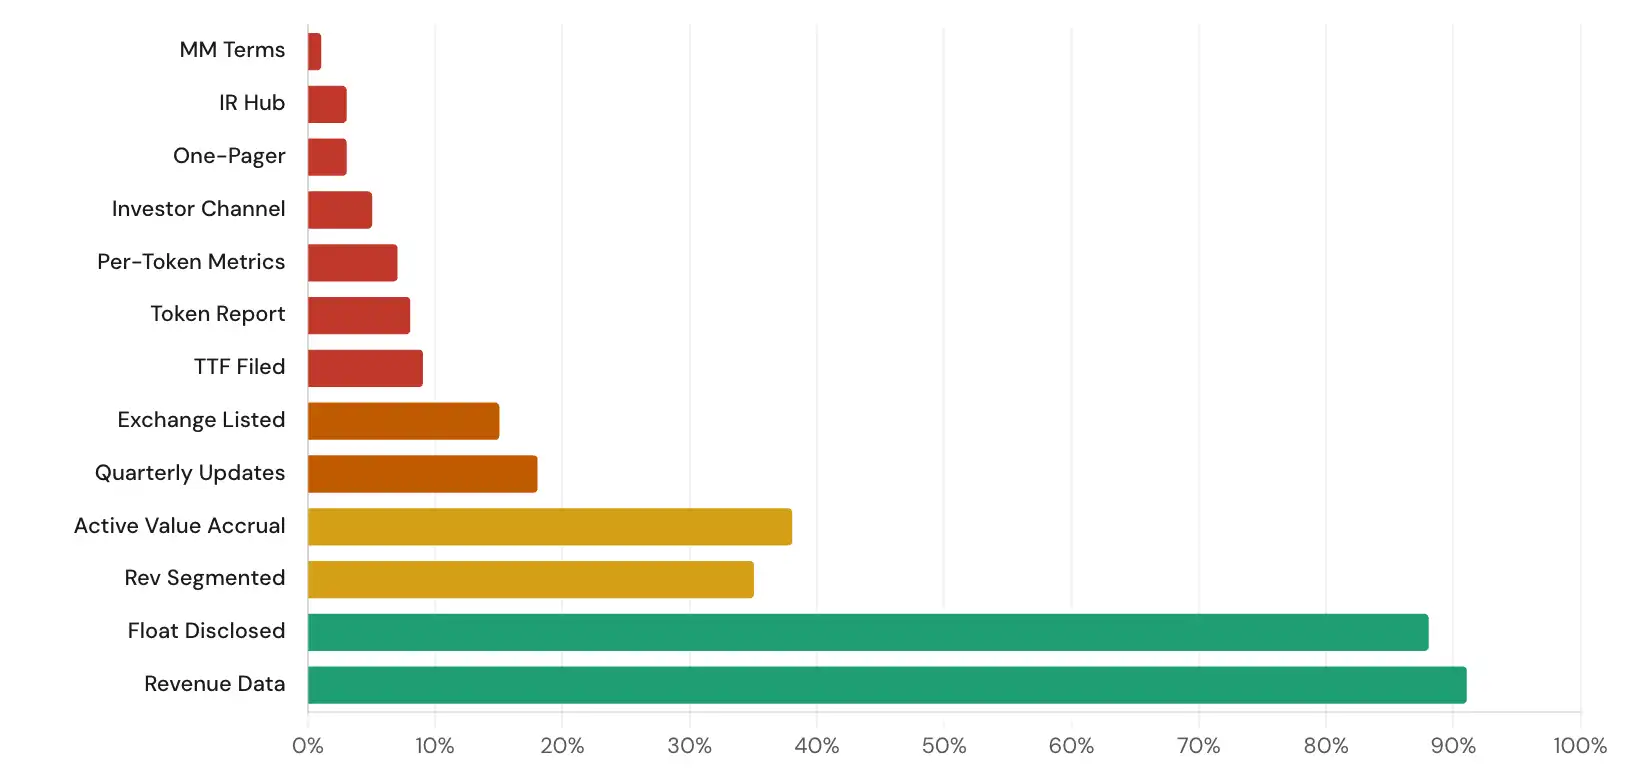
We evaluated 13 disclosure metrics across 150+ protocols. The gap between what traditional markets require for disclosure and what crypto protocols voluntarily provide is structural, not accidental.
Less than 1% of protocols disclose market maker terms. In traditional stock markets, market maker agreements are standard disclosure items filed with exchanges. In crypto, Meteora was the only protocol in our entire 150+ dataset that publicly disclosed information about its market making arrangements, via its 2025 Annual Token Holder Report.
Third-Party Data Coverage
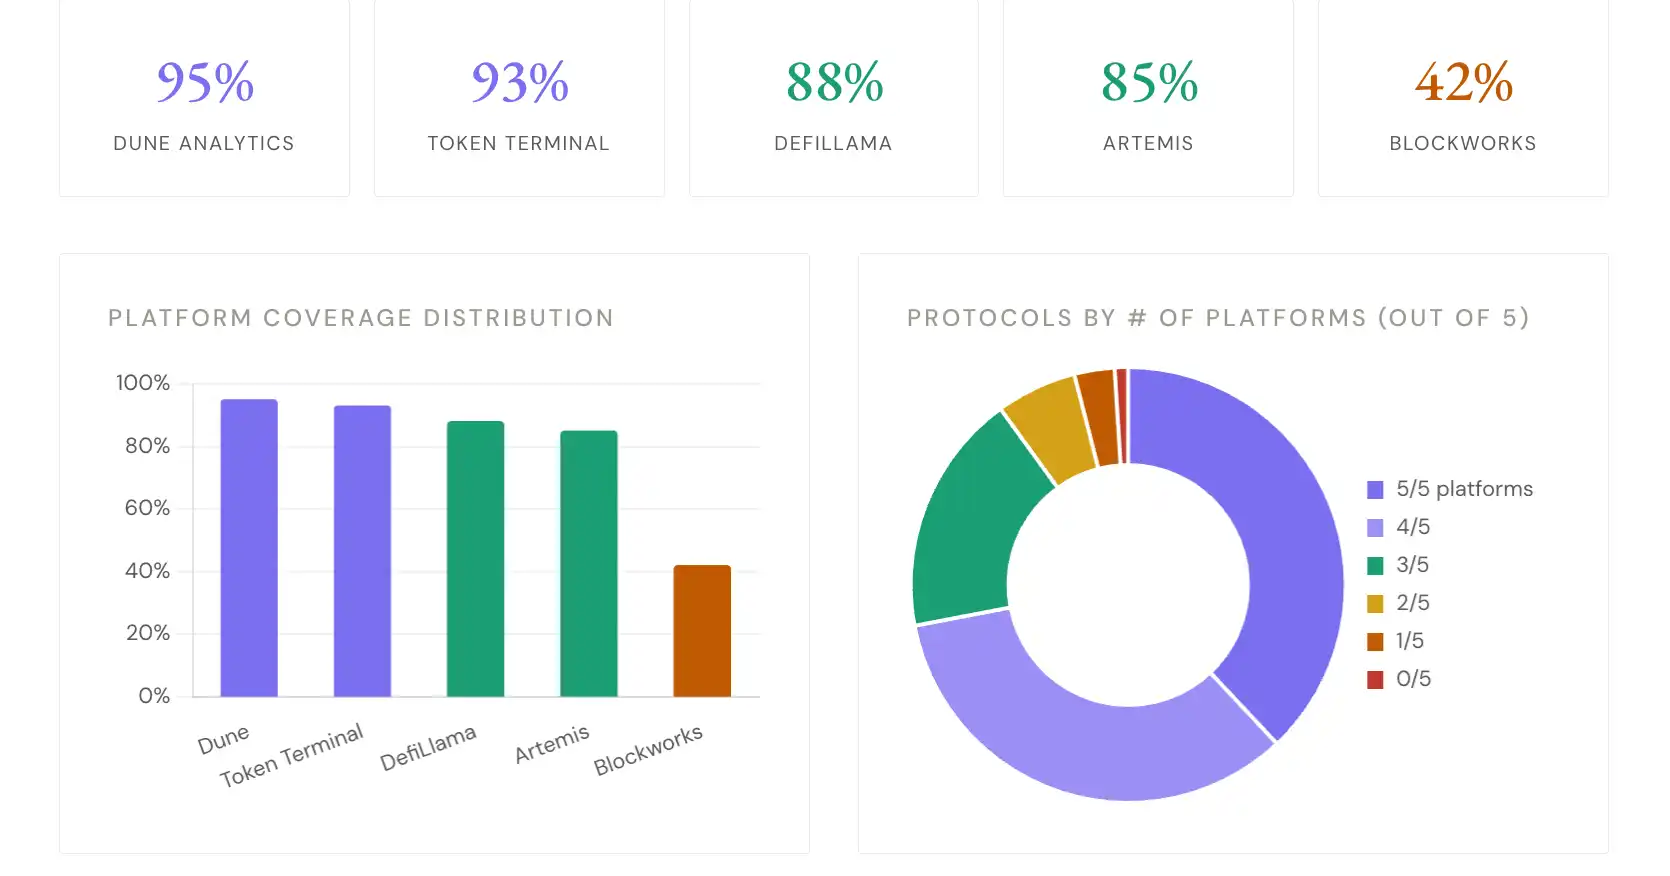
We evaluated 5 major data platforms. Coverage reflects whether each protocol has a dedicated profile containing meaningful data beyond basic price information.
72% of protocols are covered by 4 or more platforms. Third-party data infrastructure has matured significantly. The data exists. The issue is not data availability, but that protocols are not leveraging this data in structured investor communications.
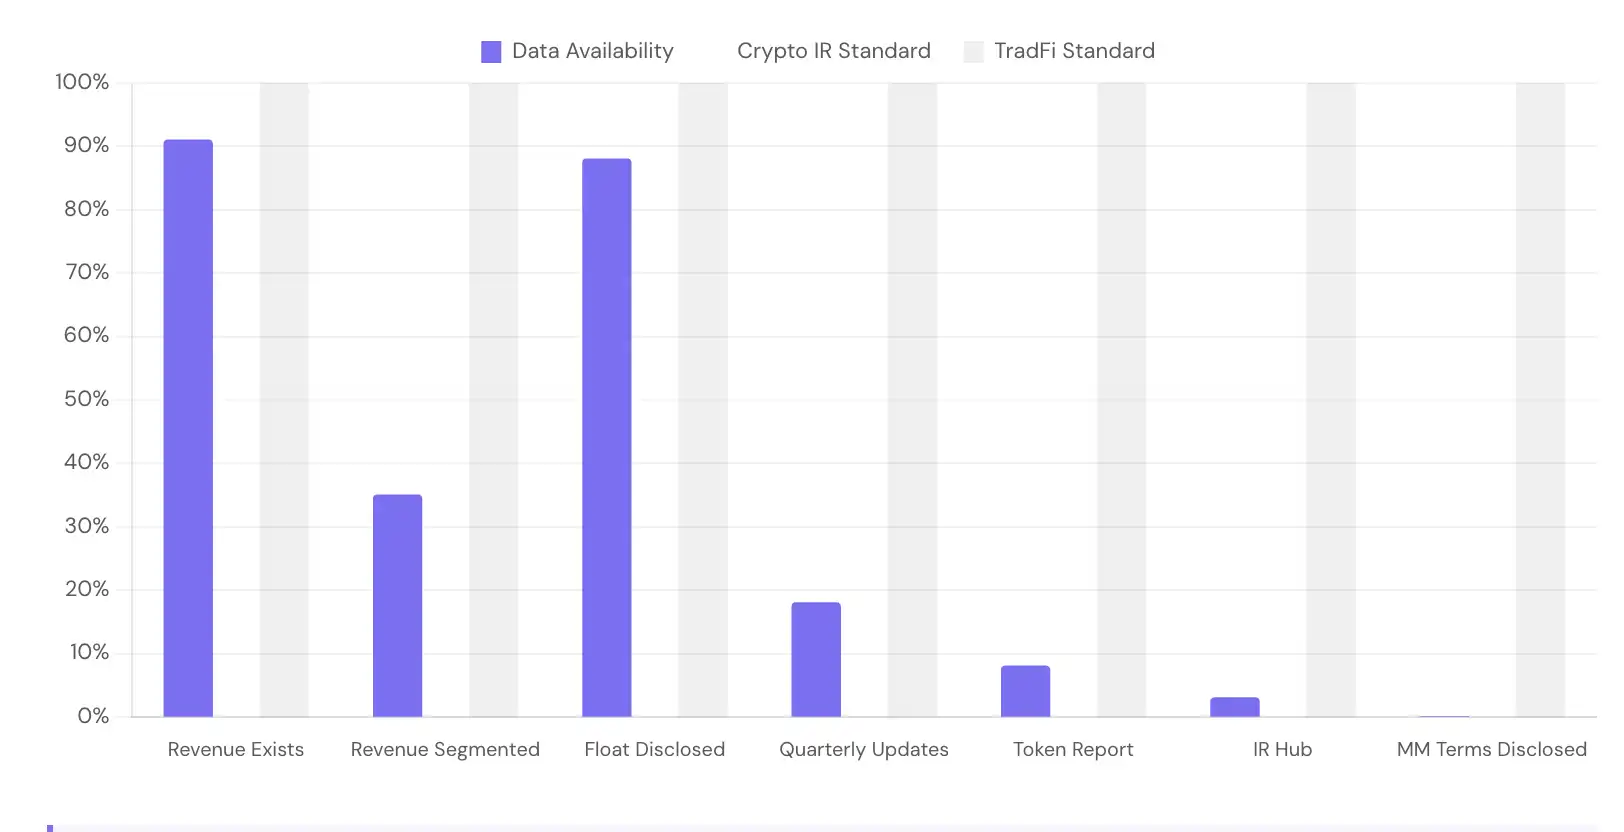
The Transparency Paradox
Revenue exists on-chain. Reports exist nowhere. This chart shows the disconnect between data availability and investor communication.
91% of protocols generate trackable revenue. 8% publish token holder reports. The data is there. It's on-chain, indexed by third-party platforms, and publicly verifiable. But fewer than one in ten protocols package this data into a format usable by institutional investors. This is the investor relations gap defining the industry.
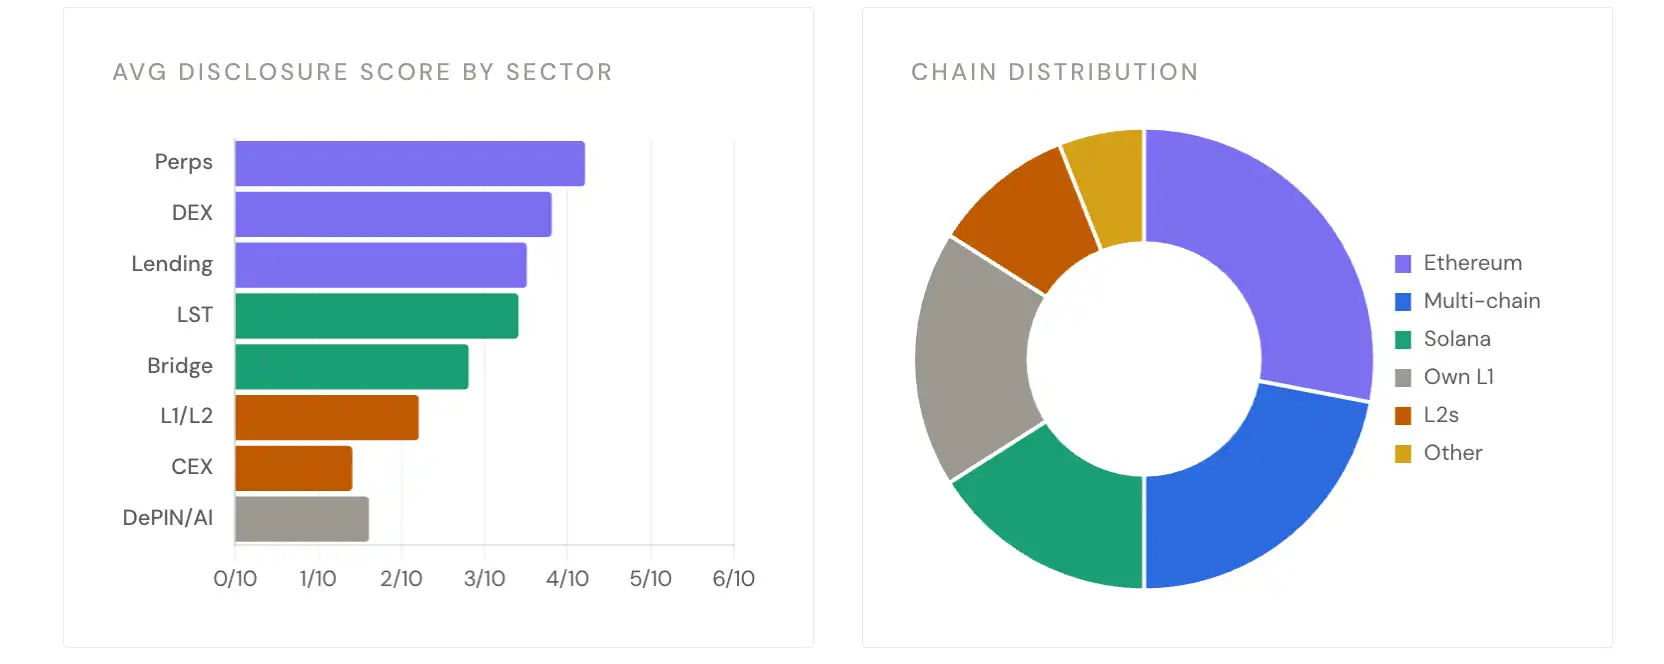
Industry Breakdown
Disclosure practices vary dramatically by industry. DeFi protocols, particularly DEXs and lending, lead in transparency. L1 and infrastructure protocols, despite larger market caps, lag behind.
Token Transparency Framework
Blockworks launched the Token Transparency Framework (TTF) in June 2025, filed jointly with Jito to the SEC. 13 protocols have filed. Here's who they are and what this means.
TTF adoption is at 9%, up from 0% in June 2025. The 13 filers are heavily skewed towards Solana (6/13) and revenue-generating DeFi protocols. Zero L1s, zero L2s, zero infrastructure protocols have filed. The framework was submitted to the SEC with bipartisan support from Pantera, Theia, and L1D. But adoption is still growing slowly.
Active Value Accrual
38% of protocols have some form of active value accrual: a mechanism to return economic value to token holders, beyond just governance rights. But "value accrual" is not one thing. We identified six different models in the dataset.
The alpha is not in the mechanism itself. It's in the revenue. Any active accrual model outperformed governance-only tokens by approximately 19 percentage points on a 1-year return basis. But within the active group, daily revenue size was the differentiating factor. Governance-only tokens averaged a -51% return, while active accrual tokens averaged -32% over the same period. The mechanism itself matters less than the fact that a mechanism exists.
Key Findings
Six patterns emerging from evaluating all 15 metrics across 150+ protocols.
Six Numbers on the State of Crypto Investor Relations
The gap between institutional investor expectations and what crypto protocols provide, quantified.
Protocol Index
Each protocol evaluated in this report. Sorted alphabetically. ✓ = Disclosed/Exists. ✗ = Not Disclosed/Missing. Hover on mobile to view full row.
150+ protocols evaluated on 18 total metrics (13 disclosure + 5 platform coverage). This index represents the most comprehensive assessment of crypto investor relations practices to date. The full dataset is maintained in the Novora Investor Relations Benchmark Database, updated quarterly.
Click here for full content