Author: BIT
Investment Summary

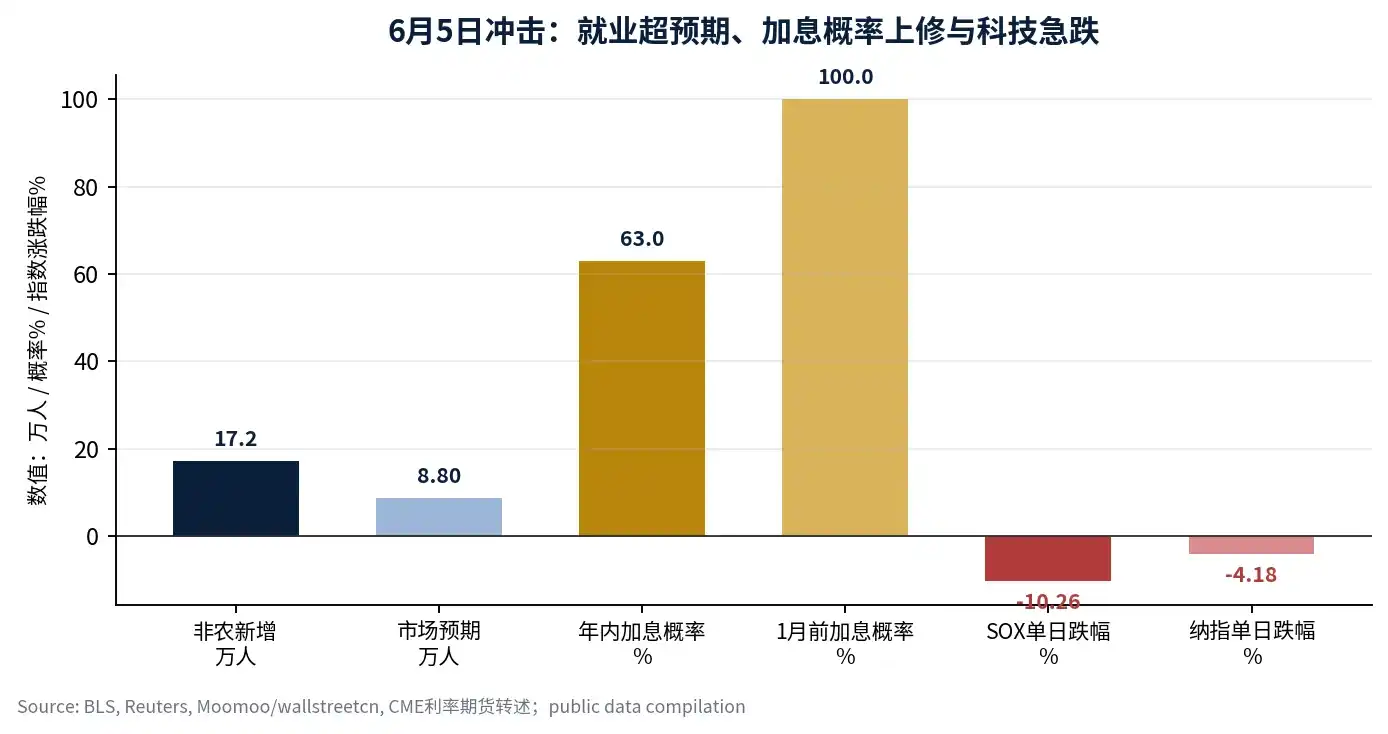
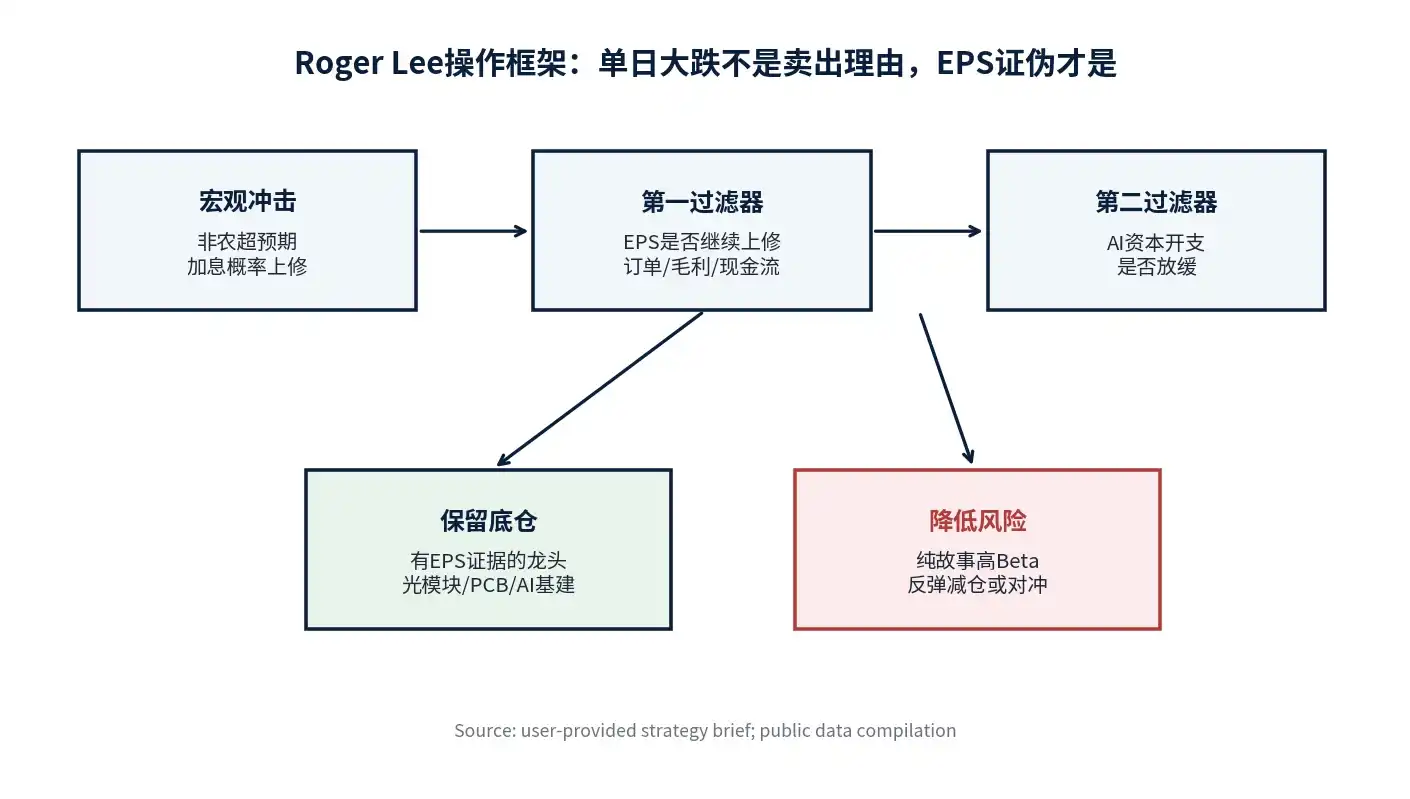
My conclusion is simple: the true killers of a tech rally are not the Fed hiking rates by another 25 basis points, but industry overcapacity and EPS being invalidated. Before these two signals appear, the sharp decline like the one on June 5th is more akin to "pulling back to pick up passengers," not a "crash and total loss." This statement is the main thesis of this report and my principle for managing positions amid this round of interest rate hike panic. The US non-farm payrolls added 172k jobs in May, significantly higher than the market expectation of 88k, pushing market expectations for a rate hike this year to 63% and close to 100% before January next year. The Philadelphia Semiconductor Index fell over 10% that day, and the Nasdaq fell 4.18%. However, I will not abandon the tech theme because of a single macro data day, because historically, what truly determines whether tech stocks can weather interest rate fluctuations is not the rates themselves, but whether EPS is still being revised upwards. [1] [2]
My judgment is that the current AI trade has shifted from a "broad-brush narrative" phase to a "tightening circle verification" phase. This is not a stage where one can continue buying all high-beta tech stocks indiscriminately, nor is it a stage where the AI theme has ended. Core positions should be allocated to leading assets with high order visibility, stable gross margins, strong cash flow quality, and EPS that can still be revised upwards by analysts; for stocks in quantum computing, aerospace, some small-cap chip story stocks lacking a profit loop, one should reduce positions or hedge portfolio volatility using options structures during rebounds.
I. Fact Check: Rate Hike Panic Is a Trigger, Not the Root Cause
The market reaction on June 5th was very sharp, but the trigger chain was not complex. Official BLS data shows US non-farm payrolls increased by 172k in May, with the unemployment rate holding at 4.3%, and March and April payrolls revised up by a total of 93k; strong employment data intensified market concerns about sticky inflation and further rate hikes. [3] Reuters and market reports show the Nasdaq fell 4.18% that day, the Philadelphia Semiconductor Index (SOX) fell over 10% in a single day, and investors quickly repriced risk assets for a "higher for longer" interest rate scenario. [1] [2]
| Variable |
Change Around June 5 |
My Interpretation |
| US May Non-Farm Payrolls |
172k, significantly higher than 88k expectation |
Short-term repricing on the interest rate front, but employment structure still needs to look at wages and inflation transmission |
| Unemployment Rate |
4.3%, flat vs. prior |
Labor market shows no recessionary deterioration, suppressing rate cut expectations instead |
| Rate Hike Probability This Year |
Market transmission rises to 63% |
Valuation pressure on long-duration assets, first hitting high-valuation tech |
| SOX Index |
Single-day drop over 10% |
Semiconductors are the core crowded trade, first hit by liquidity shock |
| Nasdaq Index |
Single-day drop 4.18% |
Clear panic at the index level, but does not equate to AI EPS being invalidated |
I define this decline as a concentrated release of interest rate shock combined with a crowded trade. It will wipe out the part of valuation that expanded too quickly and force capital to withdraw from weak-thesis, high-volatility, low-profit-certainty stocks; but if there is no substantial downgrade in AI infrastructure orders, cloud provider capex, GPU/optical module/PCB demand, the tech theme has not ended because of this day's decline.
II. Historical Review: The Lesson from 1999 Is Not "Chase Bubbles," but "Look at EPS"
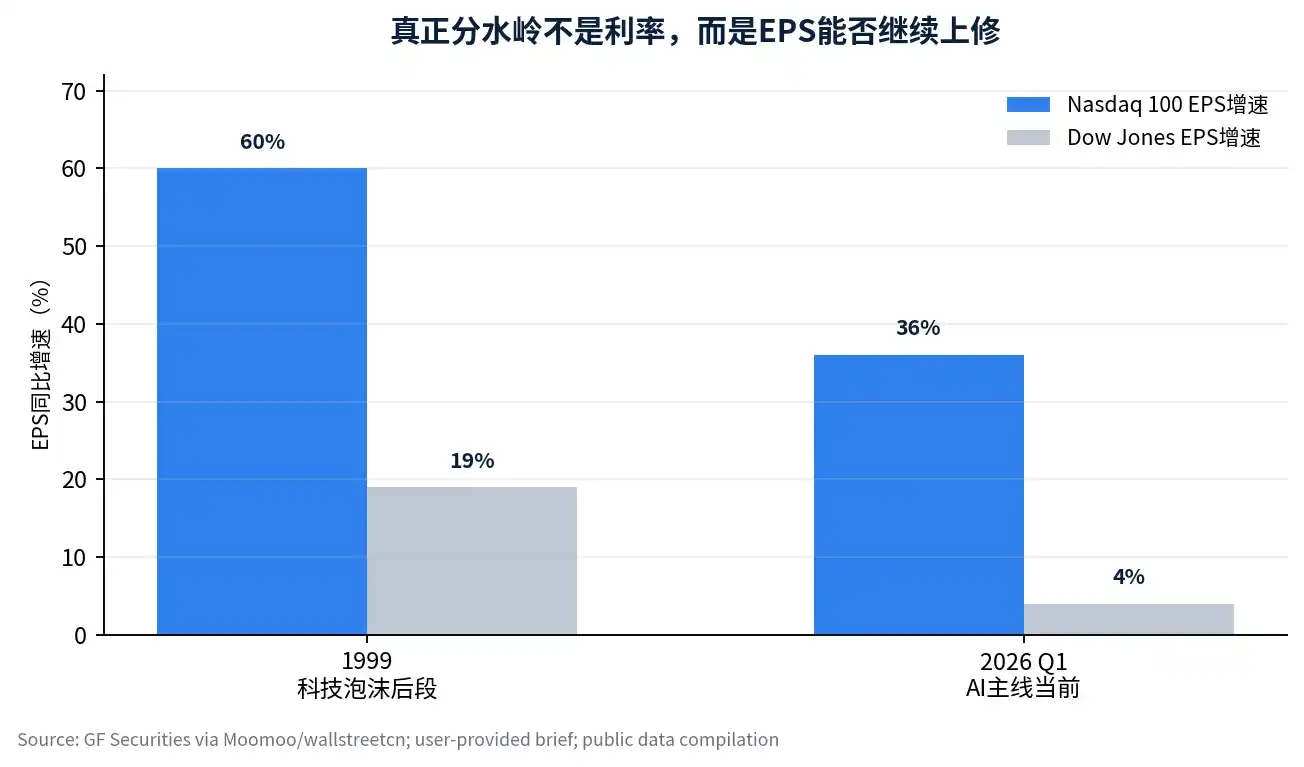
The 1999 dot-com bubble period is often cited as a warning for today's tech stocks, but I believe this analogy cannot focus solely on valuation; it must also look at earnings. At that time, the Fed entered a continuous rate hike cycle, the Dow traded sideways overall, while the Nasdaq continued to rise sharply until peaking in March 2000. Moomoo's reposted institutional research mentions that in 1999, Nasdaq 100 EPS grew about 60%, while Dow EPS growth lagged significantly; by Q1 2026, Nasdaq 100 EPS grew about 36%, the Dow about 4%, revealing a renewed profit divergence structure. [2]
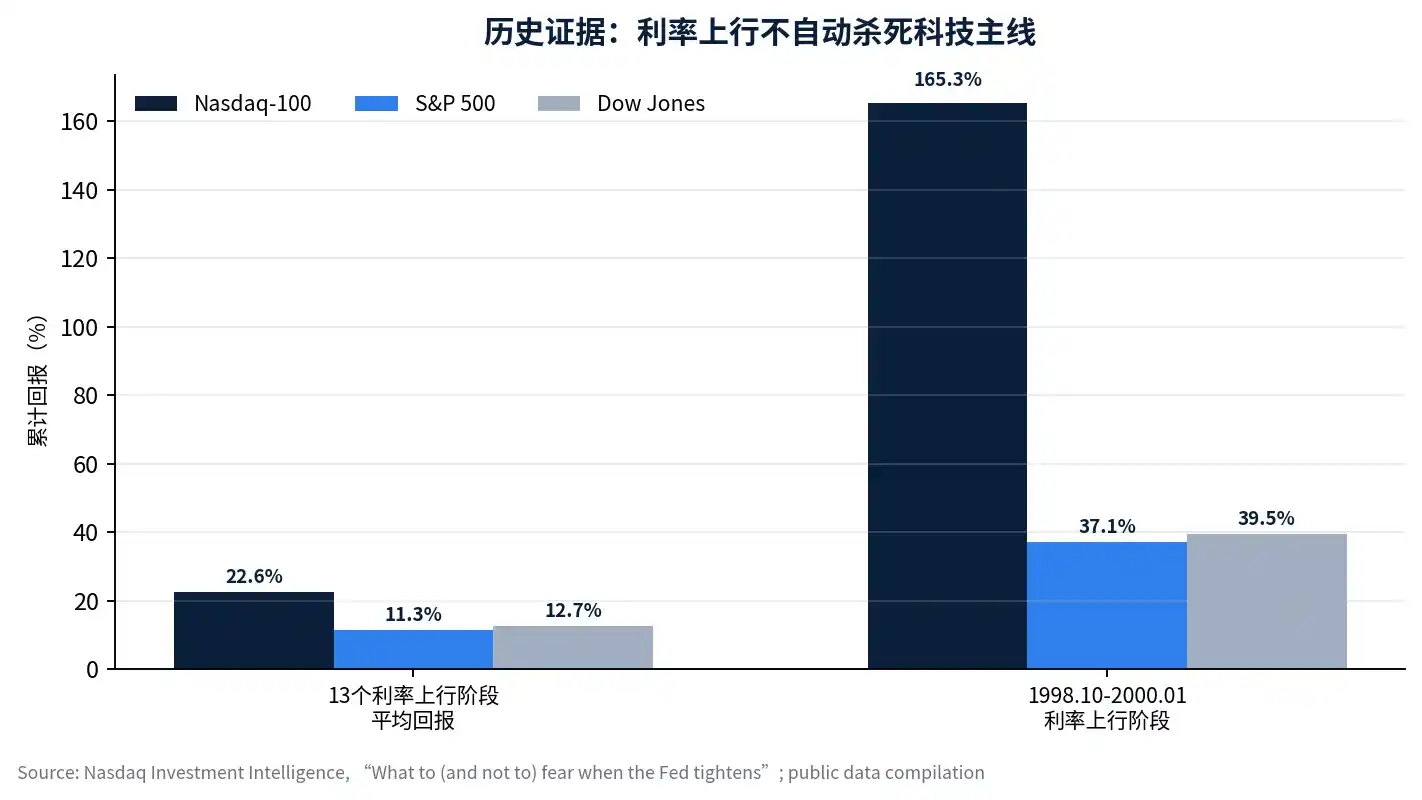
Nasdaq Investment Intelligence's research on past rate-hike phases over the past 30+ years also supports the same conclusion. Among the 13 rate-hike phases lasting at least 6 months between 1985 and 2021, the Nasdaq-100 had an average cumulative return of 22.6%, higher than the S&P 500's 11.3% and the Dow's 12.7%; in the phase from October 1998 to January 2000 when the 10-year Treasury yield rose about 220 basis points, the Nasdaq-100 rose 165.3%, significantly exceeding the S&P 500 and Dow. [4]
The inspiration this history gives me is not "high valuations can rise forever," but that interest rates are not a sufficient condition for selling tech stocks. The real dangers are two things: first, stock prices are driven only by PE expansion, with EPS not keeping up; second, industry competition begins to deteriorate, with leading players' gross margins and cash flows turning down first. If these two things haven't happened, interest rate hikes are more about adjusting the pace, not directly sentencing the main theme to death.
III. Valuation Framework: Focus on Business Cycle Short-Term, Safety Margin Long-Term
I do not agree with mechanically judging whether AI leaders are in a bubble using a single PE or PB percentile. In the short term (one-year horizon), stock prices are primarily determined by revenue growth rate, change in ROE, and EPS revision direction; in a three-to-five-year horizon, PB, free cash flow yield, and capital return cycle will truly determine long-term returns. Pacer ETFs' Nasdaq-100 research shows that at the end of 1999, the Nasdaq-100 was about 73x earnings with a free cash flow yield of only 0.76%; at the end of 2023, it was about 31x earnings with a free cash flow yield of 2.68%, and the current leaders' sales, profit, and free cash flow scale are also incomparable to internet bubble companies in 1999. [5]
| Valuation Question |
Wrong View |
My Judgment Method |
| Does High PB Mean Bubble? |
High PB equals bubble |
Look at ROE, technological moat, capex return rate, and EPS revision direction |
| Must High PE Be Sold? |
Reduce position if PE percentile is high |
If EPS keeps being revised up, high PE may be digested by earnings; high PE is dangerous only if EPS stagnates |
| Are AI Leaders Too Crowded? |
Crowded equals topping |
Crowding is more like a signal for tightening the circle, with capital flowing from weak assets back to strong ones |
| How to Handle Rate Hikes? |
Sell tech entirely |
Reduce leverage, discard the weak and retain the strong, keep core positions with strongest EPS evidence |
Therefore, I categorize AI core assets into two types. The first type are "toll booth assets" with real orders, real gross margins, and real cash flows, including the AI server chain, advanced packaging, optical modules, PCBs, core suppliers for cloud capex, etc. The second type are high-beta assets with only long-term narratives and vague profit realization paths, such as some quantum computing, aerospace, concept chip, and small software stocks lacking order validation. The former should be considered for buying windows during sharp declines, while the latter should reduce risk exposure during rebounds.
IV. Crowding: This Is Tightening the Circle, Not the First Top
The current capital concentration on AI core assets, creating a siphon effect away from dividends, small/micro caps, and non-theme assets, must be acknowledged. But crowding itself does not equal a top. A real top often requires three conditions simultaneously: first, industry capital expenditure shows marginal slowdown; second, leading players' competitive landscape deteriorates, with price wars or gross margin declines emerging; third, the EPS upward revision trend stops, even reverses to downgrades. So far, this round of adjustment aligns more with the characteristics of a "left-stage rotation from high to low" and "tightening the circle of the main theme," rather than confirming the first medium-term top for AI. [2]
I will regard the period from late June to the Q2 earnings season in July as the real verification window. Interim report previews for A-shares, Q2 guidance for US tech stocks, cloud providers' capex language, and semiconductor supply chain order visibility will collectively determine whether this adjustment is a healthy turnover or the beginning of earnings invalidation for the main theme.
V. My Investment Interpretation: Don't Abandon the Tech Theme, But Must Discard the Weak and Retain the Strong
My operational principle is: allocate core positions to leaders with EPS evidence, and no longer waste risk budget on high-beta varieties with pure narratives. Within the AI infrastructure chain, I prefer holding companies with high order visibility, stable gross margins, good cash flows, and those in rigid segments of customer capital expenditure. Optical modules, PCBs, AI servers, advanced packaging, cloud infrastructure, and software platforms with pricing power are areas where I am willing to tolerate volatility.
| Asset Category |
Current Action |
Core Rationale |
Risk Control |
| AI Infrastructure Leaders |
Keep core positions, observe on batches during sharp drops |
EPS and order evidence still exists, short-term rate shock doesn't change industry trend |
Don't chase highs, wait for key nodes to pass |
| Optical Modules/PCB/Advanced Packaging |
Maintain core focus |
Most direct transmission of AI server capex to hardware chain |
Reduce weight immediately if gross margin or orders downgraded |
| Cloud & Platform Software |
Select those with strong ecosystem moats |
AI application entry points and enterprise refresh cycles still have long-term value |
Guard against excessive valuation front-running |
| Quantum/Aerospace/Some Concept Chips |
Reduce positions on rebounds |
Strong narrative, weak EPS, most vulnerable to valuation compression during rate hikes |
Can use options to hedge high-beta exposure |
| Dividend & Cash-like Assets |
As portfolio stabilizer |
Hedge macro node uncertainty |
Don't treat defensive positions as long-term main theme |
This is not blind optimism. On the contrary, I believe the coming month requires stricter monitoring of four nodes: CPI on June 10th – if core inflation exceeds expectations due to oil price transmission, reduce leverage; Oil prices and US-Iran tensions – if oil prices remain high long-term, will increase inflation stickiness; Mid-June ECB and BOJ meetings – will impact global liquidity; Waller's speech on June 18th – if extremely hawkish, will reshape rate path pricing. Macro nodes determine the rhythm, EPS determines the direction.
VI. Conclusion: Pulling Back to Pick Up Passengers, But Only Those With Earnings
I will not abandon the tech theme because of the single-day sharp decline on June 5th, but I will upgrade my portfolio from "buying the AI story" to "buying the AI income statement." If a company can prove sustained fulfillment of orders, gross margins, cash flow, and EPS, its decline amid interest rate shock is more like an opportunity; if a company only has a concept without a profit path, it should be reduced during rebounds.
The final conclusion remains the opening sentence: the killers of a tech rally are industry overcapacity and EPS being invalidated, not the Fed hiking by another 25bp. The current adjustment is "pulling back to pick up passengers," not a "crash and total loss"; hold positions with earnings, wait for the four major nodes to pass.
This report is prepared by a guest analyst. The views expressed herein represent the author's personal stance and do not represent the views of the BIT platform. This material is for reference only and does not constitute investment advice.